Investment Banking, valuation and M&A
Подождите немного. Документ загружается.

P1: ABC/ABC P2:c/d QC:e/f T1:g
c05 JWBT063-Rosenbaum March 18, 2009 15:37 Printer Name: Hamilton
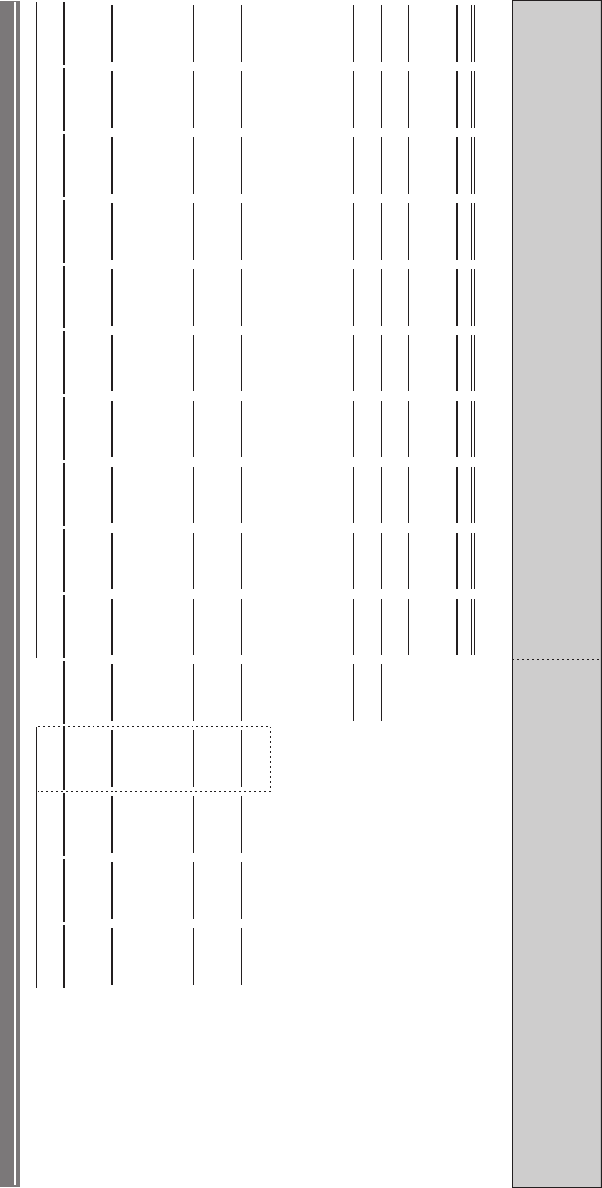
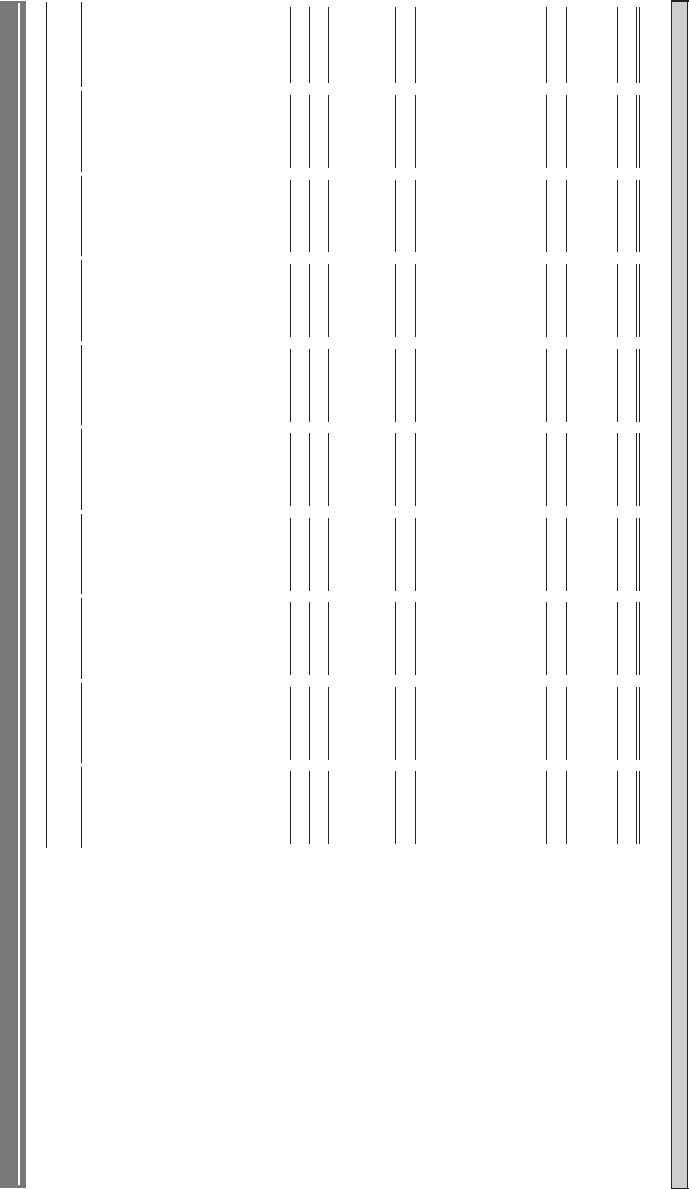
EXHIBIT 5.31
Pro Forma ValueCo Income Statement
($ in millions, fiscal year ending December 31)
Historical Period
Projection Period
LTM Pro forma Year 1
Year 2 Year 3 Year 4
Year 10
Year 9
Year 8
Year 7
Year 6
Year 5
2005
2006
2007
9/30/2008
2008
2009
2010
2011
2012
2013
2014
2015
2016
2017
2018
Sales
$780.0
$850.0
$925.0
$977.8
$1,000.0 $1,080.0
$1,144.8
$1,190.6
$1,226.3
$1,263.1
$1,301.0
$1,340.0
$1,380.2
$1,421.6
$1,464.3
%0.9
AN
% growth
8.8%
NA 8.1%
8.0%
6.0%
4.0%
3.0%
3.0%
3.0%
3.0%
3.0%
3.0%
3.0%
Cost of Goods Sold
471.9
512.1
555.0
586.7
600.0
648.0
686.9
714.4
735.8
757.9
780.6
804.0
828.1
853.0
878.6
1.803$
Gross Profit
$337.9
$370.0
$391.1
$400.0
$432.0
$457.9
$476.2
$490.5
$505.2
$520.4
$536.0
$552.1
$568.7
$585.7
%5.93
% margin
39.8%
40.0%
40.0%
40.0%
40.0%
40.0%
40.0%
40.0%
40.0%
40.0%
40.0%
40.0%
40.0%
40.0%
Selling, General & Administrative
198.9
214.6
231.3
244.4
250.0 270.0
286.2
297.6
306.6
315.8
325.2
335.0
345.1
355.4
366.1
%5.52
% sales
25.3%
25.0%
25.0%
25.0%
25.0%
25.0%
25.0%
25.0%
25.0%
25.0%
25.0%
25.0%
25.0%
25.0%
Other Expense / (Income)
-
-
-
-
-
-
-
-
-
-
-
-
-
-
-
EBITDA
$109.2
$123.3
$138.8
$146.7
$150.0
$162.0
$171.7
$178.6
$183.9
$189.5
$195.1
$201.0
$207.0
$213.2
$219.6
%0.41
% margin
14.5%
15.0%
15.0%
15.0%
15.0%
15.0%
15.0%
15.0%
15.0%
15.0%
15.0%
15.0%
15.0%
15.0%
Depreciation & Amortization
15.6
17.0
18.5
19.6
20.0
21.6
22.9
23.8
24.5
25.3
26.0
26.8
27.6
28.4
29.3
6.39$
EBIT
$106.3
$120.3
$127.1
$130.0
$140.4
$148.8
$154.8
$159.4
$164.2
$169.1
$174.2
$179.4
$184.8
$190.4
%0.21
% margin
12.5%
13.0%
13.0%
13.0%
13.0%
13.0%
13.0%
13.0%
13.0%
13.0%
13.0%
13.0%
13.0%
13.0%
Interest Expense
Revolving Credit Facility
- - -
- - -
- - -
-
-
Term Loan B
29.3 27.8 25.3
22.1 18.6 14.5
9.4
3.3 -
-
-
Senior Subordinated Notes
30.0 30.0 30.0
30.0 30.0
30.0 30.0 30.0
30.0 30.0 30.0
Commitment Fee on Unused Revolver
0.5
0.5
0.5
0.5
0.5
0.5
0.5
0.5
0.5
0.5
0.5
Administrative Agent Fee
0.2
0.2
0.2
0.2
0.2
0.2
0.2
0.2
0.2
0.2
0.2
Cash Interest Expense
$59.9 $58.5 $55.9
$52.7 $49.2 $45.2
$40.0 $34.0 $30.7
$30.7 $30.7
Amortization of Deferred Financing Fees
2.5
2.5
2.5
2.5
2.5
2.5
2.5
2.2
1.0
1.0
1.0
Total Interest Expense
$62.4 $60.9 $58.4
$55.2 $51.7 $47.6
$42.5 $36.2 $31.7
$31.7 $31.7
Interest Income
-
-
-
-
-
-
(0.0)
(1.4)
(7.1)
(4.2)
Net Interest Expense
$60.9 $58.4 $55.2
$51.7 $47.6 $42.5
$36.1 $30.2
$27.5 $24.6
Earnings Before Taxes
79.5 90.4 99.6
107.7 116.6 126.7
138.1 149.2 157.3
165.8
Income Tax Expense
30.2
34.4
37.9
40.9
44.3
48.1
52.5
56.7
63.0
59.8
Net Income
$49.3
$56.1
$61.8
$66.8
$72.3
$78.5
$85.6
$97.5
$92.5
$102.8
% margin
4.6% 4.9% 5.2%
5.4% 5.7% 6.0%
6.4% 6.7% 6.9%
7.0%
Income Statement Assumptions
Sales (% YoY growth)
4.0%
6.0%
8.0%
NA 8.1%
8.8%
NA 9.0%
3.0%
3.0%
3.0%
3.0%
3.0%
3.0%
3.0%
COGS (% margin)
60.0%
60.0%
60.0%
60.0%
60.0%
60.0%
60.3%
60.5%
60.0%
60.0%
60.0%
60.0%
60.0%
60.0%
60.0%
SG&A (% sales)
25.0%
25.0%
25.0%
25.0%
25.0%
25.0%
25.3%
25.5%
25.0%
25.0%
25.0%
25.0%
25.0%
25.0%
25.0%
Other Expense / (Income) (% of sales)
- %
- %
- %
- %
- %
- %
- %
- %
- %
- %
- %
- %
- %
- %
- %
Depreciation & Amortization (% of sales)
2.0%
2.0%
2.0%
2.0%
2.0%
2.0%
2.0%
2.0%
2.0%
2.0%
2.0%
2.0%
2.0%
2.0%
2.0%
Interest Income
3.0%
3.0%
3.0%
3.0%
3.0%
3.0%
3.0%
3.0%
3.0%
3.0%
3.0%
Tax Rate
38.0%
38.0%
38.0%
38.0%
38.0%
38.0%
38.0%
38.0%
38.0%
38.0%
Income Statement
225
P1: ABC/ABC P2:c/d QC:e/f T1:g
c05 JWBT063-Rosenbaum March 18, 2009 15:37 Printer Name: Hamilton
226 LEVERAGED BUYOUTS
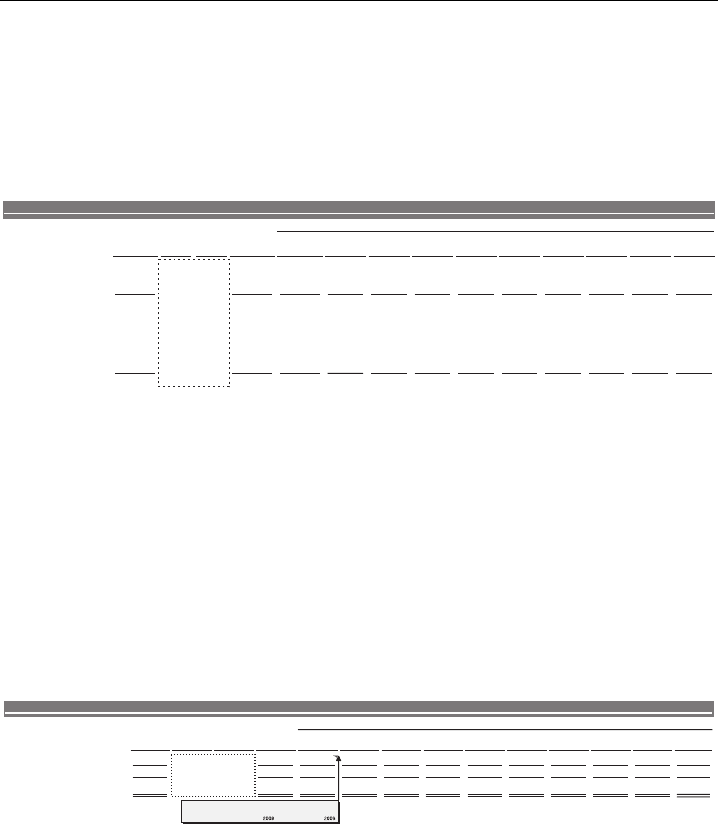
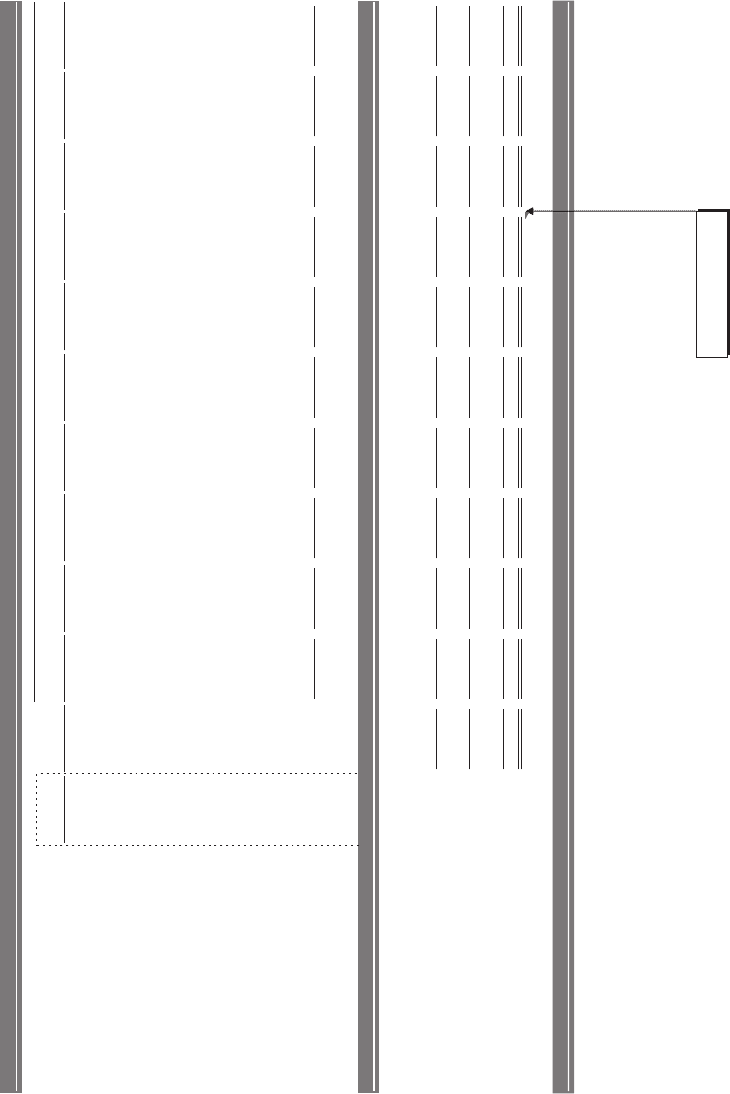
As shown in Exhibit 5.32, during the projection period, ValueCo’s $450 million
TLB is completely repaid by 2015E. ValueCo’s $300 million notes, on the other
hand, remain outstanding. In addition, we held the 2008E other long-term liabilities
amount constant at $25 million for the length of the projection period.
EXHIBIT 5.32
Pro Forma Total Liabilities Section of Balance Sheet
($ in millions, fiscal year ending December 31)
Pro FormaAdjustmentsOpening Year 1 Year 2 Year 3 Year 4 Year 5 Year 6 Year 7 Year 8 Year 9 Year 10
2008
+
-
2008 2009 2010 2011 2012 2013 2014 2015 2016
2017
2018
Accounts Payable 75.0 75.0 81.0 85.9 89.3 92.0 94.7 97.6 100.5 103.5 106.6 109.8
Accrued Liabilities 100.0 100.0 108.0 114.5 119.1 122.6 126.3 130.1 134.0 138.0 142.2 146.4
Other Current Liabilities 25.0
25.0 27.0 28.6 29.8
30.7
31.6 32.5
33.5
34.5 35.5
36.6
$200.0 Total Current Liabilities
$200.0 $216.0
$229.0 $238.1 $245.3 $252.6 $260.2 $268.0 $276.0 $284.3 $292.9
Revolving Credit Facility - - - - - - - - ----
Term Loan B - 450.0 450.0 406.3 354.2 294.6 228.9 157.9 80.7 - - - -
Existing Term Loan 300.0 (300.0) - --- -------
Senior Subordinated Notes - 300.0 300.0 300.0
300.0 300.0 300.0 300.0 300.0 300.0 300.0 300.0 300.0
Other Long-Term Liabilities 25.0
25.0
25.0 25.0
25.0
25.0 25.0
25.0 25.0
25.0
25.0 25.0
$525.0 Total Liabilities $975.0 $908.2 $947.3 $857.7 $799.2 $735.5 $665.9 $593.0 $601.0 $609.3 $617.9
Balance Sheet
Projection Period
Shareholders’ Equity Pro forma net income, which has now been calculated for
each year in the projection period, is added to the prior year’s shareholders’ equity
as retained earnings.
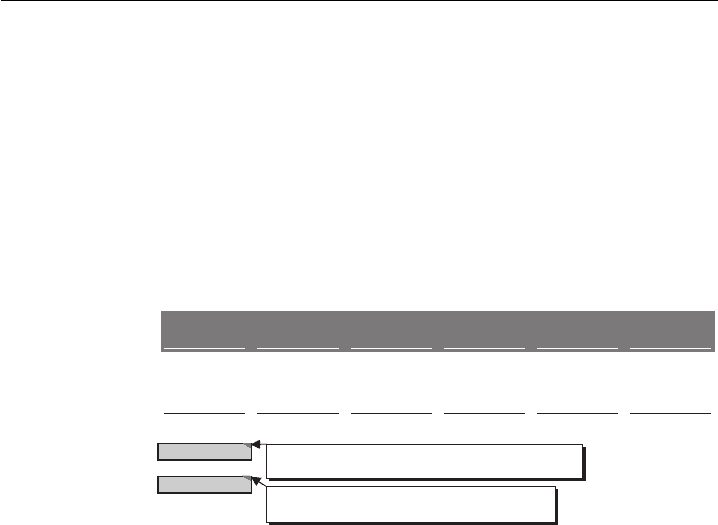
As shown in Exhibit 5.33, at the end of 2008E pro forma for the LBO, Val-
ueCo has $370 million of shareholders’ initial equity (representing the sponsor’s
equity contribution less other fees and expenses). To calculate 2009E sharehold-
ers’ equity, we added the 2009E net income of $49.3 million, which summed to
$419.3 million.
EXHIBIT 5.33
Pro Forma Total Shareholders’ Equity Section of Balance Sheet
($ in millions, fiscal year ending December 31)
Projection Period
Opening Adjustments Pro Forma Year 1 Year 2 Year 3 Year 4 Year 5 Year 6 Year 7 Year 8 Year 9 Year 10
2008
+
- 2008
2009
2010 2011
2012 2013
2014
2015
2016 2017 2018
Shareholders' Equit
y
700.0 370.0 (700.0) 370.
0
419.
3
475.
3
537.1
603.9 676.2 754.
7
840.
3
932.
8
1,030.4
1,133.1
Total Shareholders' Equity $700.0
.073$ 0 $419.3
$475.3 $537.1 $603.9 $676.2
$754.7
$840.3
$932.8 $1,030.4 $1,133.1
Total Liabilities and Equity $1,225.0
.543,1$ 0
$1,366.5
$1,383.5
$1,394.8 $1,403.1
$1,411.7
$1,420.6
$1,433.3
$1,533.9
$1,639.7
$1,751.0
Balance Sheet
= $370.0 million + $49.3 million
= Shareholders' Equity
+ Net Income
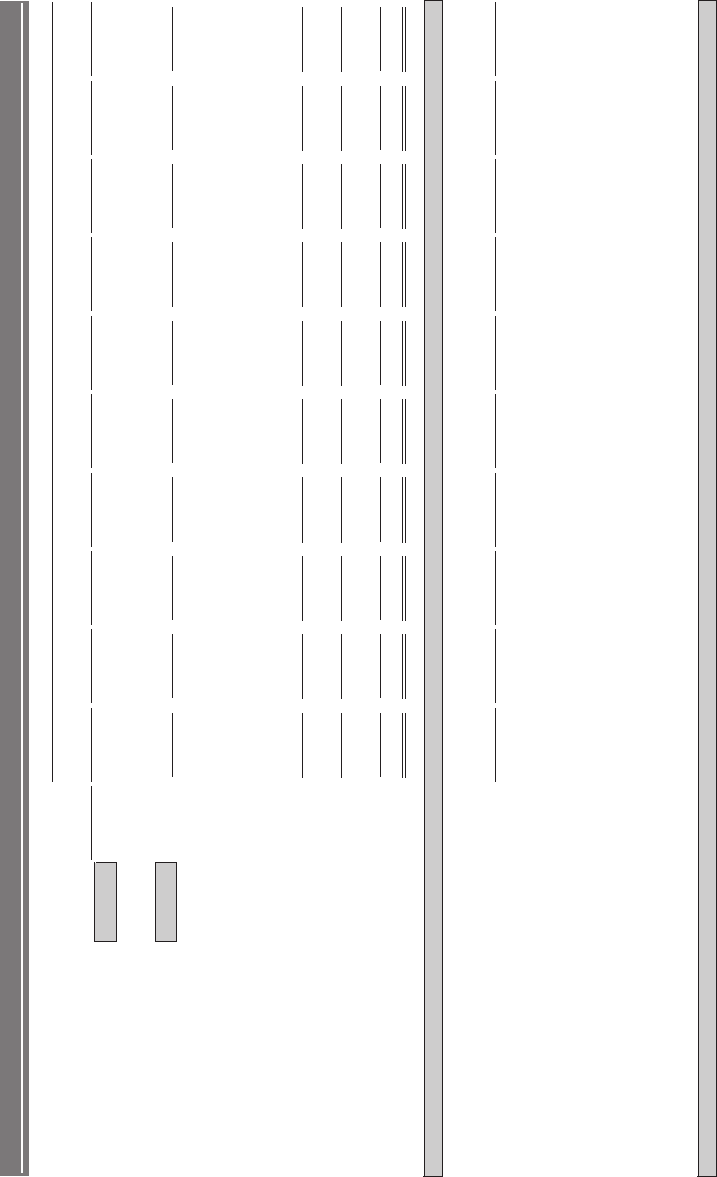
The completed pro forma balance sheet is shown in Exhibit 5.34.
Step IV(d): Complete Pro Forma Cash Flow Statement
To complete the cash flow statement, the mandatory and optional repayments for
each debt instrument, as calculated in the debt schedule, are linked to the appropriate
line items in the financing activities section and summed to produce the annual
repayment amounts. The annual pro forma beginning and ending cash balances are
then calculated accordingly.
In 2009E, ValueCo is projected to generate $43.7 million of free cash flow.
This amount is first used to satisfy the $4.5 million mandatory TLB amortization
with the remaining cash used to make an optional repayment of $39.2 million. As
P1: ABC/ABC P2:c/d QC:e/f T1:g
c05 JWBT063-Rosenbaum March 18, 2009 15:37 Printer Name: Hamilton
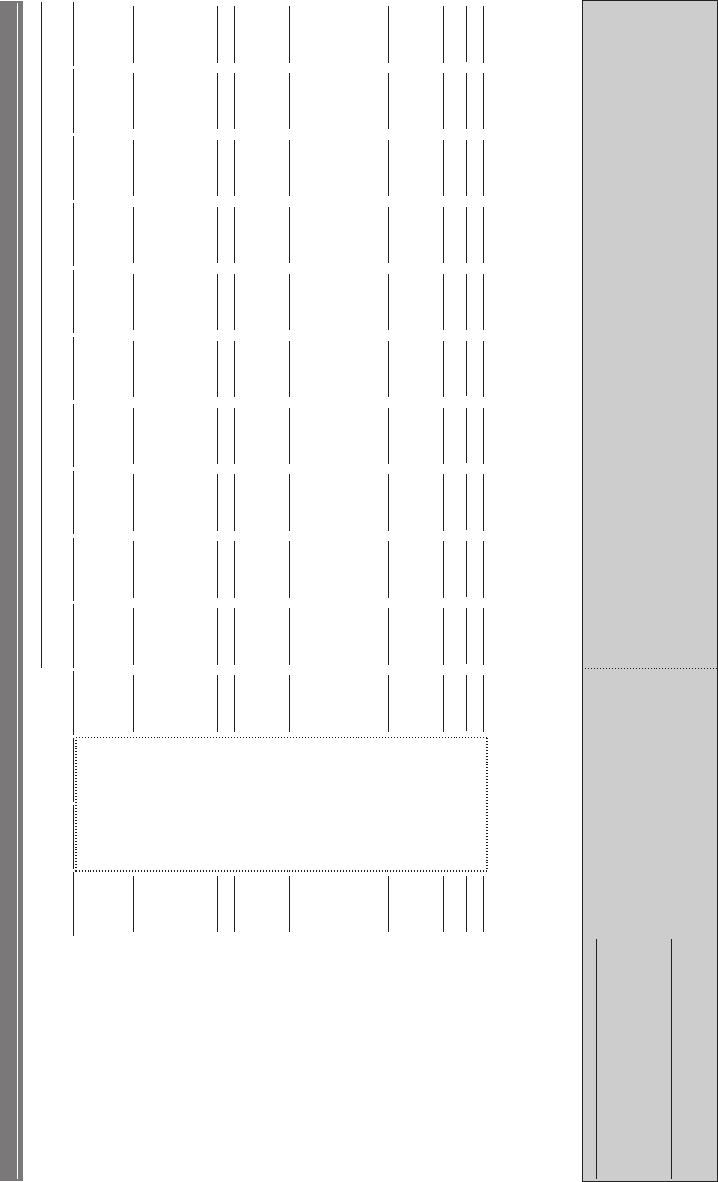
EXHIBIT 5.34
Pro Forma ValueCo Balance Sheet
($ in millions, fiscal year ending December 31)
Projection Period
Opening Adjustments
Pro Forma Year 1 Year 2
Year 3 Year 4 Year 5
Year 6 Year 7 Year 8 Year 9
Year 10
2008
+
-
2008
2009
2010
2011
2012
2013
2014
2015
2016
2017
2018
Cash and Cash Equivalents
$25.0
(25.0)
-
-
-
-
-
-
- $3.2
$92.7
$187.2
$286.7
Accounts Receivable
165.0
165.0
178.2
188.9
196.4
202.3
208.4
214.7
221.1
227.7
234.6
241.6
Inventories
125.0
125.0
135.0
143.1
148.8
153.3
157.9
162.6
167.5
172.5
177.7
183.0
Prepaids and Other Current Assets
10.0
10.0
10.8
11.4
11.9
12.3
12.6
13.0
13.4
13.8
14.2
14.6
0.523$
stessA tnerruC latoT
0.003$
$324.0
$343.4
$357.2
$367.9
$378.9
$390.3
$405.2
$506.8
$613.6
$726.0
Property, Plant and Equipment, net
650.0
650.0
650.0
650.0
650.0
650.0
650.0
650.0
650.0
650.0
650.0
650.0
Goodwill and Intangible Assets
175.0
0.003
0.521
300.0
300.0
300.0
300.0
300.0
300.0
300.0
300.0
300.0
300.0
Other Assets
75.0
75.0
75.0
75.0
75.0
75.0
75.0
75.0
75.0
75.0
75.0
75.0
Deferred Financing Fees
-
0.02
20.0
17.5
15.1
12.6
10.2
7.7
5.3
3.1
2.1
1.0
0.0
0.522,1$
stessA latoT
0.543,1$
$1,366.5
$1,383.5
$1,394.8
$1,403.1
$1,411.7
$1,420.6
$1,433.3
$1,533.9
$1,639.7
$1,751.0
Accounts Payable
75.0
75.0
81.0
85.9
89.3
92.0
94.7
97.6
100.5
103.5
106.6
109.8
Accrued Liabilities
100.0
100.0
108.0
114.5
119.1
122.6
126.3
130.1
134.0
138.0
142.2
146.4
Other Current Liabilities
25.0
25.0
27.0
28.6
29.8
30.7
31.6
32.5
33.5
34.5
35.5
36.6
0.002$
seitilibaiL tnerruC latoT
0.002$
$216.0
$229.0
$238.1
$245.3
$252.6
$260.2
$268.0
$276.0
$284.3
$292.9
Revolving Credit Facility
-
-
-
-
-
-
-
-
-
-
-
-
Term Loan B
-
0.054
0.054
406.3
354.2
294.6
228.9
157.9
80.7
-
-
-
-
Existing Term Loan
300.0
(300.0)
-
-
-
-
-
-
-
-
-
-
-
Senior Subordinated Notes
-
0.003
0.003
300.0
300.0
300.0
300.0
300.0
300.0
300.0
300.0
300.0
300.0
Other Long-Term Liabilities
25.0
25.0
25.0
25.0
25.0
25.0
25.0
25.0
25.0
25.0
25.0
25.0
0.525$
seitilibaiL latoT
0.579$
$947.3
$908.2
$857.7
$799.2
$735.5
$665.9
$593.0
$601.0
$609.3
$617.9
Noncontrolling Interest
-
-
-
-
-
-
-
-
-
-
-
-
Shareholders' Equity
700.0
370.0 (700.0) 370.0
419.3
475.3
537.1
603.9
676.2
754.7
840.3
932.8
1,030.4
1,133.1
0.007$
ytiuqE 'sredloherahS latoT
0.073$
$419.3
$475.3
$537.1
$603.9
$676.2
$754.7
$840.3
$932.8
$1,030.4
$1,133.1
Total Liabilities and Equity
$1,225.0
0.543,1$
$1,366.5
$1,383.5
$1,394.8
$1,403.1
$1,411.7
$1,420.6
$1,433.3
$1,533.9
$1,639.7
$1,751.0
000.0000.0000.0000.0
000.0000.0000.000
0.0000.0000.0000.0
000.0
kcehC ecnalaB
0.001
latipaC gnikroW teN
0.001
108.0
114.5
119.1
122.6
126.3
130.1
134.0
138.0
142.2
146.4
(Increase) / Decrease in Net Working Capital
(8.0)
(6.5)
(4.6)
(3.6)
(3.7)
(3.8)
(3.9)
(4.0)
(4.1)
(4.3)
Balance Sheet Assumptions
2.06
)OSD( gnidnatstuO selaS syaD
2.06
60.2
60.2
60.2
60.2
60.2
60.2
60.2
60.2
60.2
60.2
0.67
)HID( dleH yrotnevnI syaD
0.67
76.0
76.0
76.0
76.0
76.0
76.0
76.0
76.0
76.0
76.0
Prepaid and Other Current Assets (% of sales)
%0.1 %0.1 %0.1
%0.1 %0.1 %0.1 %0.1
%0.1
1.0% 1.0% 1.0% 1.0%
Days Payable Outstanding (DPO)
45.6
6.54
45.6
45.6
45.6
45.6
45.6
45.6
45.6
45.6
45.6
45.6
Accrued Liabilities (% of sales)
%0.01 %0.01 %0.01 %0
.01 %0.01 %0.01 %0.01
%0.01
%0.01
10.0% 10.0% 10.0%
Other Current Liabilities (% of sales)
%5.2 %5.2 %5.2
%5.2 %5.2 %5.2 %5.2
%5.2
2.5% 2.5% 2.5% 2.5%
Balance Sheet
Current Assets
Current Liabilities
227
P1: ABC/ABC P2:c/d QC:e/f T1:g
c05 JWBT063-Rosenbaum March 18, 2009 15:37 Printer Name: Hamilton
228 LEVERAGED BUYOUTS
shown in Exhibit 5.35, these combined actions are linked to the TLB line item in the
financing activities section of the cash flow statement as a $43.7 million use of cash in
2009E.
EXHIBIT 5.35
Pro Forma Financing Activities Section of Cash Flow Statement
($ in millions, fiscal year ending December 31)
Projection Period
Year 1 Year 2 Year 3 Year 4 Year 5 Year 6 Year 7 Year 8 Year 9 Year 10
2009
2010
2011 2012
2013
2014 2015 2016 2017 2018
Financing Activities
Revolving Credit Facility - - - - - - - ---
Term Loan B
(43.7)
(52.0)
(59.6) (65.7)
(71.1)
(77.2)
(80.7) - --
Existing Term Loan --- ----- --
Dividends - - - - - - - - --
Equity Issuance / (Repurchase) - ---- --- --
Cash Flow from Financing Activities ($43.7) ($59.6) ($52.0) ($65.7) ($77.2) ($71.1) ($80.7) - - -
$3.2 $89.5Excess Cash for the Period - - --- - $99.6$94.4
3.2Beginning Cash Balance - --- - -- 187.292.7
Ending Cash Balance - - - - -- $3.2 $92.7 $187.2 $286.7
Cash Flow Statement
= Mandatory Repayments +
2009
Optional Repayments
2009
= ($4.5) million + ($39.2) million
As we assumed a 100% cash flow sweep, cash does not build on the balance
sheet until the bank debt is fully repaid. Hence, ValueCo’s ending cash balance line
item remains constant at zero until 2015E when the TLB is completely paid down.
25
As shown in Exhibit 5.10, the ending cash balance for each year in the projection
period links to the balance sheet.
The completed pro forma cash flow statement is shown in Exhibit 5.36.
25
While a cash balance of zero may be unrealistic from an operating perspective, it is a
relatively common modeling convention.
P1: ABC/ABC P2:c/d QC:e/f T1:g
c05 JWBT063-Rosenbaum March 18, 2009 15:37 Printer Name: Hamilton
EXHIBIT 5.36
Pro Forma ValueCo Cash Flow Statement
($ in millions, fiscal year ending December 31)
Projection Period
Year 1 Year 2 Year 3
Year 4 Year 5 Year 6 Year 7
Year 8
Year 9 Year 10
2009
2010
2011
2012
2013
2014
2015
2016
2017
2018
Operating Activities
3.94$
Net Income
$56.1
$61.8
$66.8
$72.3
$78.5
$85.6
$92.5
$97.5
$102.8
6.12
Plus: Depreciation & Amortization
22.9
23.8
24.5
25.3
26.0
26.8
27.6
28.4
29.3
5.2
Plus: Amortization of Financing Fees
2.5
2.5
2.5
2.5
2.5
2.2
1.0
1.0
1.0
Changes in Working Capital Items
(Inc.) / Dec. in Accounts Receivable
(13.2)
(10.7)
(7.6)
(5.9)
(6.1)
(6.3)
(6.4)
(6.6)
(6.8)
(7.0)
(Inc.) / Dec. in Inventories
(10.0)
(8.1) (5.7) (4.5)
(4.6) (4.7) (4.9)
(5.0) (5.2) (5.3)
0.6
Inc. / (Dec.) in Accounts Payable
4.9
3.4
2.7
2.8
2.8
2.9
3.0
3.1
3.2
0.8
Inc. / (Dec.) in Accrued Liabilities
6.5
4.6
3.6
3.7
3.8
3.9
4.0
4.1
4.3
0.2
Inc. / (Dec.) in Other Current Liabilities
1.6
1.1
0.9
0.9
0.9
1.0
1.0
1.0
1.1
(Inc.) / Dec. in Net Working Capital
(8.0)
(6.5)
(4.6)
(3.6)
(3.7)
(3.8)
(3.9)
(4.0)
(4.1)
(4.3)
3.56$
Cash Flow from Operating Activities
$74.9
$83.4
$90.2
$96.3
$103.2
$110.7
$117.1
$122.9
$128.8
Investing Activities
Capital Expenditures
(21.6)
(22.9)
(23.8)
(24.5)
(25.3)
(26.0)
(26.8)
(27.6)
(28.4)
(29.3)
Other Investing Activities
-
-
-
-
-
-
-
-
-
-
Cash Flow from Investing Activities
($21.6)
($22.9)
($23.8)
($24.5)
($25.3)
($26.0)
($26.8)
($27.6)
($28.4)
($29.3)
Financing Activities
-
Revolving Credit Facility
-
-
-
-
-
-
-
-
-
Term Loan B
(43.7)
(59.6)
(52.0)
(65.7) (71.1)
(77.2) (80.7)
-
-
-
-
Existing Term Loan
-
-
-
-
-
-
-
-
-
-
Senior Subordinated Notes
-
-
-
-
-
-
-
-
-
Dividends
-
-
-
-
-
-
-
-
-
-
Equity Issuance / (Repurchase)
-
-
-
-
-
-
-
-
-
-
Cash Flow from Financing Activities
($43.7)
($52.0)
($65.7)
($59.6)
($71.1)
($77.2)
($80.7)
-
-
-
-
Excess Cash for the Period
-
-
-
-
-
$3.2
$89.5
$94.4
$99.6
-
Beginning Cash Balance
-
-
-
-
-
-
3.2
92.7
187.2
-
Ending Cash Balance
-
-
-
-
-
$3.2
$92.7
$187.2
$286.7
Cash Flow Statement Assumptions
Capital Expenditures (% of sales)
2.0%
2.0%
2.0%
2.0%
2.0%
2.0%
2.0%
2.0%
2.0%
2.0%
Cash Flow Statement
(Inc.) / Dec. in Prepaid and Other Current Assets
(0.8) (0.6) (0.5)
(0.4) (0.4) (0.4) (0.4)
(0.4) (0.4) (0.4)
229

P1: ABC/ABC P2:c/d QC:e/f T1:g
c05 JWBT063-Rosenbaum March 18, 2009 15:37 Printer Name: Hamilton
230 LEVERAGED BUYOUTS
STEP V. PERFORM LBO ANALYSIS
EXHIBIT 5.37 Steps to Perform LBO Analysis
Step V(a): Analyze Financing Structure
Step V(b): Perform Returns Analysis
Step V(c): Determine Valuation
Step V(d): Create Transaction Summary Page
Once the LBO model is fully linked and tested, it is ready for use to evaluate
various financing structures, gauge the target’s ability to service and repay debt, and
measure the sponsor’s investment returns and other financial effects under multi-
ple operating scenarios. This analysis, in turn, enables the banker to determine an
appropriate valuation range for the target.
Step V(a): Analyze Financing Structure
A central part of LBO analysis is the crafting of an optimal financing structure for
a given transaction. From an underwriting perspective, this involves determining
whether the target’s financial projections can support a given leveraged financing
structure under various business and economic conditions. The use of realistic and
defensible financial projections is critical to assessing whether a given financial struc-
ture is viable.
A key credit risk management concern for the underwriters centers on the target’s
ability to service its annual interest expense and repay all (or a substantial portion)
of its bank debt within the proposed tenor. The primary credit metrics used to
analyze the target’s ability to support a given capital structure include variations
of the leverage and coverage ratios outlined in Chapter 1 (e.g., debt-to-EBITDA,
debt-to-total capitalization, and EBITDA-to-interest expense). Exhibit 5.38 displays
a typical output summarizing the target’s key financial data as well as pro forma
capitalization and credit statistics for each year in the projection period. This output
is typically shown on a transaction summary page (see Exhibit 5.46).
For the ValueCo LBO, we performed our financing structure analysis on the
basis of our Base Case financial projections (see Step II) and assumed transaction
structure (see Step III). Pro forma for the LBO, ValueCo has a total capitalization of
$1,120 million, comprised of the $450 million TLB, $300 million notes, and $370
million of shareholders’ equity (the equity contribution less other fees and expenses).
This capital structure represents total leverage of 5.1x LTM 9/30/08 EBITDA of
$146.7 million, including senior secured leverage of 3.1x. At these levels, ValueCo
has a debt-to-total capitalization of 67%, EBITDA-to-interest expense of 2.4x and
(EBITDA – capex)-to-interest expense of 2.1x at close.
As would be expected for a company that is projected to grow EBITDA, gen-
erate sizeable free cash flow, and repay debt, ValueCo’s credit statistics improve
significantly over the projection period. By 2015E, ValueCo’s TLB is completely
repaid as total leverage decreases to 1.5x and senior secured leverage is reduced
to zero. In addition, ValueCo’s debt-to-total capitalization decreases to 26.3% and
EBITDA-to-interest expense increases to 5.9x.
P1: ABC/ABC P2:c/d QC:e/f T1:g
c05 JWBT063-Rosenbaum March 18, 2009 15:37 Printer Name: Hamilton
EXHIBIT 5.38
Summary Financial Data, Capitalization, and Credit Statistics
($ in millions, fiscal year ending December 31)
Projection Period
Pro forma
LTM
Year 1 Year 2 Year 3
Year 4 Year 5 Year 6
Year 7 Year 8
Year 9 Year 10
9/30/2008
2008
2009
2010
2011
2012
2013
2014
2015
2016
2017
2018
$977.8
Sales
$1,000.0
$1,080.0
$1,144.8
$1,190.6
$1,226.3
$1,263.1
$1,301.0
$1,340.0
$1,380.2
$1,421.6
$1,464.3
8.1%
NA
% growth
8.0%
6.0%
4.0%
3.0%
3.0%
3.0%
3.0%
3.0%
3.0%
3.0%
$391.1
Gross Profit
$400.0
$432.0
$457.9
$476.2
$490.5
$505.2
$520.4
$536.0
$552.1
$568.7
$585.7
40.0%
% margin
40.0%
40.0%
40.0%
40.0%
40.0%
40.0%
40.0%
40.0%
40.0%
40.0%
40.0%
EBITDA
$146.7 $150.0
$162.0
$171.7
$178.6
$183.9
$189.5
$195.1
$201.0
$207.0
$213.2
$219.6
15.0%
% margin
15.0%
15.0%
15.0%
15.0%
15.0%
15.0%
15.0%
15.0%
15.0%
15.0%
15.0%
Capital Expenditures
19.6 20.0
21.6
22.9
23.8
24.5
25.3
26.0
26.8
27.6
28.4
29.3
2.0%
% sales
2.0%
2.0%
2.0%
2.0%
2.0%
2.0%
2.0%
2.0%
2.0%
2.0%
2.0%
59.9
Cash Interest Expense
58.5
55.9
52.7
49.2
45.2
40.0
34.0
30.7
30.7
30.7
62.4
Total Interest Expense
60.9
58.4
55.2
51.7
47.6
42.5
36.2
31.7
31.7
31.7
Free Cash Flow
EBITDA
$162.0
$171.7
$178.6
$183.9
$189.5
$195.1
$201.0
$207.0
$213.2
$219.6
Less: Cash Interest Expense
Plus: Interest Income
Less: Income Taxes
Less: Capital Expenditures
Less: Increase in Net Working Capital
7.34$
Free Cash Flow
$52.0
$59.6
$65.7
$71.1
$77.2
$83.9
$89.5
$94.4
$99.6
7.34
Cumulative Free Cash Flow
95.8
155.4
221.1
292.1
369.3
453.2
542.7
637.2
736.7
Cash
-
-
-
-
-
-
-
$3.2
$92.7
$187.2
$286.7
-
Revolving Credit Facility
-
-
-
-
-
-
-
-
-
-
0.054
Term Loan B
406.3
354.2
294.6
228.9
157.9
80.7
-
-
-
-
-
Other Debt
-
-
-
-
-
-
-
-
-
-
0.054$
Total Senior Secured Debt
$406.3
$354.2
$294.6
$228.9
$157.9
$80.7
-
-
-
-
0.003
Senior Subordinated Notes
300.0
300.0
300.0
300.0
300.0
300.0
300.0
300.0
300.0
300.0
0.057$
Total Debt
$706.3
$654.2
$594.6
$528.9
$457.9
$380.7
$300.0
$300.0
$300.0
$300.0
Shareholders' Equity
Total Capitalization
% of Bank Debt Repaid
% Debt / Total Capitalization
EBITDA / Cash Interest Expense
4.2x
3.7x
3.4x
3.1x
2.8x
2.5x
7.2x
7.0x
6.8x
5.9x
4.9x
(EBITDA - Capex) / Cash Interest Expense
3.6x
3.2x
2.9x
2.7x
2.4x
2.2x
6.2x
6.0x
5.9x
5.1x
4.2x
EBITDA / Total Interest Expense
4.0x
3.6x
3.2x
2.9x
2.7x
2.4x
6.9x
6.7x
6.5x
5.6x
4.6x
(EBITDA - Capex) / Total Interest Expense
3.4x
3.1x
2.8x
2.5x
2.3x
2.1x
6.0x
5.8x
5.7x
4.8x 4.0x
Senior Secured Debt / EBITDA
0.8x
1.2x
1.6x
2.1x
2.5x
3.0x
NM
NM
NM
NM
0.4x
Total Debt / EBITDA
2.4x
2.9x
3.3x
3.8x
4.4x
5.0x
1.4x
1.4x
1.4x
1.5x
2.0x
Net Debt / EBITDA
2.4x
2.9x
3.3x
3.8x
4.4x
5.0x
0.1x
0.5x
1.0x
1.5x
2.0x
Capitalization
Credit Statistics
Summary Financial Data
In Year 7, 100% of ValueCo's
bank debt is repaid.
(58.5) (55.9) (52.7)
(49.2) (45.2) (40.0)
(34.0) (30.7) (30.7)
(30.7)
-
-
-
--
-0
.0
1.4
4.2
7.1
(30.2)
(34.4)
(37.9) (40.9) (44.3)
(48.1) (52.5) (56.7)
(59.8) (63.0)
(21.6)
(22.9)
(23.8) (24.5) (25.3)
(26.0) (26.8) (27.6)
(28.4)
(29.3)
(8.0) (6.5) (4.6)
(3.6) (3.7) (3.8)
(3.9) (4.0) (4.1)
(4.3)
932.8
$1,232.8
100.0%
24.3%
370.0 419.3 475.3
537.1 603.9 676.2
754.7 840.3
1,030.4 1,133.1
$1,120.0 $1,125.5 $1,129.6
$1,131.7 $1,132.8 $1,134.0
$1,135.4 $1,140.3
$1,330.4 $1,433.1
-
9.7% 21.3% 34.5%
49.1% 64.9% 82.1%
100.0%
100.0% 100.0%
67.0% 62.7% 57.9%
52.5% 46.7% 40.4%
33.5% 26.3%
20.9%
22.6%
231

P1: ABC/ABC P2:c/d QC:e/f T1:g
c05 JWBT063-Rosenbaum March 18, 2009 15:37 Printer Name: Hamilton
232 LEVERAGED BUYOUTS
This steady deleveraging and improvement of credit statistics throughout the
projection period suggests that ValueCo has the ability to support the contemplated
financing structure under the Base Case financial projections.
Step V(b): Perform Returns Analysis
After analyzing the contemplated financing structure from a debt repayment and
credit statistics perspective, the banker determines whether it provides sufficient
returns to the sponsor given the proposed purchase price and equity contribution.
As discussed in Chapter 4, sponsors have historically sought 20%+IRRs in assessing
acquisition opportunities. If the implied returns are too low, both the purchase price
and financing structure need to be revisited.
IRRs are driven primarily by the target’s projected financial performance, the
assumed purchase price and financing structure (particularly the size of the equity
contribution), and the assumed exit multiple and year (assuming a sale). Although a
sponsor may realize a monetization or exit through various strategies and timeframes
(see Chapter 4, “Primary Exit/Monetization Strategies”), a traditional LBO analysis
contemplates a full exit via a sale of the entire company in five years.
Return Assumptions In a traditional LBO analysis, it is common practice to con-
servatively assume an exit multiple equal to (or below) the entry multiple.
EXHIBIT 5.39
Calculation of Enterprise Value and Equity Value at Exit
($ in millions)
Year 5
2013
$189.52013E EBITDA
Exit EBITDA Multiple
7.5x
Enterprise Value at Exit $1,421.0
Less: Net Debt
-Revolving Credit Facility
157.9Term Loan B
300.0Senior Subordinated Notes
Total Debt $457.9
-Less: Cash and Cash Equivalents
$457.9Net Debt
Equity Value at Exit $963.1
(assumes 7.5x exit multiple and 2013E exit year)
Calculation of Exit Enterprise Value and Equity Value
As shown in Exhibit 5.39, for ValueCo’s LBO analysis, we assumed that the
sponsor exits in 2013E (Year 5) at a multiple of 7.5x EBITDA, which is equal to the
entry multiple.
In 2013E, ValueCo is projected to generate EBITDA of $189.5 million, trans-
lating into an implied enterprise value of $1,421 million at an exit multiple of 7.5x
EBITDA. Cumulative debt repayment over the period is $292.1 million (2008E TLB
beginning balance of $450 million less 2013E ending balance of $157.9 million),
leaving ValueCo with projected 2013E debt of $457.9 million. This debt amount,
P1: ABC/ABC P2:c/d QC:e/f T1:g
c05 JWBT063-Rosenbaum March 18, 2009 15:37 Printer Name: Hamilton
LBO Analysis
233
which is equal to net debt given the zero cash balance, is subtracted from the enter-
prise value of $1,421 million to calculate an implied equity value of $963.1 million
in the exit year.
IRR and Cash Return Calculations Assuming no additional cash inflows (dividends
to the sponsor) or outflows (additional investment by the sponsor) during the invest-
ment period, IRR and cash return are calculated on the basis of the sponsor’s initial
equity contribution (outflow) and the assumed equity proceeds at exit (inflow). This
concept is illustrated in the timeline shown in Exhibit 5.40.
EXHIBIT 5.40
Investment Timeline
($ in millions)
Pro forma Year 1 Year 2 Year 3 Year 4 Year 5
2008 2009 2010 2011 2012 2013
Initial Equity Investment ($385.0)
Dividends / (Investment) - - - - - -
Equity Value at Exit - - - - - 963.1
Total ($385.0) - - - - $963.1
%02RRI
x5.2nruteRhsaC
=IRR(Initial Equity Investment : Equity Value at Exit)
=IRR(($385.0) million : $963.1 million)
= Equity Value at Exit / Initial Equity Investment
= $963.1 million / $385.0 million
The initial equity contribution represents a cash outflow for the sponsor. Hence,
it is shown as a negative value on the timeline, as would any additional equity in-
vestment by the sponsor, whether for acquisitions or other purposes. On the other
hand, cash distributions to the sponsor, such as proceeds received at exit or divi-
dends received during the investment period, are shown as positive values on the
timeline.
For the ValueCo LBO, we assumed no cash inflows or outflows during the
investment period other than the initial equity contribution and anticipated equity
proceeds at exit. Therefore, we calculated an IRR of approximately 20% and a cash
return of 2.5x based on $385 million of initial contributed equity and $963.1 million
of equity proceeds in 2013E.
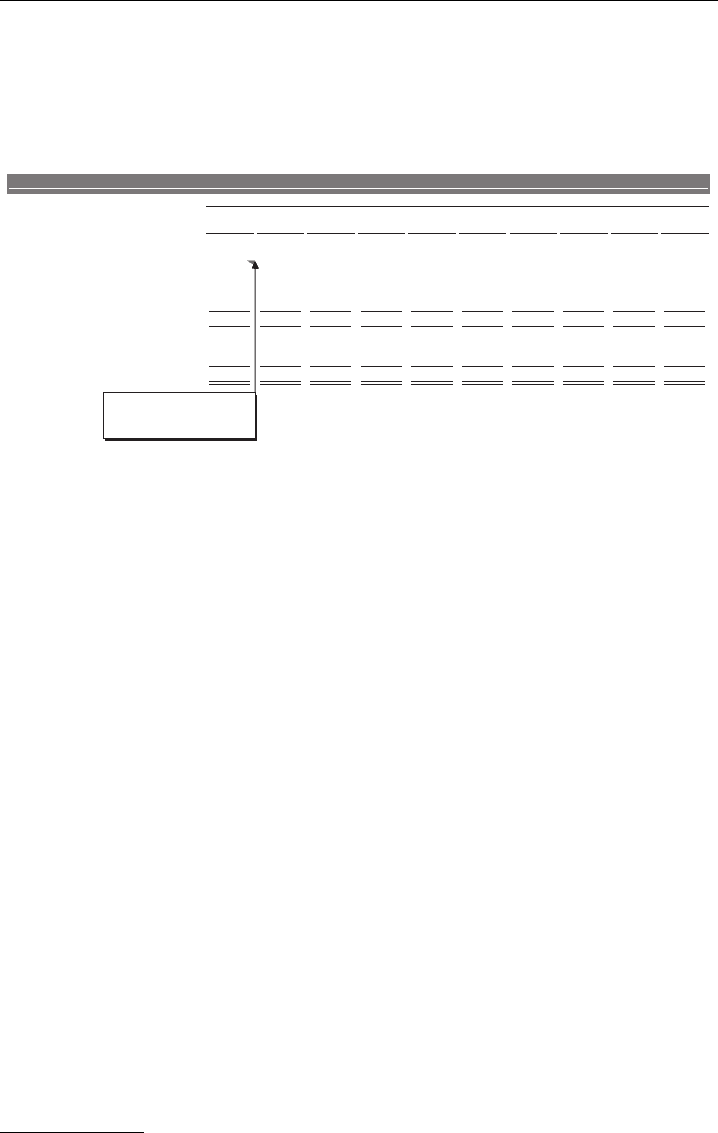
Returns at Various Exit Years In Exhibit 5.41, we calculated IRR and cash return
assuming an exit at the end of each year in the projection period using the fixed
7.5x EBITDA exit multiple. As we progress through the projection period, equity
value increases due to the increasing EBITDA and decreasing net debt. Therefore,
the cash return increases as it is a function of the fixed initial equity investment and
increasing equity value at exit. In ValueCo’s case, however, as the timeline progresses,
IRR decreases in accordance with the declining growth rates and the time value of
money.
IRR Sensitivity Analysis Sensitivity analysis is critical for analyzing IRRs and fram-
ing LBO valuation. IRR can be sensitized for several key value drivers, such as entry
and exit multiple, exit year, leverage level, and equity contribution percentage, as
well as key operating assumptions such as growth rates and margins (see Chapter 3,
Exhibit 3.59).
P1: ABC/ABC P2:c/d QC:e/f T1:g
c05 JWBT063-Rosenbaum March 18, 2009 15:37 Printer Name: Hamilton
EXHIBIT 5.41
Returns at Various Exit Years
($ in millions, fiscal year ending December 31)
Projection Period
Pro forma Year 1 Year 2 Year 3
Year 4 Year 5 Year 6 Year 7 Year 8
Year 9 Year 10
2008
2009
2010
2011
2012
2013
2014
2015
2016
2017
2018
Entry EBITDA Multiple
7.5x
$385.0
Initial Equity Investment
EBITDA
$162.0
$171.7
$178.6
$183.9
$189.5
$195.1
$201.0
$207.0
$213.2
$219.6
Exit EBITDA Multiple
7.5x
Enterprise Value at Exit
$1,215.0
$1,287.9
$1,339.4
$1,379.6
$1,421.0 $1,463.6 $1,507.5 $1,552.8
$1,599.3 $1,647.3
Less: Net Debt
-
Revolving Credit Facility
-
-
-
-
-
-
-
-
-
3.604
Term Loan B
354.2
294.6
228.9
157.9
80.7
-
-
-
-
0.003
Senior Subordinated Notes
300.0
300.0
300.0
300.0
300.0
300.0
300.0
300.0
300.0
-
Other Debt
-
-
-
-
-
-
-
-
-
3.607$
Total Debt
$654.2
$594.6
$528.9
$457.9
$380.7
$300.0
$300.0
$300.0
$300.0
-
Less: Cash and Cash Equivalents
-
-
-
-
-
3.2
92.7
187.2
286.7
3.607$
Net Debt
$654.2
$594.6
$528.9
$457.9
$380.7
$296.8
$207.3
$112.8
$13.3
Equity Value at Exit
$508.7
$633.7
$744.8
$850.7
$963.1
$1,083.0
$1,210.7
$1,345.5
$1,486.5
$1,634.0
4.2x
3.9x
3.5x
3.1x
2.8x
2.5x
2.2x
1.9x
1.6x
1.3x
nruteRhsaC
Year 1
Year 2 Year 3 Year 4
Year 5 Year 6 Year 7
Year 8
Year 9
Year 10
2009
2010
2011
2012
2013
2014
2015
2016
2017
2018
Initial Equity Investment
($385.0)
($385.0)
($385.0)
($385.0)
($385.0)
($385.0)
($385.0)
($385.0)
($385.0)
($385.0)
$508.7
Equity Proceeds
-
-
-
-
-
-
-
-
-
$633.7
-
-
-
-
-
-
-
-
$744.8
-
-
-
-
-
-
-
$850.7
-
-
-
-
-
-
$963.1
-
-
-
-
-
$1,083.0
-
-
-
-
$1,210.7
-
-
-
$1,345.5
-
-
$1,486.5
-
$1,634.0
RRI
28.3%
32.1%
24.6%
21.9%
20.1%
18.8%
17.8%
16.9%
16.2%
15.6%
Returns Analysis
234