IEA Statistics. Oil Information 2011
Подождите немного. Документ загружается.


III.548 - OIL INFORMATION (2011 Edition)
TURKEY
Table 7D: Imports by country of origin
000 metric tons
2008 2009 2010e 2008 2009 2010e 2008 2009 2010e
Fuel oil (residual) Petroleum coke Other products
Australia - - - - - - - - -
Bel
g
ium - - - - - - - 47 -
Canada - - - - - - - - -
Czech Re
p
ubli
c
- - - - - - - - -
Denmark 19 4 - - - - - - -
Finland - - - - - - - 12 -
France 57 57 - - - - - 15 -
German
y
- - - - - - - 12 -
Greece 10 - - - - - - 82 -
Hun
g
ar
y
- - - - - - - - -
Ireland - - 24 - - - - - -
Ital
y
46 115 320 - - - - 97 -
Ja
p
an - - - - - - - - -
Korea - - - - - - - 8 -
Mexic
o
- - - - - - - - -
Netherlands 33 27 17 - - - - 36 16
New Zealand - - - - - - - - -
Norwa
y
- 33 25 - - - - - -
Poland - - - - - - - 14 -
S
p
ain 121 - - - - - - 20 -
Sweden - 54 39 - - - - 14 -
Turke
y
- - - - - - - - -
United Kin
g
dom - 70 39 - - - - 14 -
United States - 48 - - - - - 45 -
Othe
r
- - - - - - - 10 -
OECD 286 408 464 - - - - 426 16
Ar
g
entina - - - - - - - - -
Brazil - - - - - - - - -
Colombia - - - - - - - - -
Ecuado
r
- - - - - - - - -
Netherlands Antilles - - - - - - - - -
Peru - - - - - - - - -
Trinidad and Toba
go
- - - - - - - - -
Venezuela - - - - - - - - -
Othe
r
- - - - - - - - -
Latin America - - - - - - - - -
Kazakhstan - - - - - - - - -
Russian Federation 163 24 23 - - - - 307 -
Other 334 199 154 - - - 3 118 -
Non-OECD Europe/Eurasia
497 223 177 - - - 3 425 -
Iran - - - - - - - 3 -
Ira
q
- - - - - - - - -
Kuwai
t
- - - - - - - - -
Oman - - - - - - - - -
Qata
r
- - - - - - 184 82 -
Saudi Arabia - - - - - - 45 59 -
United Arab Emirates - - - - - - - 4 -
Othe
r
5 - 3 - - - - 15 -
Middle East 5 - 3 - - - 229 163 -
India - - - - - - - 3 -
Indonesi
a
- - - - - - - - -
Sin
g
a
p
ore - - - - - - - - -
Othe
r
- - - - - - - - -
Asia - - - - - - - 3 -
China - - - - - - - - -
Al
g
eria - - - - - - - - -
An
g
ola - - - - - - - - -
Cameroon - - - - - - - - -
E
gypt
- - - - - - 26 4 -
Gabon - - - - - - - - -
Lib
y
an Arab Jamahiri
y
a - - - - - - - - -
Ni
g
eria - - - - - - - - -
Tunisia - - - - - - - - -
Othe
r
- - - - - - - - -
Africa - - - - - - 26 4 -
Non-spec./other 8 - 7 - - - 1 573 1 737 2 382
Total imports 796 631 651 - - - 1 831 2 758 2 398
Memo: Total OPEC - - - - - - 229 148 -
Source: Annual Oil Statistics.
INTERNATIONAL ENERGY AGENCY

OIL INFORMATION (2011 Edition) - III.549
TURKEY
Table 8A: Exports by country of destination
000 metric tons
2008 2009 2010e 2008 2009 2010e 2008 2009 2010e
Crude oil Natural gas liquids Feedstocks and other
Australia - - - - - - - - -
Austria - - - - - - - - -
Bel
g
ium - - - - - - - - -
Canada - - - - - - - - -
Denmark - - - - - - - - -
Finland - - - - - - - - -
France - - - - - - - - -
German
y
- - - - - - - - -
Greece - - - - - - - - -
Ireland - - - - - - - - -
Ital
y
- - - - - - - - -
Ja
p
an - - - - - - - - -
Luxembour
g
- - - - - - - - -
Mexic
o
- - - - - - - - -
Netherlands - - - - - - - - -
Norwa
y
- - - - - - - - -
Portu
g
al - - - - - - - - -
S
p
ain - - - - - - - - -
Sweden - - - - - - - - -
Switzerland - - - - - - - - -
Turke
y
- - - - - - - - -
United Kin
g
dom - - - - - - - - -
United States - - - - - - - - -
Other OECD - - - - - - - - -
OECD - - - - - - - - -
Africa - - - - - - - - -
Latin America - - - - - - - - -
Asia - - - - - - - - -
China - - - - - - - - -
Non-OECD Euro
p
e/Eurasi
a
- - - - - - - - -
Russian Federation - - - - - - - - -
Middle Eas
t
- - - - - - - - -
Non-s
p
ecified/Othe
r
- - - - - - - - -
Non-OECD - - - - - - - - -
Total exports - - - - - - - - -
Total products Liquefied petroleum gas Naphtha
Australia - - - - - - - - -
Austria - 5 6 - - - - - -
Bel
g
ium - 4 3 - - - - - -
Canada - - - - - - - - -
Denmark - 4 3 - - - - - -
Finland - 2 - - - - - - -
France 85 20 8 - - - - - -
German
y
- 117 33 - 2 - - - -
Greece 252 5 60 - - - - - -
Ireland - - - - - - - - -
Ital
y
802 313 60 - - - 20 - -
Ja
p
an - - - - - - - - -
Luxembour
g
- - - - - - - - -
Mexic
o
- - - - - - - - -
Netherlands - 30 22 - - - - - -
Norwa
y
- 18 - - - - - - -
Portu
g
al - 19 - - - - - - -
S
p
ain 209 1 - - - - - - -
Sweden - 7 2 - - - - - -
Switzerland 2 22 - 2 - - - - -
Turke
y
- - - - - - - - -
United Kin
g
dom - 202 7 - - - - - -
United States 446 117 195 - - - - - -
Other OECD - 39 41 - - - - - -
OECD 1 796 925 440 2 2 - 20 - -
Africa 873 859 723 38 49 - - 22 -
Latin America 3 - - - - - - - -
Asia 1 000 229 973 - - - 25 - -
China - 39 - - - - - - -
Non-OECD Euro
p
e/Eurasi
a
862 561 436 12 2 2 24 - -
Russian Federation - 46 74 - - - - - -
Middle Eas
t
1 559 1 255 2 052 - 4 17 - 6 -
Non-s
p
ecified/othe
r
389 816 574 22 31 38 - - -
Non-OECD 4 686 3 805 4 832 72 86 57 49 28 -
Total exports 6 482 4 730 5 272 74 88 57 69 28 -
Source: Annual Oil Statistics.
INTERNATIONAL ENERGY AGENCY

III.550 - OIL INFORMATION (2011 Edition)
TURKEY
Table 8B: Exports by country of destination
000 metric tons
2008 2009 2010e 2008 2009 2010e 2008 2009 2010e
Total gasoline Total kerosene Gas/diesel oil
Australia - - - - - - - - -
Austria - - - - 4 6 - - -
Bel
g
ium - - - - 4 3 - - -
Canada - - - - - - - - -
Denmark - - - - 4 3 - - -
Finland - - - - - - - - -
France - - - - 19 8 30 - -
German
y
- - - - 115 33 - - -
Greece 2 1 - 74 - - 30 3 60
Ireland - - - - - - - - -
Ital
y
- - - 136 22 - 43 130 60
Ja
p
an -- - --- - - -
Luxembour
g
-- - --- - - -
Mexic
o
-- - --- - - -
Netherlands - - - - 30 22 - - -
Norwa
y
- - - - 18 - - - -
Portu
g
al - - - - 19 - - - -
S
p
ain - - - 115 1 - 28 - -
Sweden - - - - 6 2 - - -
Switzerland - - - - 22 - - - -
Turke
y
-- - --- - - -
United Kin
g
dom - - - - 202 7 - - -
United States 314 30 195 - 35 - - - -
Other OECD - - - - 6 8 - 23 33
OECD 316 31 195 325 507 92 131 156 153
Africa 660 621 494 36 3 7 - - -
Latin America - - - - - - - - -
Asia 15 70 11 - 2 - - - -
China - - - - 39 - - - -
Non-OECD Euro
p
e/Eurasi
a
136 226 172 97 33 84 313 48 82
Russian Federation - - 35 - 26 36 - 2 3
Middle Eas
t
1 398 925 1 041 70 29 52 - 60 6
Non-s
p
ecified/Othe
r
47 87 64 10 24 196 80 129 100
Non-OECD 2 256 1 929 1 817 213 156 375 393 239 191
Total exports 2 572 1 960 2 012 538 663 467 524 395 344
Fuel oil (residual) Petroleum coke Other products
Australia - - - - - - - - -
Austria - - - - - - - 1 -
Bel
g
ium -- - --- - - -
Canada - - - - - - - - -
Denmark - - - - - - - - -
Finland - - - - - - - 2 -
France 38 - - - - - 17 1 -
German
y
-- - --- - - -
Greece 113 - - - - - 33 1 -
Ireland - - - - - - - - -
Ital
y
570 157 - - - - 33 4 -
Ja
p
an -- - --- - - -
Luxembour
g
-- - --- - - -
Mexic
o
-- - --- - - -
Netherlands - - - - - - - - -
Norwa
y
-- - --- - - -
Portu
g
al -- - --- - - -
S
p
ain 66 - - - - - - - -
Sweden - - - - - - - 1 -
Switzerland - - - - - - - - -
Turke
y
-- - --- - - -
United Kin
g
dom -- - --- - - -
United States 55 52 - - - - 77 - -
Other OECD - 2 - - - - - 8 -
OECD 842 211 - - - - 160 18 -
Africa 137 155 222 - - - 2 9 -
Latin America - - - - - - 3 - -
Asia 956 156 962 - - - 4 1 -
China - - - - - - - - -
Non-OECD Euro
p
e/Eurasi
a
280 199 96 - - - - 53 -
Russian Federation - 2 - - - - - 16 -
Middle Eas
t
91 192 936 - - - - 39 -
Non-s
p
ecified/othe
r
225 256 174 - - - 5 289 2
Non-OECD 1 689 960 2 390 - - - 14 407 2
Total exports 2 531 1 171 2 390 - - - 174 425 2
Source: Annual Oil Statistics.
INTERNATIONAL ENERGY AGENCY
OIL INFORMATION (2011 Edition) - III.551
UNITED KINGDOM
* Excluding electricity trade.
** Includes hydro, geothermal, solar, wind, combustible renewables and waste, etc.
Source: Annual Energy Balances.
0
10
20
30
40
50
60
Coal Oil Gas Nuclear Other **
Percentage
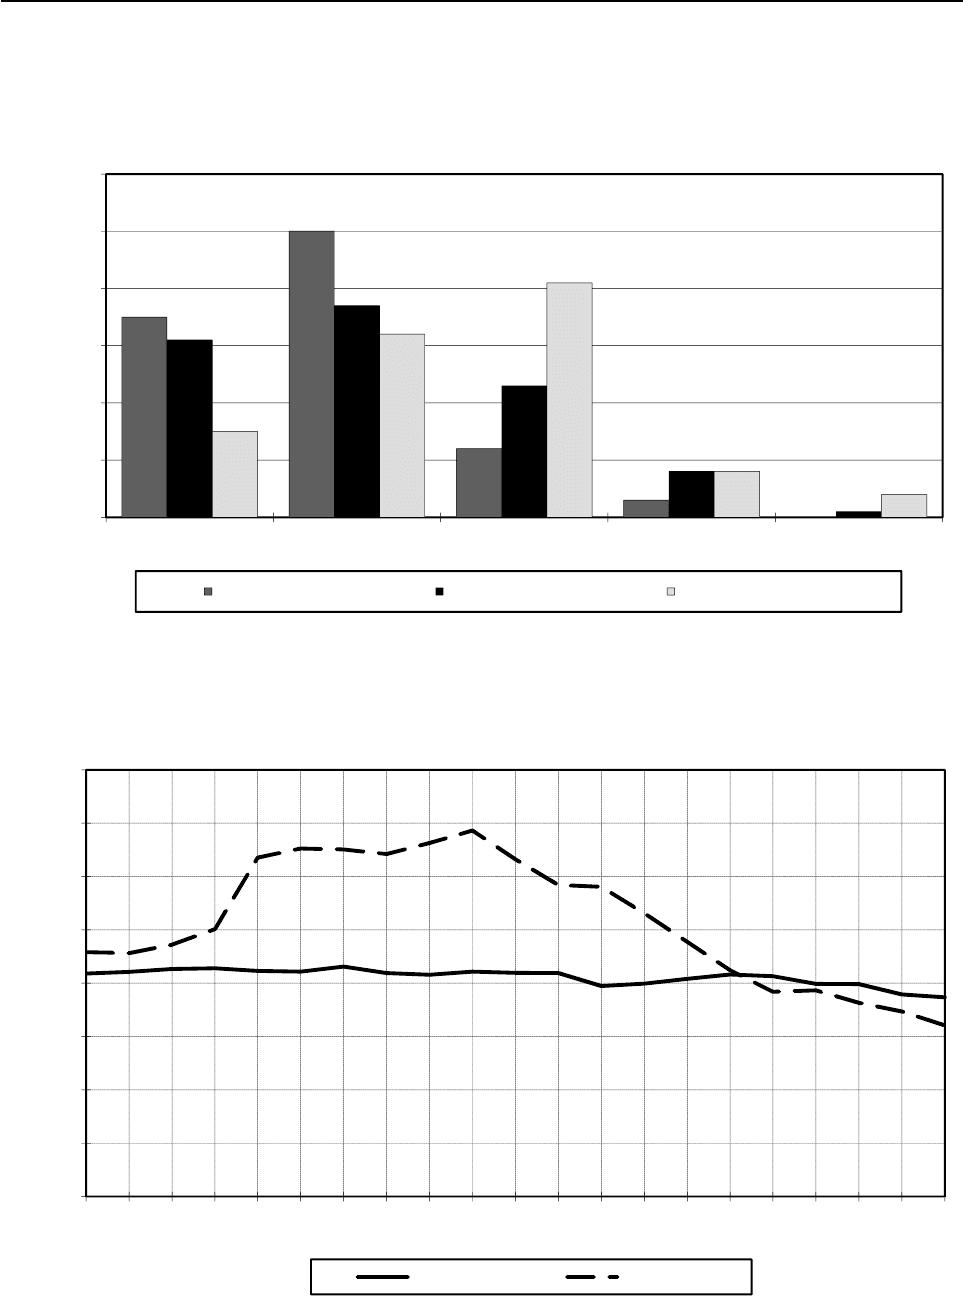
Figure 1. Fuel shares of TPES *
1973 TPES = 218 Mtoe 1990 TPES = 206 Mtoe 2010e TPES = 204 Mtoe
160
Figure 2. Oil production and consumption
*** Includes refinery fuel and international marine bunkers.
Source: Annual Oil Statistics.
0
20
40
60
80
100
120
140
160
1990
1991
1992
1993
1994
1995
1996
1997
1998
1999
2000
2001
2002
2003
2004
2005
2006
2007
2008
2009
2010e
Million Metric Tons
Fi
gure
2
.
Oil
pro
d
uc
ti
on an
d
consump
ti
on
Consumption *** Production
INTERNATIONAL ENERGY AGENCY

III.552 - OIL INFORMATION (2011 Edition)
UNITED KINGDOM
Table 1: Oil supply and consumption - summary table
000 metric tons
1973 1978 1980 1990 2007 2008 2009 2010e
Indigenous production
1
547 54 115 80 482 91 602 77 258 72 608 69 367 64 194
Crude oil - 53 475 78 917 87 990 70 357 65 497 62 820 57 891
NGL - 625 1 550 3 606 6 475 6 168 5 378 4 885
Othe
r
- 15 15 6 426 943 1 169 1 418
+ Net imports 113 132 41 299 1 672 -10 393 445 6 770 5 872 11 890
Crude oil, NGL, othe
r
112 237 42 943 6 537 -4 339 6 099 11 664 9 147 13 130
Oil products 895 -1 644 -4 865 -6 054 -5 654 -4 894 -3 275 -1 240
- Intl. marine bunkers 5 499 2 623 2 457 2 537 2 372 2 595 2 490 2 083
+ Stock changes 511 - 182 180 971 1 146 - 314 366 226
TOTAL SUPPLY 108 691 92 609 79 877 79 643 76 477 76 469 73 115 74 227
Refinery intake 114 191 96 390 86 393 88 692 81 544 81 667 76 395 74 598
Refinery output 113 004 95 579 85 544 88 120 81 636 81 379 76 026 72 869
LPG + ethane 1 655 1 650 1 497 1 616 2 298 2 248 2 113 2 248
Naphtha 6 607 4 809 3 666 2 165 2 561 1 863 1 529 1 484
Kerosenes 7 267 7 397 7 232 9 850 9 144 9 641 8 852 8 351
Gasolines 15 219 16 072 16 675 26 724 21 434 20 482 20 654 20 127
Gas/diesel oil 27 853 24 064 22 172 23 404 26 702 27 751 26 312 24 954
Fuel oil 45 970 33 792 27 226 15 825 11 809 11 349 8 648 7 484
Other products 8 433 7 795 7 076 8 536 7 688 8 045 7 918 8 221
- Refinery losse
s
1 187 811 849 572 - 92 288 369 1 729
+ Returns - 916 2 005 916 396 429 251 225
- Statistical differences 649 1 035 1 346 -1 039 - 383 - 398 - 267 98
TOTAL CONSUMPTION 106 855 91 679 79 687 81 026 77 348 77 008 73 264 72 625
Transformation and energy 33 189 23 746 18 595 15 337 5 756 6 576 6 576 ..
Crude oil - - ---- - ..
LPG + ethane 261 201 332 365 172 128 133 ..
Gas/diesel oil 1 406 1 046 811 272 37 24 39 ..
Fuel oil 26 507 18 238 13 106 9 984 1 921 1 835 1 631 ..
Petroleum coke - - 467 976 1 312 1 817 1 912 ..
Othe
r
5 015 4 261 3 879 3 740 2 314 2 772 2 861 ..
Transport 29 464 31 306 32 124 43 805 54 168 53 010 50 935 ..
Motor gasolin
e
16 927 18 348 19 145 24 312 17 712 16 826 16 012 ..
Gas/diesel oil 7 403 7 813 7 728 12 434 22 919 23 040 22 588 ..
Subtotal 24 330 26 161 26 873 36 746 40 631 39 866 38 600 ..
Aviation fuels 4 337 4 557 4 728 6 616 12 630 12 172 11 536 ..
Othe
r
797 588 523 443 907 972 799 ..
Industry 31 757 24 483 18 729 15 042 13 366 13 313 11 819 ..
Naphtha 6 734 4 884 2 354 2 767 1 006 848 1 011 ..
LPG + ethane 1 248 1 126 992 1 941 3 483 3 935 3 570 ..
Gas/diesel oil 5 718 4 065 3 322 2 582 3 194 3 073 2 609 ..
Fuel oil 13 333 10 038 8 466 3 460 836 806 375 ..
Othe
r
4 724 4 370 3 595 4 292 4 847 4 651 4 254 ..
Other 12 445 12 144 10 239 6 842 4 058 4 109 3 934 ..
Gas/diesel oil 6 231 6 591 5 783 3 849 1 310 1 173 1 064 ..
Fuel oil 3 262 3 085 2 458 1 023 117 183 117 ..
Othe
r
2 952 2 468 1 998 1 970 2 631 2 753 2 753 ..
Memo: Non-energy use 11 879 10 548 9 172 10 085 7 648 8 026 7 254 ..
Chem/petchem. feedst. 7 494 6 082 3 907 5 115 4 107 4 332 4 120 ..
Other 4 385 4 466 5 265 4 970 3 541 3 694 3 134 ..
1. Includes inputs from other sources.
Source: Annual Oil Statistics.
INTERNATIONAL ENERGY AGENCY

OIL INFORMATION (2011 Edition) - III.553
UNITED KINGDOM
Table 2: Supply of crude oil, NGL, feedstocks and other hydrocarbons
000 metric tons
1973 1978 1980 1990 2007 2008 2009 2010e
CRUDE OIL
Indigenous productio
n
- 53 475 78 917 87 990 70 357 65 497 62 820 57 891
+ Imports - 65 639 43 262 41 578 49 893 51 466 47 104 47 669
- Exports - 24 411 38 895 54 022 45 129 41 504 39 446 36 650
- Direct use - - ---- - -
+ Stock change - - 578 -1 059 635 650 172 393 179
- Statistical differences - 760 1 087 -1 914 64 - 213 155 379
Refinery intake - 93 365 81 138 78 095 75 707 75 844 70 716 68 710
Closing stock level - 8 951 10 466 3 742 4 985 4 813 4 420 4 241
NATURAL GAS LIQUIDS
Indigenous productio
n
- 625 1 550 3 606 6 475 6 168 5 378 4 885
+ Imports - - - - - 649 561 569
- Exports - 342 488 1 197 2 584 3 039 2 356 2 187
- Direct use - 231 470 1 184 3 225 3 135 2 618 2 306
+ Stock change - - - - 69 8 60 - 30 48
- Statistical differences - - - - 420 - 7 61 7 7
Refinery intake - 52 592 1 576 681 642 928 1 002
Closing stock level - - - 149 172 112 142 94
REFINERY FEEDSTOCKS
Backflows - 916 2 005 916 187 249 251 225
+ Transfers - - - - 547 208 - 50
+ Imports - 2 505 3 455 10 922 7 206 7 959 6 683 6 579
- Exports - 448 797 1 776 3 287 3 867 3 399 2 850
+ Stock change - - - - 112 34 - 150 182 - 213
- Statistical differences - - - 929 - 43 161 135 324
Refinery intake - 2 973 4 663 9 021 4 730 4 238 3 582 3 467
Closing stock level - - - 2 575 1 257 1 407 1 225 1 438
OTHER HYDROCARBONS
Indigenous productio
n
- 15 15 6 426 943 1 169 1 418
+ Imports - - - 156 - - - -
- Exports - - ---- - -
- Direct use - 15 15 162 - - - -
+ Stock change - - ---- - 1 1
- Statistical differences - - - - - - - 1 -
Refinery intake - - - - 426 943 1 169 1 419
Closing stock level - - - - - - 41 40
CRUDE OIL, NGL, FEEDSTOCKS AND OTHER
Indigenous productio
n
547 54 115 80 482 91 602 77 258 72 608 69 367 64 194
+ Backflows - 916 2 005 916 187 249 251 225
+ Transfers - - - - 547 208 - 50
+ Imports 115 472 68 144 46 717 52 656 57 099 60 074 54 348 54 817
- Exports 3 235 25 201 40 180 56 995 51 000 48 410 45 201 41 687
- Direct use 316 246 485 1 346 3 225 3 135 2 618 2 306
+ Stock change 437 - 578 -1 059 454 692 82 544 15
- Statistical differences -1 286 760 1 087 -1 405 14 9 296 710
Refinery intake 114 191 96 390 86 393 88 692 81 544 81 667 76 395 74 598
Closing stock level 8 194 8 951 10 466 6 466 6 414 6 332 5 828 5 813
Source: Annual Oil Statistics.
INTERNATIONAL ENERGY AGENCY

III.554 - OIL INFORMATION (2011 Edition)
UNITED KINGDOM
Table 3: Motor gasoline - supply
000 metric tons
1973 1978 1980 1990 2007 2008 2009 2010e
MOTOR GASOLINE
Refinery output 14 842 15 959 16 609 26 724 21 434 20 482 20 654 20 127
+ Imports 3 377 2 404 2 674 1 907 3 265 3 302 2 966 3 684
- Exports 1 257 1 049 848 4 265 7 334 7 017 7 811 9 000
+ Transfers - - - - 59 17 198 25
+ Stock change - 332 111 - 43 39 - 15 - 67 29 169
- Statistical differences - 297 - 924 - 753 93 - 303 - 109 24 - 240
Total consumption 16 927 18 349 19 145 24 312 17 712 16 826 16 012 15 245
Closing stock level - 1 851 1 938 1 911 969 1 036 1 007 838
Table 4: Aviation fuels - supply
000 metric tons
1973 1978 1980 1990 2007 2008 2009 2010e
AVIATION GASOLINE
Refinery output 63 37 60 - - - - -
+ Imports 59 37 26 31 21 22 26 15
- Exports 41 35 49 1 4 2 1 -
+ Transfers - - - - 8 1 - -
+ Stock change 3 13 4 - 8 5 1 - 2 2
- Statistical differences 21 6 1 - 4 - 3 - 8 1 - 2
Total consumption 63 46 40 26 33 30 22 19
Closing stock level - 29 30 12 5 4 6 4
GASOLINE TYPE JET FUEL
Refinery output 314 76 6 - - - - -
+ Imports 31 17 2 - - - - -
- Exports 302 94 9 - - - - -
+ Transfers - - ---- - -
+ Stock change 17 1 5 - - - - -
- Statistical differences - 12 - 5 1 - - - - -
Total consumption 72 5 3 - - - - -
Closing stock level - 7 1 - - - - -
KEROSENE TYPE JET FUEL
Refinery output 4 550 4 783 5 198 7 541 6 176 6 549 6 022 5 671
+ Imports 802 415 356 192 7 608 7 961 7 513 7 285
- Exports 586 518 622 992 1 162 1 908 1 451 1 454
+ Transfers - - - - - 338 - 300 - 485 - 374
+ Stock change - 48 86 99 - 58 86 - 283 - 7 - 65
- Statistical differences 516 260 346 93 - 263 - 123 78 - 228
Total consumption 4 202 4 506 4 685 6 590 12 633 12 142 11 514 11 291
Closing stock level - 527 629 587 833 1 116 1 123 1 188
Source: Annual Oil Statistics.
INTERNATIONAL ENERGY AGENCY

OIL INFORMATION (2011 Edition) - III.555
UNITED KINGDOM
Table 5A: Gas/diesel oil - supply and consumption
000 metric tons
1973 1978 1980 1990 2007 2008 2009 2010e
Refinery output 27 853 24 064 22 172 23 404 26 702 27 751 26 312 24 954
+ Recycled products - - - - - - - -
+ Imports 1 572 1 681 1 417 1 340 8 250 7 468 6 616 9 441
- Exports 6 832 5 061 4 737 4 430 6 533 7 277 6 033 6 453
- Intl. marine bunkers 997 797 758 1 138 901 680 716 804
+ Transfers - - - - - 284 5 34 - 26
+ Stock changes - 398 - 171 40 86 - 86 - 58 157 84
- Statistical differences 440 201 490 125 - 312 - 101 70 116
Total consumption 20 758 19 515 17 644 19 137 27 460 27 310 26 300 27 080
Transformation 894 735 560 124 29 20 27 ..
Main activity producer electricity 853 444 198 44 10 6 10 ..
Autoproducer electricity - 284 354 - 12 5 10 ..
Main activity producer CHP - - - - - - - ..
Autoproducer CHP - - - - - - - ..
Main activity producer heat - - - - - - - ..
Autoproducer heat - - - - 5 5 5 ..
Petrochemical industry - - - 67 2 4 2 ..
Other transformation 41 7 8 13 - - - ..
Energy industry own use 512 311 251 148 8 4 12 ..
Refinery fuel - 40 19 2 8 4 12 ..
Other energy industry 512 271 232 146 - - - ..
Final consumption 19 352 18 469 16 833 18 865 27 423 27 286 26 261 ..
Transport
7 403 7 813 7 728 12 434 22 919 23 040 22 588 ..
Aviation - - - - - - - ..
Road 5 658 5 875 5 854 10 652 21 345 21 353 20 975 ..
Rail 970 824 790 601 632 682 674 ..
Domestic navigation 775 1 114 1 084 1 181 942 1 005 939 ..
Non-specified - - - - - - - ..
Industry
5 718 4 065 3 322 2 582 3 194 3 073 2 609 ..
Iron and steel - - - - - - - ..
Chemical (incl. pet.-chem.) 288 193 166 561 341 286 223 ..
Non-ferrous metals 172 115 95 26 20 19 16 ..
Non-metallic minerals 407 270 222 166 180 158 136 ..
Transport equipment 311 246 208 109 81 72 62 ..
Machinery 874 721 552 250 91 86 74 ..
Mining and quarrying 478 323 318 259 - - - ..
Food and tobacco 436 389 346 169 208 218 187 ..
Pulp, paper and printing 124 108 76 25 29 30 26 ..
Wood and wood products 61 62 49 17 - - - ..
Construction 1 152 888 814 641 135 128 110 ..
Textiles and leather 220 157 119 38 100 86 74 ..
Non-specified 1 195 593 357 321 2 009 1 990 1 701 ..
Other
6 231 6 591 5 783 3 849 1 310 1 173 1 064 ..
Commerce and public 3 416 3 503 3 022 2 193 716 657 581 ..
Residential 888 812 563 286 173 164 131 ..
Agriculture (incl. fishing) 1 245 1 041 813 662 143 140 148 ..
Non-specified 682 1 235 1 385 708 278 212 204 ..
Memo: Non-energy use 288 193 166 628 238 194 142 ..
Chem/petchem. feedst. 288 193 166 561 236 190 140 ..
Other - - - 67 2 4 2 ..
Closing stock level - 3 543 3 731 2 048 2 142 2 200 2 043 1 959
Source: Annual Oil Statistics.
INTERNATIONAL ENERGY AGENCY

III.556 - OIL INFORMATION (2011 Edition)
UNITED KINGDOM
Table 5B: Fuel oil (residual) - supply and consumption
000 metric tons
1973 1978 1980 1990 2007 2008 2009 2010e
Refinery output 45 970 33 792 27 226 15 825 11 809 11 349 8 648 7 484
+ Recycled products - - - - - - - -
+ Imports 7 053 3 845 2 776 4 538 1 130 1 198 1 241 947
- Exports 5 575 3 707 5 121 4 417 7 739 7 304 5 547 4 893
- Intl. marine bunkers 4 502 1 826 1 699 1 399 1 471 1 915 1 774 1 279
+ Transfers - - - - - 166 3 - 74 14
+ Stock changes 1 036 181 1 137 391 291 - - 418 - 45
- Statistical differences 589 778 169 390 411 - 137 - 575 29
Total consumption 43 393 31 507 24 150 14 548 3 443 3 468 2 651 2 199
Transformation 22 561 14 964 9 580 7 964 688 868 946 ..
Main activity producer electricity 18 318 10 772 6 084 6 336 401 364 607 ..
Autoproducer electricity - 1 636 1 522 421 e 20 180 125 ..
Main activity producer CHP - 259 291 - - - - ..
Autoproducer CHP - - - 556 e 14 64 - ..
Main activity producer heat - - - - - - - ..
Autoproducer heat - - - - 52 52 52 ..
Petrochemical industry - 6 544 105 - - - ..
Other transformation 4 243 2 291 1 139 546 201 208 162 ..
Energy industry own use 3 946 3 274 3 526 2 020 1 233 967 685 ..
Refinery fuel 3 946 3 274 3 526 2 020 1 233 967 685 ..
Other energy industry - - - - - - - ..
Final consumption 16 886 13 269 11 044 4 564 1 522 1 633 1 020 ..
Transport
291 146 120 81 569 644 528 ..
Aviation - - - - - - - ..
Road - - - - - - - ..
Rail 51 57 41 2 - - - ..
Domestic navigation 240 89 79 79 569 644 528 ..
Non-specified - - - - - - - ..
Industry
13 333 10 038 8 466 3 460 836 806 375 ..
Iron and steel - - - - 19 12 52 ..
Chemical (incl. pet.-chem.) 2 757 2 124 2 402 1 357 76 68 63 ..
Non-ferrous metals 311 208 168 32 25 25 26 ..
Non-metallic minerals 1 631 965 712 304 1 1 34 ..
Transport equipment 690 519 355 115 18 19 19 ..
Machinery 1 512 1 226 930 278 23 22 22 ..
Mining and quarrying 136 62 61 19 - - - ..
Food and tobacco 2 298 1 852 1 574 725 40 43 54 ..
Pulp, paper and printing 1 467 1 207 884 194 32 31 32 ..
Wood and wood products 62 64 46 9 - - - ..
Construction 106 77 91 79 21 19 18 ..
Textiles and leather 1 409 1 243 881 194 10 10 10 ..
Non-specified 954 491 362 154 571 556 45 ..
Other
3 262 3 085 2 458 1 023 117 183 117 ..
Commerce and public 2 480 1 912 1 623 894 100 148 98 ..
Residential 67 64 58 17 - - - ..
Agriculture (incl. fishing) 375 316 227 98 10 24 13 ..
Non-specified 340 793 550 14 7 11 6 ..
Memo: Non-energy use - 42 1 467 496 - - - ..
Chem/petchem. feedst. - 36 923 391 - - - ..
Other - 6 544 105 - - - ..
Closing stock level - 4 245 3 576 2 273 693 693 1 111 1 156
Source: Annual Oil Statistics.
INTERNATIONAL ENERGY AGENCY

OIL INFORMATION (2011 Edition) - III.557
UNITED KINGDOM
Table 5C: Total products - supply and consumption
000 metric tons
1973 1978 1980 1990 2007 2008 2009 2010e
Refinery output 113 004 95 579 85 544 88 120 81 636 81 379 76 026 72 869
+ Recycled products - - - - 209 180 - -
+ Imports 18 299 11 546 9 245 10 849 23 837 23 917 22 459 24 964
- Exports 17 404 13 190 14 110 16 903 29 491 28 811 25 734 26 204
- Intl. marine bunkers 5 499 2 623 2 457 2 537 2 372 2 595 2 490 2 083
+ Transfers 316 246 485 1 346 2 678 2 927 2 618 2 256
+ Stock changes 74 396 1 239 517 454 - 396 - 178 211
- Statistical differences 1 935 275 259 366 - 397 - 407 - 563 - 612
Total consumption 106 855 91 679 79 687 81 026 77 348 77 008 73 264 72 625
Transformation 25 624 16 979 11 858 9 025 1 080 1 583 1 724 ..
Main activity producer electricity 19 171 11 216 6 282 6 536 589 820 1 119 ..
Autoproducer electricity - 1 920 1 876 421 32 185 135 ..
Main activity producer CHP - 259 291 - - - - ..
Autoproducer CHP - - - 556 14 64 - ..
Main activity producer heat - - - - - - - ..
Autoproducer heat - - - - 57 57 57 ..
Petrochemical industry - 916 2 005 916 187 249 251 ..
Other transformation 6 453 2 668 1 404 596 201 208 162 ..
Energy industry own use 7 565 6 767 6 737 6 312 4 676 4 993 4 852 ..
Refinery fuel 7 053 6 423 6 317 5 836 4 676 4 993 4 852 ..
Other energy industry 512 344 420 476 - - - ..
Final consumption 73 666 67 933 61 092 65 689 71 592 70 432 66 688 ..
Transport
29 464 31 306 32 124 43 805 54 168 53 010 50 935 ..
Aviation 4 341 4 561 4 732 6 619 12 635 12 176 11 539 ..
Road 22 996 24 585 25 327 35 261 39 356 38 483 37 226 ..
Rail 1 035 895 847 615 644 686 686 ..
Domestic navigation 1 092 1 265 1 218 1 310 1 533 1 665 1 484 ..
Non-specified - - - - - - - ..
Industry
31 757 24 483 18 729 15 042 13 366 13 313 11 819 ..
Iron and steel 56 60 18 24 19 12 52 ..
Chemical (incl. pet.-chem.) 10 251 8 170 5 386 6 081 4 327 4 496 4 367 ..
Non-ferrous metals 483 323 263 58 45 44 42 ..
Non-metallic minerals 2 038 1 235 934 470 181 159 170 ..
Transport equipment 1 001 765 563 224 135 91 81 ..
Machinery 2 386 1 947 1 482 528 114 108 96 ..
Mining and quarrying 614 385 379 278 - - - ..
Food and tobacco 2 734 2 241 1 920 894 248 261 241 ..
Pulp, paper and printing 1 591 1 315 960 219 61 61 58 ..
Wood and wood products 123 126 95 26 - - - ..
Construction 3 716 2 852 2 731 3 211 1 728 1 888 1 501 ..
Textiles and leather 1 629 1 400 1 000 232 110 96 84 ..
Non-specified 5 135 3 664 2 998 2 797 6 398 6 097 5 127 ..
Other
12 445 12 144 10 239 6 842 4 058 4 109 3 934 ..
Commerce and public 5 906 5 428 4 657 3 099 828 809 679 ..
Residential 3 783 3 262 2 553 2 230 2 594 2 730 2 712 ..
Agriculture (incl. fishing) 1 696 1 412 1 089 789 268 275 262 ..
Non-specified 1 060 2 042 1 940 724 368 295 281 ..
Memo: Non-energy use 11 879 10 548 9 172 10 085 7 648 8 026 7 254 ..
Chem/petchem. feedst. 7 494 6 082 3 907 5 115 4 107 4 332 4 120 ..
Other 4 385 4 466 5 265 4 970 3 541 3 694 3 134 ..
Closing stock level - 12 335 12 208 8 353 6 426 6 822 7 000 6 789
Source: Annual Oil Statistics.
INTERNATIONAL ENERGY AGENCY