IEA Statistics. Oil Information 2011
Подождите немного. Документ загружается.


III.488 - OIL INFORMATION (2011 Edition)
SLOVENIA
Table 7D: Imports by country of origin
000 metric tons
2008 2009 2010e 2008 2009 2010e 2008 2009 2010e
Fuel oil (residual) Petroleum coke Other products
Australia - - - - - - - - -
Bel
g
ium - - - - - - 2 2 -
Canada - - - - - - - - -
Czech Re
p
ubli
c
- - - - - - - - -
Denmark - - - - - - - - -
Finland - - - - - - - - -
France - - - - 1 - 1 - -
German
y
- - - 33 7 - 2 3 -
Greece - - - - - - - - -
Hun
g
ar
y
1 2 - - - - 57 10 8
Ireland - - - - - - - - -
Ital
y
67 34 16 16 10 - 62 54 41
Ja
p
an - - - - - - - - -
Korea - - - - - - - - -
Mexic
o
- - - - - - - - -
Netherlands - - - - - - - - -
New Zealand - - - - - - - - -
Norwa
y
- - - - - - - - -
Poland - - - - - - 3 6 9
S
p
ain - - - - - - - - -
Sweden - - - - - - - - -
Turke
y
- - - --- 3 - 1
United Kin
g
dom - - - - - - 4 2 -
United States - - - 35 29 - - - -
Othe
r
11 14 11 - - - 28 63 52
OECD 79 50 27 84 47 - 162 140 111
Ar
g
entina - - - - - - - - -
Brazil - - - - - - - - -
Colombia - - - - - - - - -
Ecuado
r
- - - - - - - - -
Netherlands Antilles - - - - - - - - -
Peru - - - - - - - - -
Trinidad and Toba
go
- - - - - - - - -
Venezuela - - - - - - - - -
Othe
r
- - - - - - - - -
Latin America - - - - - - - - -
Kazakhstan - - - - - - - - -
Russian Federation - - - - - - 2 2 -
Other - - - 29 10 - 9 10 3
Non-OECD Europe/Eurasia
- - - 29 10 - 11 12 3
Iran - - - - - - - - -
Ira
q
- - - - - - - - -
Kuwai
t
- - - - - - - - -
Oman - - - - - - - - -
Qata
r
- - - - - - - - -
Saudi Arabia - - - - - - - - -
United Arab Emirates - - - - - - - - -
Othe
r
- - - - - - - - -
Middle East - - - - - - - - -
India - - - - - - - - -
Indonesi
a
- - - - - - - - -
Sin
g
a
p
ore - - - - - - - - -
Othe
r
- - - - - - - - -
Asia - - - - - - - - -
China - - - - - - - - -
Al
g
eria - - - - - - - - -
An
g
ola - - - - - - - - -
Cameroon - - - - - - - - -
E
gypt
- - - - - - - - -
Gabon - - - - - - - - -
Lib
y
an Arab Jamahiri
y
a - - - - - - - - -
Ni
g
eria - - - - - - - - -
Tunisia - - - - - - - - -
Othe
r
- - - - - - - - -
Africa - - - - - - - - -
Non-spec./other 6 3 18 7 - 63 1 1 15
Total imports 85 53 45 120 57 63 174 153 129
Memo: Total OPEC - - - - - - - - -
Source: Annual Oil Statistics.
INTERNATIONAL ENERGY AGENCY

OIL INFORMATION (2011 Edition) - III.489
SLOVENIA
Table 8A: Exports by country of destination
000 metric tons
2008 2009 2010e 2008 2009 2010e 2008 2009 2010e
Crude oil Natural gas liquids Feedstocks and other
Australia - - - - - - - - -
Austria - - - - - - - - -
Bel
g
ium - - - - - - - - -
Canada - - - - - - - - -
Denmark - - - - - - - - -
Finland - - - - - - - - -
France - - - - - - - - -
German
y
- - - - - - - - -
Greece - - - - - - - - -
Ireland - - - - - - - - -
Ital
y
- - - - - - - - -
Ja
p
an - - - - - - - - -
Luxembour
g
- - - - - - - - -
Mexic
o
- - - - - - - - -
Netherlands - - - - - - - - -
Norwa
y
- - - - - - - - -
Portu
g
al - - - - - - - - -
S
p
ain - - - - - - - - -
Sweden - - - - - - - - -
Switzerland - - - - - - - - -
Turke
y
- - - - - - - - -
United Kin
g
dom - - - - - - - - -
United States - - - - - - - - -
Other OECD - - - - - - - - -
OECD - - - - - - - - -
Africa - - - - - - - - -
Latin America - - - - - - - - -
Asia - - - - - - - - -
China - - - - - - - - -
Non-OECD Euro
p
e/Eurasi
a
- - - - - - - - -
Russian Federation - - - - - - - - -
Middle Eas
t
- - - - - - - - -
Non-s
p
ecified/Othe
r
- - - - - - - - -
Non-OECD - - - - - - - - -
Total exports - - - - - - - - -
Total products Liquefied petroleum gas Naphtha
Australia - - - - - - - - -
Austria 3 2 33 2 2 2 - - -
Bel
g
ium - - - - - - - - -
Canada - - - - - - - - -
Denmark - - - - - - - - -
Finland - - - - - - - - -
France - 1 - - - - - - -
German
y
1 - 6 - - - - - -
Greece - - - - - - - - -
Ireland - - - - - - - - -
Ital
y
- - - - - - - - -
Ja
p
an - - - - - - - - -
Luxembour
g
- - - - - - - - -
Mexic
o
- - - - - - - - -
Netherlands 5 - - - - - - - -
Norwa
y
- - - - - - - - -
Portu
g
al - - - - - - - - -
S
p
ain - - - - - - - - -
Sweden - - - - - - - - -
Switzerland - - - - - - - - -
Turke
y
- - - - - - - - -
United Kin
g
dom - - - - - - - - -
United States - - - - - - - - -
Other OECD 1 - - - - - - - -
OECD 10 3 39 2 2 2 - - -
Africa - - - - - - - - -
Latin America - - - - - - - - -
Asia - - - - - - - - -
China - - - - - - - - -
Non-OECD Euro
p
e/Eurasi
a
537 472 639 11 9 7 - - -
Russian Federation - - - - - - - - -
Middle Eas
t
- - - - - - - - -
Non-s
p
ecified/othe
r
1 3 10 - - - - - -
Non-OECD 538 475 649 11 9 7 - - -
Total exports 548 478 688 13 11 9 - - -
Source: Annual Oil Statistics.
INTERNATIONAL ENERGY AGENCY

III.490 - OIL INFORMATION (2011 Edition)
SLOVENIA
Table 8B: Exports by country of destination
000 metric tons
2008 2009 2010e 2008 2009 2010e 2008 2009 2010e
Total gasoline Total kerosene Gas/diesel oil
Australia - - - - - - - - -
Austria - - - - - - - - 31
Bel
g
ium -- - --- - - -
Canada - - - - - - - - -
Denmark - - - - - - - - -
Finland - - - - - - - - -
France - - - - - - - - -
German
y
-- - --- - - 6
Greece - - - - - - - - -
Ireland - - - - - - - - -
Ital
y
-- - --- - - -
Ja
p
an -- - --- - - -
Luxembour
g
-- - --- - - -
Mexic
o
-- - --- - - -
Netherlands - - - - - - - - -
Norwa
y
-- - --- - - -
Portu
g
al -- - --- - - -
S
p
ain -- - --- - - -
Sweden - - - - - - - - -
Switzerland - - - - - - - - -
Turke
y
-- - --- - - -
United Kin
g
dom -- - --- - - -
United States - - - - - - - - -
Other OECD - - - - - - - - -
OECD - - - - - - - - 37
Africa - - - - - - - - -
Latin America - - - - - - - - -
Asia - - - - - - - - -
China - - - - - - - - -
Non-OECD Euro
p
e/Eurasi
a
100 105 146 1 - - 389 339 471
Russian Federation - - - - - - - - -
Middle Eas
t
-- - --- - - -
Non-s
p
ecified/Othe
r
-- - --- - - 2
Non-OECD 100 105 146 1 - - 389 339 473
Total exports 100 105 146 1 - - 389 339 510
Fuel oil (residual) Petroleum coke Other products
Australia - - - - - - - - -
Austria - - - 1 - - - - -
Bel
g
ium -- - --- - - -
Canada - - - - - - - - -
Denmark - - - - - - - - -
Finland - - - - - - - - -
France - - - - 1 - - - -
German
y
-- - 1-- - - -
Greece - - - - - - - - -
Ireland - - - - - - - - -
Ital
y
-- - --- - - -
Ja
p
an -- - --- - - -
Luxembour
g
-- - --- - - -
Mexic
o
-- - --- - - -
Netherlands - - - 5 - - - - -
Norwa
y
-- - --- - - -
Portu
g
al -- - --- - - -
S
p
ain -- - --- - - -
Sweden - - - - - - - - -
Switzerland - - - - - - - - -
Turke
y
-- - --- - - -
United Kin
g
dom -- - --- - - -
United States - - - - - - - - -
Other OECD - - - 1 - - - - -
OECD - - - 8 1 - - - -
Africa - - - - - - - - -
Latin America - - - - - - - - -
Asia - - - - - - - - -
China - - - - - - - - -
Non-OECD Euro
p
e/Eurasi
a
3 - - 7 1 2 26 18 13
Russian Federation - - - - - - - - -
Middle Eas
t
-- - --- - - -
Non-s
p
ecified/othe
r
- - - - 1 1 1 2 7
Non-OECD 3 - - 7 2 3 27 20 20
Total exports 3 - - 15 3 3 27 20 20
Source: Annual Oil Statistics.
INTERNATIONAL ENERGY AGENCY
OIL INFORMATION (2011 Edition) - III.491
SPAIN
* Excluding electricity trade.
** Includes hydro, geothermal, solar, wind, combustible renewables and waste, etc.
Source: Annual Energy Balances.
0
10
20
30
40
50
60
70
80
Coal Oil Gas Nuclear Other **
Percentage
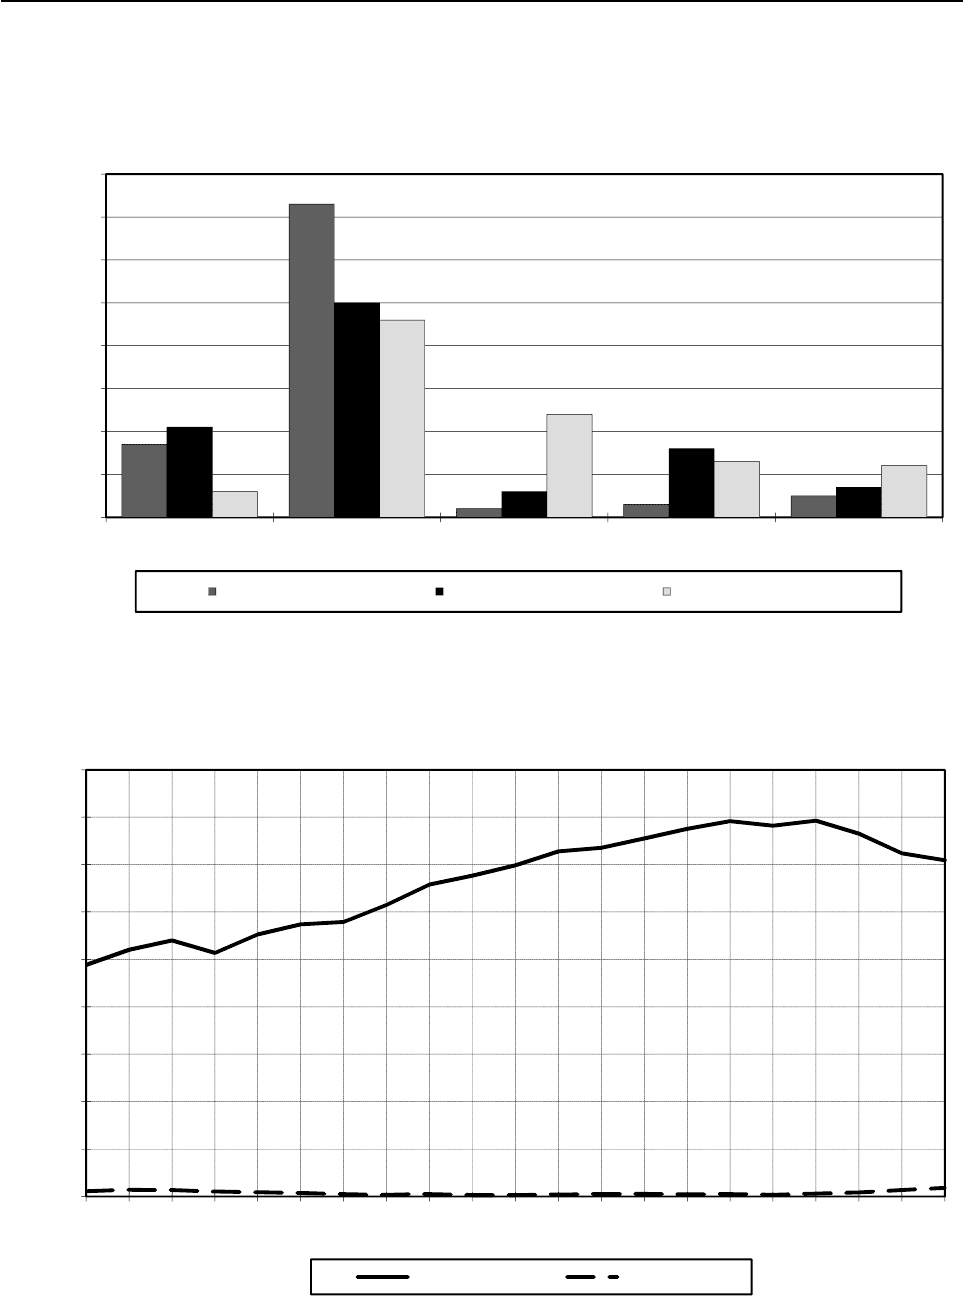
Figure 1. Fuel shares of TPES *
1973 TPES = 52 Mtoe 1990 TPES = 90 Mtoe 2010e TPES = 128 Mtoe
90
Figure 2. Oil production and consumption
*** Includes refinery fuel and international marine bunkers.
Source: Annual Oil Statistics.
0
10
20
30
40
50
60
70
80
90
1990
1991
1992
1993
1994
1995
1996
1997
1998
1999
2000
2001
2002
2003
2004
2005
2006
2007
2008
2009
2010e
Million Metric Tons
Fi
gure
2
.
Oil
pro
d
uc
ti
on an
d
consump
ti
on
Consumption *** Production
INTERNATIONAL ENERGY AGENCY

III.492 - OIL INFORMATION (2011 Edition)
SPAIN
Table 1: Oil supply and consumption - summary table
000 metric tons
1973 1978 1980 1990 2007 2008 2009 2010e
Indigenous production
1
654 1 211 1 755 1 144 622 859 1 369 1 834
Crude oil - 980 1 602 795 142 127 105 123
NGL - 231 153 349 - - - -
Othe
r
- - - - 480 732 1 264 1 711
+ Net imports 40 256 47 397 48 914 48 706 78 927 76 970 71 019 68 952
Crude oil, NGL, othe
r
42 970 46 758 47 516 53 268 59 009 60 517 55 957 56 208
Oil products -2 714 639 1 398 -4 562 19 918 16 453 15 062 12 744
- Intl. marine bunkers 1 393 1 425 1 648 3 716 8 698 9 012 8 956 8 630
+ Stock changes -1 862 1 519 561 - 596 120 - 389 694 - 21
TOTAL SUPPLY 37 655 48 702 49 582 45 538 70 971 68 428 64 126 62 135
Refinery intake 43 070 49 671 49 326 53 757 60 392 61 091 57 737 58 154
Refinery output 42 423 48 265 48 517 52 796 59 855 60 543 57 224 57 644
LPG + ethane 1 439 1 035 962 1 783 1 436 1 484 1 397 1 456
Naphtha 1 789 2 816 2 375 2 196 425 566 535 519
Kerosenes 2 167 2 426 2 236 3 890 6 617 6 556 6 315 6 335
Gasolines 4 491 5 215 5 344 9 797 9 232 8 729 8 973 8 013
Gas/diesel oil 9 662 10 867 10 790 14 571 23 933 24 792 22 390 22 900
Fuel oil 20 603 22 268 22 924 14 980 9 340 9 638 9 147 8 334
Other products 2 272 3 638 3 886 5 579 8 872 8 778 8 467 10 087
- Refinery losse
s
647 1 406 809 961 537 548 513 510
+ Returns - - - 491 84 84 85 88
- Statistical differences 15 1 238 - 429 - 42 - 29 444 272 - 537
TOTAL CONSUMPTION 36 993 46 058 49 202 45 110 70 547 67 520 63 426 62 250
Transformation and energy 7 270 9 175 11 747 6 169 8 625 8 267 8 079 ..
Crude oil - - ---- - ..
LPG + ethane 4 25 21 29 18 18 17 ..
Gas/diesel oil 108 90 83 202 1 653 1 167 1 123 ..
Fuel oil 6 417 8 138 10 634 3 975 2 734 2 798 2 561 ..
Petroleum coke - - - - 566 752 1 077 ..
Othe
r
741 922 1 009 1 963 3 654 3 532 3 301 ..
Transport 11 264 14 421 15 381 21 698 41 179 39 304 36 842 ..
Motor gasolin
e
4 083 5 454 5 421 8 145 6 846 6 287 6 002 ..
Gas/diesel oil 4 819 6 089 6 377 10 465 27 969 26 931 25 286 ..
Subtotal 8 902 11 543 11 798 18 610 34 815 33 218 31 288 ..
Aviation fuels 1 703 2 222 2 014 2 402 5 715 5 642 5 143 ..
Othe
r
659 656 1 569 686 649 444 411 ..
Industry 13 773 16 888 16 320 11 513 13 682 13 327 12 227 ..
Naphtha 1 336 2 376 2 364 2 588 2 262 1 752 1 999 ..
LPG + ethane 194 325 399 290 366 358 331 ..
Gas/diesel oil 144 433 568 442 1 157 1 046 1 005 ..
Fuel oil 9 853 11 530 10 591 3 769 1 314 1 290 1 005 ..
Othe
r
2 246 2 224 2 398 4 424 8 583 8 881 7 887 ..
Other 4 686 5 574 5 754 5 730 7 061 6 622 6 278 ..
Gas/diesel oil 1 690 3 316 3 562 3 149 5 097 4 717 4 526 ..
Fuel oil 1 154 261 198 260 291 274 246 ..
Othe
r
1 842 1 997 1 994 2 321 1 673 1 631 1 506 ..
Memo: Non-energy use 3 412 4 522 4 678 6 010 7 766 7 592 7 100 ..
Chem/petchem. feedst. 1 336 2 376 2 364 3 101 4 013 4 056 3 817 ..
Other 2 076 2 146 2 314 2 909 3 753 3 536 3 283 ..
1. Includes inputs from other sources.
Source: Annual Oil Statistics.
INTERNATIONAL ENERGY AGENCY

OIL INFORMATION (2011 Edition) - III.493
SPAIN
Table 2: Supply of crude oil, NGL, feedstocks and other hydrocarbons
000 metric tons
1973 1978 1980 1990 2007 2008 2009 2010e
CRUDE OIL
Indigenous productio
n
- 980 1 602 795 142 127 105 123
+ Imports - 46 758 47 430 50 630 57 508 58 508 52 297 52 461
- Exports - - ---- - -
- Direct use - 61 61 28 12 12 12 13
+ Stock change - 2 423 56 - 767 66 - 13 261 222
- Statistical differences - 429 6 - - - - - 3
Refinery intake - 49 671 49 021 50 630 57 704 58 610 52 651 52 796
Closing stock level - 3 194 2 914 3 410 5 461 5 474 5 213 4 991
NATURAL GAS LIQUIDS
Indigenous productio
n
- 231 153 349 - - - -
+ Imports - - ---- - -
- Exports - - ---- - -
- Direct use - 231 153 349 - - - -
+ Stock change - - ---- - -
- Statistical differences - - - - - - - -
Refinery intake - - - - - - - -
Closing stock level - - - - - - - -
REFINERY FEEDSTOCKS
Backflows - - - 491 84 84 85 88
+ Transfers - - - - 318 1 204 707 815 1 669
+ Imports - - 86 2 638 1 480 2 002 3 584 3 732
- Exports - - ---- - -
+ Stock change - - 67 225 - 101 - 326 567 - 168
- Statistical differences - - - 152 - 91 - - - 10
Refinery intake - - 305 3 127 2 667 2 467 5 051 5 311
Closing stock level - - 346 556 1 544 1 870 1 303 1 471
OTHER HYDROCARBONS
Indigenous productio
n
- - - - 480 732 1 264 1 711
+ Imports - - - - 21 7 76 15
- Exports - - ---- - -
- Direct use - - - - 480 732 1 264 1 711
+ Stock change - - - - - 7 - 41 24
- Statistical differences - - - - - - - - 8
Refinery intake - - - - 21 14 35 47
Closing stock level - - - - 15 8 49 25
CRUDE OIL, NGL, FEEDSTOCKS AND OTHER
Indigenous productio
n
654 1 211 1 755 1 144 622 859 1 369 1 834
+ Backflows - - - 491 84 84 85 88
+ Transfers - - - - 318 1 204 707 815 1 669
+ Imports 42 970 46 758 47 516 53 268 59 009 60 517 55 957 56 208
- Exports - - ---- - -
- Direct use 111 292 214 377 492 744 1 276 1 724
+ Stock change - 554 2 423 123 - 542 - 35 - 332 787 78
- Statistical differences - 111 429 - 146 - 91 - - - - 1
Refinery intake 43 070 49 671 49 326 53 757 60 392 61 091 57 737 58 154
Closing stock level 5 382 3 194 3 260 3 966 7 020 7 352 6 565 6 487
Source: Annual Oil Statistics.
INTERNATIONAL ENERGY AGENCY

III.494 - OIL INFORMATION (2011 Edition)
SPAIN
Table 3: Motor gasoline - supply
000 metric tons
1973 1978 1980 1990 2007 2008 2009 2010e
MOTOR GASOLINE
Refinery output 4 491 5 215 5 344 9 230 9 232 8 729 8 973 8 013
+ Imports 32 520 191 597 757 478 332 163
- Exports 314 21 3 1 392 3 231 3 309 3 813 3 423
+ Transfers - - - 78 4 362 413 960
+ Stock change - 163 - 260 - 111 - 377 75 85 89 - 45
- Statistical differences - 37 - - - 9 - 9 58 - 8 - 3
Total consumption 4 083 5 454 5 421 8 145 6 846 6 287 6 002 5 671
Closing stock level - 1 446 1 617 1 383 1 465 1 380 1 291 1 336
Table 4: Aviation fuels - supply
000 metric tons
1973 1978 1980 1990 2007 2008 2009 2010e
AVIATION GASOLINE
Refinery output - - - - - - - -
+ Imports 31 11 16 12 8 8 3 6
- Exports - - - - - 3 - -
+ Transfers - - - - 2 6 11 - 2
+ Stock change - 2 - 2 - 1 - - - 4 4
- Statistical differences - 4 - 1 - - 1 - - -
Total consumption 35 13 13 11 11 11 10 8
Closing stock level - 4 6 1 4 4 8 4
GASOLINE TYPE JET FUEL
Refinery output - - - 567 - - - -
+ Imports - - ---- - -
- Exports - - - 255 - - - -
+ Transfers - - - - 15 - - - -
+ Stock change - - - - 9 - - - -
- Statistical differences - - - 16 - - - -
Total consumption - - - 272 - - - -
Closing stock level - - - 20 - - - -
KEROSENE TYPE JET FUEL
Refinery output 1 943 2 405 2 194 3 663 2 562 2 749 1 875 928
+ Imports - 31 635 55 2 254 2 585 2 473 2 434
- Exports 50 323 682 1 283 180 113 120 51
+ Transfers - - - - 122 1 111 366 936 1 914
+ Stock change - 96 - 158 - 189 - 51 33 - 26 11
- Statistical differences 225 - - 12 5 - 8 - 11 5 - 11
Total consumption 1 668 2 209 2 001 2 119 5 704 5 631 5 133 5 247
Closing stock level - 263 479 497 761 728 754 743
Source: Annual Oil Statistics.
INTERNATIONAL ENERGY AGENCY

OIL INFORMATION (2011 Edition) - III.495
SPAIN
Table 5A: Gas/diesel oil - supply and consumption
000 metric tons
1973 1978 1980 1990 2007 2008 2009 2010e
Refinery output 9 662 10 867 10 790 14 571 23 933 24 792 22 390 22 900
+ Recycled products - - - - - - - -
+ Imports - 350 457 1 231 14 410 12 266 11 272 10 801
- Exports 2 228 566 394 401 951 1 003 777 1 148
- Intl. marine bunkers 320 456 395 1 206 1 122 1 442 1 405 1 475
+ Transfers - - - 65 - 591 - 87 581 781
+ Stock changes - 782 - 267 154 47 202 - 424 - 119 - 242
- Statistical differences - 429 - 22 49 5 241 2 - 61
Total consumption 6 761 9 928 10 590 14 258 35 876 33 861 31 940 31 678
Transformation 106 85 78 143 1 653 1 167 1 123 ..
Main activity producer electricity 100 80 70 142 1 418 1 143 1 078 ..
Autoproducer electricity - - 4 1 - - - ..
Main activity producer CHP - - - - - - - ..
Autoproducer CHP - - - - 235 24 45 ..
Main activity producer heat - - - - - - - ..
Autoproducer heat - - - - - - - ..
Petrochemical industry - - - - - - - ..
Other transformation 6 5 4 - - - - ..
Energy industry own use 2 5 5 59 - - - ..
Refinery fuel - - - 13 - - - ..
Other energy industry 2 5 5 46 - - - ..
Final consumption 6 653 9 838 10 507 14 056 34 223 32 694 30 817 ..
Transport
4 819 6 089 6 377 10 465 27 969 26 931 25 286 ..
Aviation - - - - - - - ..
Road 2 896 5 135 4 561 8 995 26 029 25 125 23 784 ..
Rail 203 332 192 210 735 705 600 ..
Domestic navigation 1 716 622 1 618 1 260 1 205 1 101 902 ..
Non-specified 4 - 6 - - - - ..
Industry
144 433 568 442 1 157 1 046 1 005 ..
Iron and steel 10 20 36 28 51 50 50 ..
Chemical (incl. pet.-chem.) 6 60 162 55 103 101 99 ..
Non-ferrous metals - 8 26 12 77 69 60 ..
Non-metallic minerals 11 89 47 25 141 138 135 ..
Transport equipment 14 19 23 20 85 84 85 ..
Machinery 4 20 25 20 62 57 60 ..
Mining and quarrying 30 34 38 51 66 66 60 ..
Food and tobacco 13 104 139 145 239 223 207 ..
Pulp, paper and printing - 12 11 8 59 60 58 ..
Wood and wood products 1 6 8 4 12 11 10 ..
Construction 24 18 8 12 62 62 60 ..
Textiles and leather 2 20 27 42 66 64 61 ..
Non-specified 29 23 18 20 134 61 60 ..
Other
1 690 3 316 3 562 3 149 5 097 4 717 4 526 ..
Commerce and public 5 481 680 630 1 197 1 130 1 118 ..
Residential 3 790 836 1 260 1 965 1 858 1 778 ..
Agriculture (incl. fishing) 1 682 2 045 2 046 1 259 1 935 1 729 1 630 ..
Non-specified - - - - - - - ..
Memo: Non-energy use - - - - - - - ..
Chem/petchem. feedst. - - - - - - - ..
Other - - - - - - - ..
Closing stock level - 2 049 2 061 2 020 5 900 6 324 6 443 6 685
Source: Annual Oil Statistics.
INTERNATIONAL ENERGY AGENCY

III.496 - OIL INFORMATION (2011 Edition)
SPAIN
Table 5B: Fuel oil (residual) - supply and consumption
000 metric tons
1973 1978 1980 1990 2007 2008 2009 2010e
Refinery output 20 603 22 268 22 924 14 980 9 340 9 638 9 147 8 334
+ Recycled products - - - - - - - -
+ Imports 576 718 872 1 107 3 379 3 481 4 255 3 408
- Exports 846 745 652 6 231 2 904 2 463 1 854 2 143
- Intl. marine bunkers 1 073 969 1 253 2 510 7 562 7 558 7 539 7 143
+ Transfers - - - 958 2 283 1 271 - 18 1 019
+ Stock changes - 565 - 10 558 87 43 193 - 13 95
- Statistical differences 634 795 - 428 - 13 - - 8 - 18 - 1
Total consumption 18 061 20 467 22 877 8 404 4 579 4 570 3 996 3 571
Transformation 5 344 6 491 9 095 2 126 2 302 2 304 2 173 ..
Main activity producer electricity 5 344 6 242 8 856 1 356 1 947 1 853 1 697 ..
Autoproducer electricity - 249 226 53 - - - ..
Main activity producer CHP - - - 450 - - - ..
Autoproducer CHP - - - 247 355 451 476 ..
Main activity producer heat - - - - - - - ..
Autoproducer heat - - - - - - - ..
Petrochemical industry - - - 20 - - - ..
Other transformation - - 13 - - - - ..
Energy industry own use 1 073 1 647 1 539 1 849 432 494 388 ..
Refinery fuel 1 073 1 647 1 539 1 829 432 494 388 ..
Other energy industry - - - 20 - - - ..
Final consumption 11 644 12 329 12 243 4 429 1 845 1 772 1 435 ..
Transport
637 538 1 454 400 240 208 184 ..
Aviation - - - - - - - ..
Road - - - - - - - ..
Rail 182 19 11 - - - - ..
Domestic navigation 455 519 1 443 400 240 208 184 ..
Non-specified - - - - - - - ..
Industry
9 853 11 530 10 591 3 769 1 314 1 290 1 005 ..
Iron and steel 1 385 1 253 1 182 360 100 88 71 ..
Chemical (incl. pet.-chem.) 1 390 1 909 1 795 1 083 201 221 183 ..
Non-ferrous metals - 600 561 180 49 47 39 ..
Non-metallic minerals 3 730 4 296 3 797 535 172 147 124 ..
Transport equipment 145 173 153 80 49 50 36 ..
Machinery 214 183 168 80 47 48 31 ..
Mining and quarrying 182 197 203 60 45 42 31 ..
Food and tobacco 1 233 1 207 1 148 760 208 211 157 ..
Pulp, paper and printing 745 833 829 360 181 197 150 ..
Wood and wood products 122 141 139 25 32 26 15 ..
Construction 69 50 41 35 53 49 41 ..
Textiles and leather 558 537 537 211 61 51 43 ..
Non-specified 80 151 38 - 116 113 84 ..
Other
1 154 261 198 260 291 274 246 ..
Commerce and public 623 202 150 230 94 92 89 ..
Residential 490 31 26 15 151 155 137 ..
Agriculture (incl. fishing) 41 28 22 15 46 27 20 ..
Non-specified - - - - - - - ..
Memo: Non-energy use - - - 20 - - - ..
Chem/petchem. feedst. - - - - - - - ..
Other - - - 20 - - - ..
Closing stock level - 2 400 2 302 1 721 1 629 1 436 1 449 1 354
Source: Annual Oil Statistics.
INTERNATIONAL ENERGY AGENCY

OIL INFORMATION (2011 Edition) - III.497
SPAIN
Table 5C: Total products - supply and consumption
000 metric tons
1973 1978 1980 1990 2007 2008 2009 2010e
Refinery output 42 423 48 265 48 517 52 796 59 855 60 543 57 224 57 644
+ Recycled products - - - - - - - -
+ Imports 1 502 3 248 4 600 7 712 30 632 26 684 26 151 24 337
- Exports 4 216 2 609 3 202 12 274 10 714 10 231 11 089 11 593
- Intl. marine bunkers 1 393 1 425 1 648 3 716 8 698 9 012 8 956 8 630
+ Transfers 111 292 214 695 - 712 37 461 55
+ Stock changes -1 308 - 904 438 - 54 155 - 57 - 93 - 99
- Statistical differences 126 809 - 283 49 - 29 444 272 - 536
Total consumption 36 993 46 058 49 202 45 110 70 547 67 520 63 426 62 250
Transformation 5 640 6 799 9 432 2 792 4 458 4 151 4 147 ..
Main activity producer electricity 5 444 6 322 8 926 1 498 3 729 3 539 3 489 ..
Autoproducer electricity - 249 230 54 - - - ..
Main activity producer CHP - - - 450 - - - ..
Autoproducer CHP - - - 247 590 475 521 ..
Main activity producer heat - - - - - - - ..
Autoproducer heat - - - - - - - ..
Petrochemical industry - - - 491 84 84 85 ..
Other transformation 196 228 276 52 55 53 52 ..
Energy industry own use 1 630 2 376 2 315 3 377 4 167 4 116 3 932 ..
Refinery fuel 1 628 2 371 2 310 3 186 3 986 4 058 3 914 ..
Other energy industry 2 5 5 191 181 58 18 ..
Final consumption 29 723 36 883 37 455 38 941 61 922 59 253 55 347 ..
Transport
11 264 14 421 15 381 21 698 41 179 39 304 36 842 ..
Aviation 1 703 2 222 2 014 2 402 5 715 5 642 5 143 ..
Road 7 001 10 707 10 097 17 416 33 236 31 620 29 993 ..
Rail 385 351 203 210 735 705 600 ..
Domestic navigation 2 171 1 141 3 061 1 670 1 493 1 337 1 106 ..
Non-specified 4 - 6 - - - - ..
Industry
13 773 16 888 16 320 11 513 13 682 13 327 12 227 ..
Iron and steel 1 395 1 324 1 273 412 437 403 369 ..
Chemical (incl. pet.-chem.) 2 917 4 460 4 461 4 449 4 631 4 682 4 392 ..
Non-ferrous metals - 616 597 416 698 648 597 ..
Non-metallic minerals 3 823 4 508 3 975 2 230 3 411 3 228 2 955 ..
Transport equipment 159 208 194 109 146 146 129 ..
Machinery 218 256 248 204 246 236 214 ..
Mining and quarrying 212 234 244 112 117 114 96 ..
Food and tobacco 1 253 1 325 1 305 924 475 461 387 ..
Pulp, paper and printing 745 850 847 379 264 281 228 ..
Wood and wood products 124 151 151 30 50 42 29 ..
Construction 1 009 929 801 1 613 2 530 2 437 2 306 ..
Textiles and leather 561 561 569 260 130 118 107 ..
Non-specified 1 357 1 466 1 655 375 547 531 418 ..
Other
4 686 5 574 5 754 5 730 7 061 6 622 6 278 ..
Commerce and public 690 903 990 1 030 1 488 1 425 1 391 ..
Residential 2 023 2 545 2 662 3 344 3 510 3 366 3 173 ..
Agriculture (incl. fishing) 1 973 2 126 2 102 1 356 2 063 1 831 1 714 ..
Non-specified - - - - - - - ..
Memo: Non-energy use 3 412 4 522 4 678 6 010 7 766 7 592 7 100 ..
Chem/petchem. feedst. 1 336 2 376 2 364 3 101 4 013 4 056 3 817 ..
Other 2 076 2 146 2 314 2 909 3 753 3 536 3 283 ..
Closing stock level - 7 407 7 487 6 838 11 428 11 485 11 578 11 677
Source: Annual Oil Statistics.
INTERNATIONAL ENERGY AGENCY