IEA Statistics. Oil Information 2011
Подождите немного. Документ загружается.

OIL INFORMATION (2011 Edition) - III.329
JAPAN
* Excluding electricity trade.
** Includes hydro, geothermal, solar, wind, combustible renewables and waste, etc.
Source: Annual Energy Balances.
0
10
20
30
40
50
60
70
80
90
Coal Oil Gas Nuclear Other **
Percentage
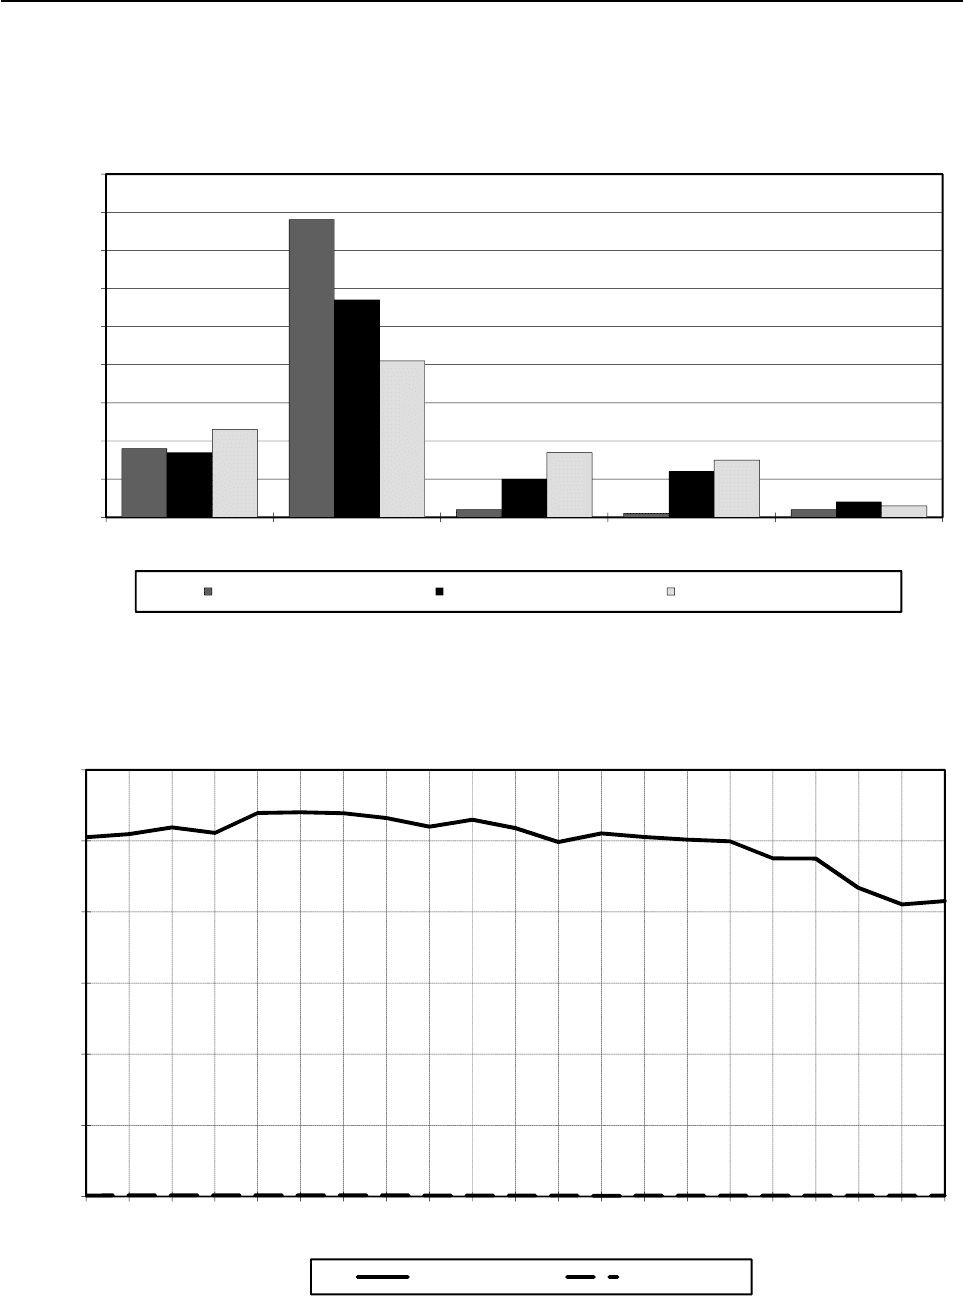
Figure 1. Fuel shares of TPES *
1973 TPES = 320 Mtoe 1990 TPES = 439 Mtoe 2010e TPES = 495 Mtoe
300
Figure 2. Oil production and consumption
*** Includes refinery fuel and international marine bunkers.
Source: Annual Oil Statistics.
0
50
100
150
200
250
300
1990
1991
1992
1993
1994
1995
1996
1997
1998
1999
2000
2001
2002
2003
2004
2005
2006
2007
2008
2009
2010e
Million Metric Tons
Fi
gure
2
.
Oil
pro
d
uc
ti
on an
d
consump
ti
on
Consumption *** Production
INTERNATIONAL ENERGY AGENCY

III.330 - OIL INFORMATION (2011 Edition)
JAPAN
Table 1: Oil supply and consumption - summary table
000 metric tons
1973 1978 1980 1990 2007 2008 2009 2010e
Indigenous production
1
792 641 542 654 747 743 699 649
Crude oil - 539 430 359 286 291 265 250
NGL - 26 21 167 461 452 434 399
Othe
r
- 76 91 128 - - - -
+ Net imports 268 675 258 345 246 681 256 817 235 229 220 440 201 619 206 651
Crude oil, NGL, othe
r
245 094 230 555 218 760 202 858 206 376 198 830 179 042 180 432
Oil products 23 581 27 790 27 921 53 959 28 853 21 610 22 577 26 219
- Intl. marine bunkers 17 350 12 657 11 981 5 449 5 706 5 214 4 634 4 597
+ Stock changes -5 473 - 723 -4 986 -3 478 974 - 59 3 798 657
TOTAL SUPPLY 246 644 245 606 230 256 248 544 231 244 215 910 201 482 203 360
Refinery intake 224 920 215 755 203 677 177 741 204 516 195 458 182 482 179 782
Refinery output 222 333 213 895 200 694 176 960 197 816 189 113 179 049 178 667
LPG + ethane 4 443 4 299 4 194 4 480 4 409 4 096 4 524 4 225
Naphtha 23 035 18 933 16 441 8 563 16 699 15 112 15 767 14 774
Kerosenes 21 954 24 098 23 002 22 999 30 446 28 978 27 102 26 973
Gasolines 19 853 24 624 25 163 31 519 42 747 41 854 42 188 43 079
Gas/diesel oil 30 321 34 481 35 774 50 614 55 301 54 572 50 048 50 152
Fuel oil 109 328 92 645 81 175 40 315 29 545 26 868 21 905 21 364
Other products 13 399 14 815 14 945 18 470 18 669 17 633 17 515 18 100
- Refinery losse
s
2 587 1 860 2 983 781 6 700 6 345 3 433 1 115
+ Returns - 2 479 3 619 1 485 5 081 5 249 4 258 3 789
- Statistical differences -6 274 -8 854 - 74 2 132 -2 214 3 297 1 579 2 944
TOTAL CONSUMPTION 250 331 255 079 230 966 247 116 231 839 211 517 200 728 203 090
Transformation and energy 82 406 88 827 78 042 64 700 46 166 40 230 30 066 ..
Crude oil 20 837 18 893 11 780 18 713 9 758 6 825 3 118 ..
LPG + ethane 300 1 022 1 883 4 534 3 689 3 462 2 953 ..
Gas/diesel oil 688 739 635 1 211 650 562 577 ..
Fuel oil 52 926 53 851 49 442 27 675 17 413 15 128 10 003 ..
Petroleum coke - - - 1 812 1 290 1 291 1 294 ..
Othe
r
7 655 14 322 14 302 10 755 13 366 12 962 12 121 ..
Transport 39 577 48 995 51 774 72 399 82 421 78 957 76 529 ..
Motor gasolin
e
19 599 24 371 25 432 32 799 43 429 42 270 42 350 ..
Gas/diesel oil 11 939 15 237 16 999 27 970 25 134 23 538 22 023 ..
Subtotal 31 538 39 608 42 431 60 769 68 563 65 808 64 373 ..
Aviation fuels 2 975 3 485 3 599 6 521 9 295 8 838 8 008 ..
Othe
r
5 064 5 902 5 744 5 109 4 563 4 311 4 148 ..
Industry 93 518 79 040 65 831 68 463 65 737 57 667 61 888 ..
Naphtha 23 225 22 001 14 812 23 643 31 441 26 251 29 646 ..
LPG + ethane 5 542 6 433 6 844 6 668 6 233 5 123 6 164 ..
Gas/diesel oil 8 938 8 883 8 157 9 970 8 516 7 260 7 361 ..
Fuel oil 44 013 30 104 23 020 11 632 4 550 4 734 4 259 ..
Othe
r
11 800 11 619 12 998 16 550 14 997 14 299 14 458 ..
Other 34 830 38 217 35 319 41 554 37 515 34 663 32 245 ..
Gas/diesel oil 8 409 10 308 10 261 15 580 14 031 12 393 11 005 ..
Fuel oil 5 496 2 941 2 440 1 284 469 365 286 ..
Othe
r
20 925 24 968 22 618 24 690 23 015 21 905 20 954 ..
Memo: Non-energy use 36 000 36 557 31 368 34 845 45 479 40 404 42 505 ..
Chem/petchem. feedst. 26 800 25 408 19 134 23 265 33 258 28 573 31 739 ..
Other 9 200 11 149 12 234 11 580 12 221 11 831 10 766 ..
1. Includes inputs from other sources.
Source: Annual Oil Statistics.
INTERNATIONAL ENERGY AGENCY

OIL INFORMATION (2011 Edition) - III.331
JAPAN
Table 2: Supply of crude oil, NGL, feedstocks and other hydrocarbons
000 metric tons
1973 1978 1980 1990 2007 2008 2009 2010e
CRUDE OIL
Indigenous productio
n
- 539 430 359 286 291 265 250
+ Imports - 228 247 214 510 197 535 199 873 190 726 169 199 170 440
- Exports - - ---- - -
- Direct use - 18 966 11 848 18 713 9 783 6 847 3 136 4 301
+ Stock change - -3 187 -4 076 -4 279 522 192 1 566 953
- Statistical differences - -4 478 1 038 5 003 -1 198 2 450 271 926
Refinery intake - 211 111 197 978 169 899 192 096 181 912 167 623 166 416
Closing stock level - 30 528 37 889 53 968 59 749 59 557 57 991 57 038
NATURAL GAS LIQUIDS
Indigenous productio
n
- 26 21 167 461 452 434 399
+ Imports - 2 308 4 250 5 323 6 503 8 104 9 843 9 992
- Exports - - ---- - -
- Direct use - 2 222 2 802 503 327 324 413 416
+ Stock change - - ---- - -
- Statistical differences - - - - - - - -
Refinery intake - 112 1 469 4 987 6 637 8 232 9 864 9 975
Closing stock level - - - - - - - -
REFINERY FEEDSTOCKS
Backflows - 2 479 3 619 1 485 5 081 5 249 4 258 3 789
+ Transfers - 1 977 ---- - -
+ Imports - - ---- - -
- Exports - - ---- - -
+ Stock change - 874 - 701 1 242 702 65 737 - 398
- Statistical differences - 874 -1 221 - - - - -
Refinery intake - 4 456 4 139 2 727 5 783 5 314 4 995 3 391
Closing stock level - 7 738 9 264 8 965 8 213 8 148 7 411 7 809
OTHER HYDROCARBONS
Indigenous productio
n
- 76 91 128 - - - -
+ Imports - - ---- - -
- Exports - - ---- - -
- Direct use - - ---- - -
+ Stock change - - ---- - -
- Statistical differences - - - - - - - -
Refinery intake - 76 91 128 - - - -
Closing stock level - - - - - - - -
CRUDE OIL, NGL, FEEDSTOCKS AND OTHER
Indigenous productio
n
792 641 542 654 747 743 699 649
+ Backflows - 2 479 3 619 1 485 5 081 5 249 4 258 3 789
+ Transfers - 1 977 ---- - -
+ Imports 245 094 230 555 218 760 202 858 206 376 198 830 179 042 180 432
- Exports - - ---- - -
- Direct use 20 966 21 188 14 650 19 216 10 110 7 171 3 549 4 717
+ Stock change -3 522 -2 313 -4 777 -3 037 1 224 257 2 303 555
- Statistical differences -3 522 -3 604 - 183 5 003 -1 198 2 450 271 926
Refinery intake 224 920 215 755 203 677 177 741 204 516 195 458 182 482 179 782
Closing stock level 25 867 38 266 47 153 62 933 67 962 67 705 65 402 64 847
Source: Annual Oil Statistics.
INTERNATIONAL ENERGY AGENCY

III.332 - OIL INFORMATION (2011 Edition)
JAPAN
Table 3: Motor gasoline - supply
000 metric tons
1973 1978 1980 1990 2007 2008 2009 2010e
MOTOR GASOLINE
Refinery output 19 813 24 604 25 149 31 515 42 744 41 852 42 186 43 077
+ Imports 9 - - 1 567 620 480 628 799
- Exports 65 - - 35 395 523 1 143 1 619
+ Transfers - - - - 19 - 1 - - -
+ Stock change 27 - 183 233 - 219 - 196 56 255 59
- Statistical differences 185 50 - 50 10 - 657 - 405 - 424 - 535
Total consumption 19 599 24 371 25 432 32 799 43 429 42 270 42 350 42 851
Closing stock level - 1 846 1 579 1 851 1 848 1 792 1 537 1 478
Table 4: Aviation fuels - supply
000 metric tons
1973 1978 1980 1990 2007 2008 2009 2010e
AVIATION GASOLINE
Refinery output 40 20 14 4 3 2 2 2
+ Imports - - ---- - -
- Exports - - ---- - -
+ Transfers - - ---- - -
+ Stock change - - - 1 - - - - -
- Statistical differences - 12 - - - - - -
Total consumption 40 8 13 4 3 2 2 2
Closing stock level - 3 2 - - - - -
GASOLINE TYPE JET FUEL
Refinery output - - - - - - - -
+ Imports - - ---- - -
- Exports - - ---- - -
+ Transfers - - ---- - -
+ Stock change - - ---- - -
- Statistical differences - - - - - - - -
Total consumption - - - - - - - -
Closing stock level - - - - - - - -
KEROSENE TYPE JET FUEL
Refinery output 3 244 3 249 3 597 3 686 11 663 12 416 10 623 10 981
+ Imports 525 277 310 3 483 508 506 337 298
- Exports - - - 2 1 940 2 942 1 967 2 088
+ Transfers - - - - 23 34 - 32 17 17
+ Stock change - 4 - 38 - 9 60 186 - 65 - 19 53
- Statistical differences 830 11 312 47 - 32 - 145 - 49 81
Total consumption 2 935 3 477 3 586 7 157 10 483 10 028 9 040 9 180
Closing stock level - 354 358 293 520 585 604 551
Source: Annual Oil Statistics.
INTERNATIONAL ENERGY AGENCY

OIL INFORMATION (2011 Edition) - III.333
JAPAN
Table 5A: Gas/diesel oil - supply and consumption
000 metric tons
1973 1978 1980 1990 2007 2008 2009 2010e
Refinery output 30 321 34 481 35 774 50 614 55 301 54 572 50 048 50 152
+ Recycled products - - - - - - - -
+ Imports 2 367 1 537 1 275 5 604 245 352 325 471
- Exports 31 197 103 1 088 7 642 11 343 10 014 10 128
- Intl. marine bunkers 1 369 966 720 380 239 134 109 81
+ Transfers - - - 174 223 235 275 275
+ Stock changes - 804 513 106 - 304 - 49 - 210 334 41
- Statistical differences 510 201 280 - 111 - 492 - 281 - 107 - 72
Total consumption 29 974 35 167 36 052 54 731 48 331 43 753 40 966 40 802
Transformation 688 739 635 1 143 539 453 466 ..
Main activity producer electricity 688 739 635 557 313 298 319 ..
Autoproducer electricity - - - 586 226 155 147 ..
Main activity producer CHP - - - - - - - ..
Autoproducer CHP - - - - - - - ..
Main activity producer heat - - - - - - - ..
Autoproducer heat - - - - - - - ..
Petrochemical industry - - - - - - - ..
Other transformation - - - - - - - ..
Energy industry own use - - - 68 111 109 111 ..
Refinery fuel - - - 37 68 64 66 ..
Other energy industry - - - 31 43 45 45 ..
Final consumption 29 286 34 428 35 417 53 520 47 681 43 191 40 389 ..
Transport
11 939 15 237 16 999 27 970 25 134 23 538 22 023 ..
Aviation - - - - - - - ..
Road 9 136 12 266 14 138 26 207 23 824 22 295 20 848 ..
Rail 996 913 891 300 202 202 202 ..
Domestic navigation 1 807 2 058 1 970 1 463 1 108 1 041 973 ..
Non-specified - - - - - - - ..
Industry
8 938 8 883 8 157 9 970 8 516 7 260 7 361 ..
Iron and steel 820 785 715 554 351 295 239 ..
Chemical (incl. pet.-chem.) 537 812 805 372 367 254 341 ..
Non-ferrous metals 326 430 425 125 125 104 77 ..
Non-metallic minerals 523 818 728 358 131 94 98 ..
Transport equipment - - - - - - - ..
Machinery - - - 1 274 295 233 190 ..
Mining and quarrying 45 71 89 140 88 94 95 ..
Food and tobacco 765 1 039 981 1 673 1 252 1 017 1 003 ..
Pulp, paper and printing 200 228 220 252 86 75 63 ..
Wood and wood products - - - - - - - ..
Construction 2 449 2 677 2 790 3 099 2 858 2 795 2 842 ..
Textiles and leather 262 336 305 - - - - ..
Non-specified 3 011 1 687 1 099 2 123 2 963 2 299 2 413 ..
Other
8 409 10 308 10 261 15 580 14 031 12 393 11 005 ..
Commerce and public - - - 10 824 10 835 9 613 8 134 ..
Residential - - - - - - - ..
Agriculture (incl. fishing) 998 1 541 1 721 4 756 3 196 2 780 2 871 ..
Non-specified 7 411 8 767 8 540 - - - - ..
Memo: Non-energy use - - - 8 234 154 244 ..
Chem/petchem. feedst. - - - 7 234 154 244 ..
Other - - - 1 - - - ..
Closing stock level - 2 874 3 665 3 438 2 335 2 545 2 211 2 170
Source: Annual Oil Statistics.
INTERNATIONAL ENERGY AGENCY

III.334 - OIL INFORMATION (2011 Edition)
JAPAN
Table 5B: Fuel oil (residual) - supply and consumption
000 metric tons
1973 1978 1980 1990 2007 2008 2009 2010e
Refinery output 109 328 92 645 81 175 40 315 29 545 26 868 21 905 21 364
+ Recycled products - - - - - - - -
+ Imports 12 177 9 265 8 994 9 495 4 116 4 169 2 146 3 163
- Exports 2 455 5 5 1 467 2 847 3 305 2 623 2 444
- Intl. marine bunkers 15 921 11 646 11 205 5 028 5 431 5 059 4 509 4 492
+ Transfers - -1 977 - 68 51 56 70 70
+ Stock changes - 180 381 - 633 - 192 - 17 308 - 80 40
- Statistical differences -2 646 -2 263 - 604 - 47 436 455 140 153
Total consumption 105 595 90 926 78 930 43 238 24 981 22 582 16 769 17 548
Transformation 46 838 49 086 45 121 25 541 15 184 13 098 8 100 ..
Main activity producer electricity 46 838 36 486 34 021 20 663 13 037 11 515 6 801 ..
Autoproducer electricity - 12 600 11 100 4 862 2 138 1 576 1 294 ..
Main activity producer CHP - - - - - - - ..
Autoproducer CHP - - - - - - - ..
Main activity producer heat - - - 16 9 7 5 ..
Autoproducer heat - - - - - - - ..
Petrochemical industry - - - - - - - ..
Other transformation - - - - - - - ..
Energy industry own use 6 088 4 765 4 321 2 134 2 229 2 030 1 903 ..
Refinery fuel 6 088 4 765 4 321 1 984 2 143 1 955 1 828 ..
Other energy industry - - - 150 86 75 75 ..
Final consumption 52 669 37 075 29 488 15 563 7 568 7 454 6 766 ..
Transport
3 160 4 030 4 028 2 647 2 549 2 355 2 221 ..
Aviation - - - - - - - ..
Road 48 39 62 - - - - ..
Rail 449 375 359 - - - - ..
Domestic navigation 2 556 3 468 3 539 2 647 2 549 2 355 2 221 ..
Non-specified 107 148 68 - - - - ..
Industry
44 013 30 104 23 020 11 632 4 550 4 734 4 259 ..
Iron and steel 11 010 5 621 3 811 1 055 442 508 413 ..
Chemical (incl. pet.-chem.) 8 026 5 211 4 508 2 443 1 712 1 714 1 483 ..
Non-ferrous metals 1 130 521 780 424 96 110 119 ..
Non-metallic minerals 9 929 8 745 5 773 1 608 682 844 838 ..
Transport equipment - - - - - - - ..
Machinery - - - 1 080 15 12 10 ..
Mining and quarrying 243 170 158 39 17 19 19 ..
Food and tobacco 2 503 1 989 1 938 1 267 454 581 610 ..
Pulp, paper and printing 3 726 2 383 2 161 2 630 1 107 927 753 ..
Wood and wood products - - - - - - - ..
Construction 463 122 93 91 25 19 14 ..
Textiles and leather 4 761 4 377 3 084 - - - - ..
Non-specified 2 222 965 714 995 - - - ..
Other
5 496 2 941 2 440 1 284 469 365 286 ..
Commerce and public 5 300 2 621 2 151 268 271 218 184 ..
Residential - - - - - - - ..
Agriculture (incl. fishing) 196 320 289 1 016 198 147 102 ..
Non-specified - - - - - - - ..
Memo: Non-energy use - - - 367 469 492 361 ..
Chem/petchem. feedst. - - - 367 469 492 361 ..
Other - - - - - - - ..
Closing stock level - 4 442 4 972 2 311 1 697 1 389 1 469 1 429
Source: Annual Oil Statistics.
INTERNATIONAL ENERGY AGENCY

OIL INFORMATION (2011 Edition) - III.335
JAPAN
Table 5C: Total products - supply and consumption
000 metric tons
1973 1978 1980 1990 2007 2008 2009 2010e
Refinery output 222 333 213 895 200 694 176 960 197 816 189 113 179 049 178 667
+ Recycled products - - - - - - - -
+ Imports 26 609 28 508 28 408 57 618 43 112 40 968 39 511 43 443
- Exports 3 028 718 487 3 659 14 259 19 358 16 934 17 224
- Intl. marine bunkers 17 350 12 657 11 981 5 449 5 706 5 214 4 634 4 597
+ Transfers 20 966 19 211 14 650 19 216 10 110 7 171 3 549 4 717
+ Stock changes -1 951 1 590 - 209 - 441 - 250 - 316 1 495 102
- Statistical differences -2 752 -5 250 109 -2 871 -1 016 847 1 308 2 018
Total consumption 250 331 255 079 230 966 247 116 231 839 211 517 200 728 203 090
Transformation 72 001 78 447 68 172 54 792 34 337 29 476 19 462 ..
Main activity producer electricity 69 426 60 628 50 400 41 323 23 478 19 270 10 554 ..
Autoproducer electricity - 12 600 11 100 7 607 3 939 3 124 2 804 ..
Main activity producer CHP - - - - - - - ..
Autoproducer CHP - - - - - - - ..
Main activity producer heat - - - 57 10 9 7 ..
Autoproducer heat - - - - - - - ..
Petrochemical industry - 2 479 3 619 1 485 5 081 5 249 4 258 ..
Other transformation 2 575 2 740 3 053 4 320 1 829 1 824 1 839 ..
Energy industry own use 10 405 10 380 9 870 9 908 11 829 10 754 10 604 ..
Refinery fuel 10 405 10 380 9 870 9 704 11 209 10 631 10 481 ..
Other energy industry - - - 204 620 123 123 ..
Final consumption 167 925 166 252 152 924 182 416 185 673 171 287 170 662 ..
Transport
39 577 48 995 51 774 72 399 82 421 78 957 76 529 ..
Aviation 2 975 3 485 3 599 6 521 9 295 8 838 8 008 ..
Road 30 473 38 383 41 192 61 369 69 136 66 390 64 994 ..
Rail 1 470 1 303 1 264 307 206 206 206 ..
Domestic navigation 4 532 5 664 5 640 4 202 3 784 3 523 3 321 ..
Non-specified 127 160 79 - - - - ..
Industry
93 518 79 040 65 831 68 463 65 737 57 667 61 888 ..
Iron and steel 11 830 6 423 4 984 2 493 1 770 1 698 1 542 ..
Chemical (incl. pet.-chem.) 35 456 31 504 24 515 32 751 43 020 36 589 41 020 ..
Non-ferrous metals 1 456 951 1 205 908 363 329 304 ..
Non-metallic minerals 10 452 9 563 6 501 2 815 2 126 2 095 2 177 ..
Transport equipment - - - - - - - ..
Machinery - - - 3 528 946 835 789 ..
Mining and quarrying 353 284 297 215 133 142 145 ..
Food and tobacco 3 268 3 028 2 919 3 531 2 080 1 936 1 934 ..
Pulp, paper and printing 3 926 2 611 2 381 3 114 1 296 1 106 904 ..
Wood and wood products - - - - - - - ..
Construction 8 630 8 363 8 242 10 129 6 013 5 430 5 511 ..
Textiles and leather 5 023 4 713 3 389 - - - - ..
Non-specified 13 124 11 600 11 398 8 979 7 990 7 507 7 562 ..
Other
34 830 38 217 35 319 41 554 37 515 34 663 32 245 ..
Commerce and public 15 688 15 406 13 628 22 250 20 138 18 823 16 797 ..
Residential 8 330 10 251 9 202 12 673 13 436 12 401 11 969 ..
Agriculture (incl. fishing) 2 621 3 192 3 327 6 631 3 941 3 439 3 479 ..
Non-specified 8 191 9 368 9 162 - - - - ..
Memo: Non-energy use 36 000 36 557 31 368 34 845 45 479 40 404 42 505 ..
Chem/petchem. feedst. 26 800 25 408 19 134 23 265 33 258 28 573 31 739 ..
Other 9 200 11 149 12 234 11 580 12 221 11 831 10 766 ..
Closing stock level - 16 906 19 184 15 088 12 778 13 094 11 599 11 497
Source: Annual Oil Statistics.
INTERNATIONAL ENERGY AGENCY

III.336 - OIL INFORMATION (2011 Edition)
JAPAN
Table 6A: Supply and consumption
000 metric tons
1990 2008 2009 2010e 1990 2008 2009 2010e
LPG AND ETHANE REFINERY GAS
Refinery output 4 480 4 096 4 524 4 225 7 708 7 293 7 420 7 650
+ Recycled products - - - - - - - -
+ Imports 14 578 13 217 11 799 12 631 - - - -
- Exports 9 36 18 17 - - - -
- Intl. marine bunkers - - - - - - - -
+ Transfers - - 242 - 191 - 191 9 50 23 23
+ Stock change 10 - 68 440 - 64 - - - -
- Statistical difference 16 886 646 1 452 - 6 143 211 223
Total consumption 19 043 16 081 15 908 15 132 7 723 7 200 7 232 7 450
of which: ethane - - - - - - - -
Transformation 4 475 3 276 2 754 .. 300 124 102 ..
Energy industry own use 59 186 199 .. 7 423 7 076 7 130 ..
Transport 1 559 1 199 1 170 .. - - - ..
Industry 6 668 5 123 6 164 .. - - - ..
Other 6 282 6 297 5 621 .. - - - ..
Memo: Non-energy use 3 797 4 733 5 446 .. - - - ..
Closing stock level 2 821 2 825 2 385 2 449 - - - -
NAPHTHA OTHER KEROSENE
Refinery output 8 563 15 112 15 767 14 774 19 313 16 562 16 479 15 992
+ Recycled products - - - - - - - -
+ Imports 15 538 17 030 19 042 20 030 3 089 409 373 856
- Exports 337 27 - - 405 406 290 160
- Intl. marine bunkers - - - - 4 9 - -
+ Transfers 96 310 266 266 - 321 - 325 - 343 - 343
+ Stock change - 35 - 290 294 - 71 233 69 137 45
- Statistical difference -1 059 1 916 2 550 2 534 103 - 255 - 25 - 202
Total consumption 24 884 30 219 32 819 32 465 21 802 16 555 16 381 16 592
Transformation 1 134 3 927 3 144 .. 375 48 22 ..
Energy industry own use 107 41 29 .. 7 32 30 ..
Transport - - - .. - - - ..
Industry 23 643 26 251 29 646 .. 3 681 1 799 1 739 ..
Other - - - .. 17 739 14 676 14 590 ..
Memo: Non-energy use 19 264 26 753 28 185 .. 672 720 724 ..
Closing stock level 1 315 1 613 1 319 1 390 2 136 1 490 1 353 1 308
WHITE SPIRIT + SBP LUBRICANTS
Refinery output 155 104 77 .. 2 268 2 110 2 169 ..
+ Recycled products - - - .. - - - ..
+ Imports - - - .. 120 61 89 ..
- Exports - - - .. 185 449 667 ..
- Intl. marine bunkers - - - .. 37 12 16 ..
+ Transfers - - - .. 59 22 - 9 ..
+ Stock change 8 - 6 5 .. - 27 - 47 45 ..
- Statistical difference - 3 - 6 6 .. 5 - 146 - 220 ..
Total consumption 166 104 76 .. 2 193 1 831 1 831 ..
Transformation - - - .. - - - ..
Energy industry own use - - - .. 21 60 60 ..
Transport - - - .. 903 757 757 ..
Industry 166 104 76 .. 1 178 977 977 ..
Other - - - .. 91 37 37 ..
Memo: Non-energy use 79 54 34 .. 2 107 1 734 1 734 ..
Closing stock level 13 17 12 .. 439 349 304 ..
Source: Annual Oil Statistics.
INTERNATIONAL ENERGY AGENCY

OIL INFORMATION (2011 Edition) - III.337
JAPAN
Table 6B: Supply and consumption
000 metric tons
1990 2008 2009 2010e 1990 2008 2009 2010e
BITUMEN PARAFFIN WAXES
Refinery output 6 277 4 694 4 608 .. 139 83 141 ..
+ Recycled products - - - .. - - - ..
+ Imports 1 94 106 .. - 11 11 ..
- Exports 7 180 101 .. 51 39 46 ..
- Intl. marine bunkers - - - .. - - - ..
+ Transfers - 43 - 77 - 95 .. - - - 16 ..
+ Stock change - 34 - 28 20 .. - 2 - 1 7 ..
- Statistical difference -1 657 -1 469 -1 391 .. - 4 3 18 ..
Total consumption 7 851 5 972 5 929 .. 90 51 79 ..
Transformation 918 625 608 .. - - - ..
Energy industry own use 13 972 913 .. 2 - - ..
Transport - - - .. - - - ..
Industry 6 920 4 375 4 408 .. 88 51 79 ..
Other - - - .. - - - ..
Memo: Non-energy use 5 999 2 445 2 477 .. 88 51 79 ..
Closing stock level 310 247 227 .. 21 15 8 ..
PETROLEUM COKE OTHER PRODUCTS
Refinery output 320 915 876 1 167 1 603 2 434 2 224 9 283
+ Recycled products - - - - - - - -
+ Imports 4 141 4 638 4 654 5 018 2 1 1 177
- Exports 73 108 65 35 - - - 733
- Intl. marine bunkers - - - - - - - 24
+ Transfers - - - - 19 216 7 174 3 552 4 600
+ Stock change - 3 1 2 6 64 - 35 55 - 7
- Statistical difference - 89 220 17 15 - 76 - 69 - 64 -1 631
Total Consumption 4 474 5 226 5 450 6 141 20 961 9 643 5 896 14 927
Transformation 1 806 1 102 1 123 .. 19 100 6 823 3 143 ..
Energy industry own use 6 189 171 .. 68 59 58 ..
Transport - - - .. - - - ..
Industry 2 662 3 935 4 156 .. 1 793 2 761 2 695 ..
Other - - - .. - - - ..
Memo: Non-energy use 671 529 544 .. 1 793 2 739 2 677 ..
Closing stock level 18 19 17 11 122 208 153 711
Source: Annual Oil Statistics.
INTERNATIONAL ENERGY AGENCY

III.338 - OIL INFORMATION (2011 Edition)
JAPAN
Table 7A: Imports by country of origin
000 metric tons
2008 2009 2010e 2008 2009 2010e 2008 2009 2010e
Crude oil Natural gas liquids Feedstocks and other
Australia 1 769 1 412 1 497 441 182 74 - - -
Bel
g
ium - - - - - - - - -
Canada - - - - - - - - -
Czech Re
p
ubli
c
- - - - - - - - -
Denmark - - - - - - - - -
Finland - - - - - - - - -
France - - - - - - - - -
German
y
- - - - - - - - -
Greece - - - - - - - - -
Hun
g
ar
y
- - - - - - - - -
Ireland - - - - - - - - -
Ital
y
- - - - - - - - -
Ja
p
an - - - - - - - - -
Korea - 125 239 - - - - - -
Mexic
o
- - - - - - - - -
Netherlands - - - - - - - - -
New Zealand - - - - - - - - -
Norwa
y
- - 54 - 71 - - - -
Poland - - - - - - - - -
S
p
ain - - - - - - - - -
Sweden - - - - - - - - -
Turke
y
- - - - - - - - -
United Kin
g
dom - - - - - - - - -
United States - - - - - - - - -
Othe
r
- - - - - - - - -
OECD 1 769 1 537 1 790 441 253 74 - - -
Ar
g
entina - - - - - - - - -
Brazil - - 128 - - - - - -
Colombia - - - - - - - - -
Ecuado
r
- - 385 - - - - - -
Netherlands Antilles - - - - - - - - -
Peru - - - - - - - - -
Trinidad and Toba
go
- - - - - - - - -
Venezuela - - - - - - - - -
Othe
r
- - - - - - - - -
Latin America - - 513 - - - - - -
Kazakhstan - - - - - - - - -
Russian Federation 7 357 8 211 12 907 93 18 53 - - -
Other - 259 60 - - - - - -
Non-OECD Europe/Eurasia
7 357 8 470 12 967 93 18 53 - - -
Iran 20 993 16 988 14 980 2 356 2 240 2 447 - - -
Ira
q
2 635 4 089 5 974 - - - - - -
Kuwai
t
18 492 15 736 12 771 - - - - - -
Oman 4 322 6 179 4 933 - - - - - -
Qata
r
16 474 13 925 13 579 4 689 6 689 6 748 - - -
Saudi Arabia 58 033 54 813 52 063 229 260 159 - - -
United Arab Emirates 45 757 38 575 37 971 - 46 255 - - -
Othe
r
598 674 4 148 - - - - - -
Middle East 167 304 150 979 146 419 7 274 9 235 9 609 - - -
India - - - - - - - - -
Indonesi
a
5 213 3 363 4 159 230 186 183 - - -
Sin
g
a
p
ore - - - - - - - - -
Othe
r
3 649 1 888 1 932 66 44 73 - - -
Asia 8 862 5 251 6 091 296 230 256 - - -
China 473 207 105 - - - - - -
Al
g
eria 136 458 251 - - - - - -
An
g
ola 27 180 - - - - - - -
Cameroon - - - - - - - - -
E
gypt
- - - - - - - - -
Gabon 367 5 - - - - - - -
Lib
y
an Arab Jamahiri
y
a - - - - - - - - -
Ni
g
eria - 143 136 - 107 - - - -
Tunisia - - - - - - - - -
Othe
r
4 431 1 969 2 168 - - - - - -
Africa 4 961 2 755 2 555 - 107 - - - -
Non-spec./other - - - - - - - - -
Total imports 190 726 169 199 170 440 8 104 9 843 9 992 - - -
Memo: Total OPEC 162 547 144 907 138 110 7 274 9 342 9 609 - - -
Source: Annual Oil Statistics.
INTERNATIONAL ENERGY AGENCY