IEA Statistics. Oil Information 2011
Подождите немного. Документ загружается.

III.78 - OIL INFORMATION (2011 Edition)
A
USTRALI
A
* Excluding electricity trade.
** Includes hydro, geothermal, solar, wind, combustible renewables and waste, etc.
Source: Annual Energy Balances.
0
5
10
15
20
25
30
35
40
45
50
Coal Oil Gas Nuclear Other **
Percentage
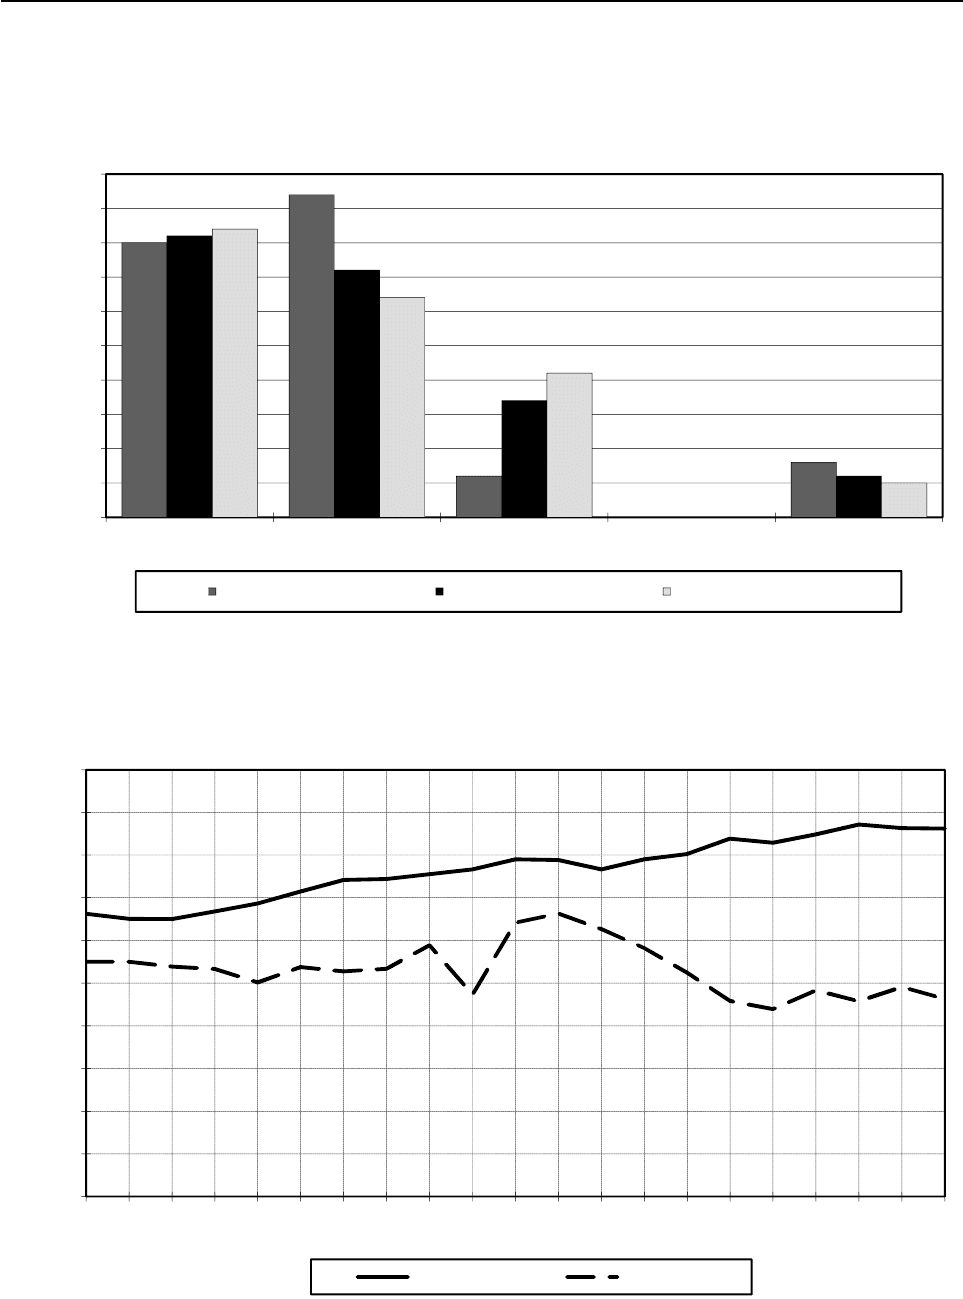
Figure 1. Fuel shares of TPES *
1973 TPES = 57 Mtoe 1990 TPES = 86 Mtoe 2010e TPES = 126 Mtoe
50
Figure 2. Oil production and consumption
*** Includes refinery fuel and international marine bunkers.
Source: Annual Oil Statistics.
0
5
10
15
20
25
30
35
40
45
50
1990
1991
1992
1993
1994
1995
1996
1997
1998
1999
2000
2001
2002
2003
2004
2005
2006
2007
2008
2009
2010e
Million Metric Tons
Fi
gure
2
.
Oil
pro
d
uc
ti
on an
d
consump
ti
on
Consumption *** Production
INTERNATIONAL ENERGY AGENCY

OIL INFORMATION (2011 Edition) - III.79
AUSTRALIA
Table 1: Oil supply and consumption - summary table
000 metric tons
1973 1978 1980 1990 2007 2008 2009 2010e
Indigenous production
1
19 182 21 891 20 564 27 493 24 159 22 877 24 548 23 126
Crude oil - 20 053 18 868 25 465 21 559 20 506 22 058 20 556
NGL - 1 838 1 696 2 028 2 445 2 136 2 148 2 207
Othe
r
- - - - 155 235 342 363
+ Net imports 9 052 10 129 11 136 5 283 15 465 19 380 19 153 20 682
Crude oil, NGL, othe
r
8 657 10 244 10 098 4 327 6 043 6 728 4 891 6 075
Oil products 395 - 115 1 038 956 9 422 12 652 14 262 14 607
- Intl. marine bunkers 1 828 1 440 1 135 660 821 937 811 721
+ Stock changes - 49 889 - 490 - 785 - 309 308 - 222 - 308
TOTAL SUPPLY 26 357 31 469 30 075 31 331 38 494 41 628 42 668 42 779
Refinery intake 26 920 29 441 29 328 29 571 32 348 31 498 31 777 30 989
Refinery output 25 251 30 065 28 933 30 758 30 981 31 453 31 396 30 095
LPG + ethane 371 349 335 521 727 799 771 632
Naphtha 550 280 180 217 211 380 254 159
Kerosenes 2 303 2 947 2 294 2 858 4 309 4 205 4 428 4 284
Gasolines 8 815 10 242 10 861 12 128 13 077 12 625 12 644 12 412
Gas/diesel oil 5 866 6 988 7 283 8 700 9 270 10 201 10 248 9 807
Fuel oil 5 010 4 726 4 150 2 440 952 984 890 859
Other products 2 336 4 533 3 830 3 894 2 435 2 259 2 161 1 942
- Refinery losse
s
1 669 - 624 395 -1 187 1 367 45 381 894
+ Returns - - - 310 4 181 4 545 5 345 4 429
- Statistical differences - 334 1 433 - 647 368 - 301 3 471 5 287 3 924
TOTAL CONSUMPTION 25 022 30 660 30 327 32 460 41 609 42 657 42 345 42 390
Transformation and energy 1 079 4 312 3 619 3 220 2 875 2 935 2 808 ..
Crude oil - 2 - 6 89 89 106 ..
LPG + ethane 50 49 56 32 82 79 77 ..
Gas/diesel oil 170 828 620 834 1 137 1 289 1 339 ..
Fuel oil 634 1 080 986 492 247 247 207 ..
Petroleum coke - - - 419 520 472 473 ..
Othe
r
225 2 353 1 957 1 437 800 759 606 ..
Transport 12 703 15 835 16 655 21 177 28 919 29 638 29 549 ..
Motor gasolin
e
8 894 10 674 10 915 12 943 14 014 13 950 13 648 ..
Gas/diesel oil 1 620 2 692 3 200 5 043 8 783 9 463 9 590 ..
Subtotal 10 514 13 366 14 115 17 986 22 797 23 413 23 238 ..
Aviation fuels 1 299 1 676 1 719 2 346 4 692 4 875 4 965 ..
Othe
r
890 793 821 845 1 430 1 350 1 346 ..
Industry 7 852 8 045 7 874 6 390 7 079 7 301 7 126 ..
Naphtha 350 328 342 339 17 17 17 ..
LPG + ethane 117 216 235 810 854 821 797 ..
Gas/diesel oil 1 111 1 873 1 676 1 509 2 511 2 640 2 533 ..
Fuel oil 4 136 3 529 3 403 1 061 790 857 885 ..
Othe
r
2 138 2 099 2 218 2 671 2 907 2 966 2 894 ..
Other 3 388 2 468 2 179 1 673 2 736 2 783 2 862 ..
Gas/diesel oil 2 284 1 293 1 318 1 165 2 273 2 293 2 341 ..
Fuel oil 110 76 53 21 3 3 3 ..
Othe
r
994 1 099 808 487 460 487 518 ..
Memo: Non-energy use 2 397 2 414 2 623 3 591 3 464 e 3 467 3 362 ..
Chem/petchem. feedst. 1 283 1 122 1 261 1 806 1 210 1 172 1 120 ..
Other 1 114 1 292 1 362 1 785 2 254 e 2 295 2 242 ..
1. Includes inputs from other sources.
Source: Annual Oil Statistics.
INTERNATIONAL ENERGY AGENCY

III.80 - OIL INFORMATION (2011 Edition)
AUSTRALIA
Table 2: Supply of crude oil, NGL, feedstocks and other hydrocarbons
000 metric tons
1973 1978 1980 1990 2007 2008 2009 2010e
CRUDE OIL
Indigenous productio
n
- 20 053 18 868 25 465 21 559 20 506 22 058 20 556
+ Imports - 9 612 9 403 6 039 19 652 20 271 19 047 21 344
- Exports - - - 5 348 11 698 11 655 12 502 13 541
- Direct use - 2 - 6 126 127 143 130
+ Stock change - - 75 - 23 - 529 - 161 33 59 - 239
- Statistical differences - 781 - 171 - 919 22 1 544 1 536 861
Refinery intake - 28 807 28 419 26 540 29 204 27 484 26 983 27 129
Closing stock level - 903 960 1 686 2 058 2 025 1 966 2 205
NATURAL GAS LIQUIDS
Indigenous productio
n
- 1 838 1 696 2 028 2 445 2 136 2 148 2 207
+ Imports - - ---- - -
- Exports - - - - 1 533 1 409 1 358 1 500
- Direct use - 1 838 1 696 2 028 912 727 790 707
+ Stock change - - - - - - 26 14 - 21
- Statistical differences - - - - - - 26 14 - 21
Refinery intake - - - - - - - -
Closing stock level - - - - 165 191 177 198
REFINERY FEEDSTOCKS
Backflows - - ---- - -
+ Transfers - - - - 3 639 4 326 5 124 4 229
+ Imports - 632 695 3 862 695 664 456 526
- Exports - - - 226 1 073 1 143 752 754
+ Stock change - - - 33 239 - 117 167 - 34 - 160
- Statistical differences - - 2 - 247 844 - - - -
Refinery intake - 634 909 3 031 3 144 4 014 4 794 3 841
Closing stock level - 392 425 551 576 409 443 603
OTHER HYDROCARBONS
Indigenous productio
n
- - - - 155 235 342 363
+ Imports - - ---- - -
- Exports - - ---- - -
- Direct use - - - - 155 235 342 344
+ Stock change - - ---- - -
- Statistical differences - - - - - - - -
Refinery intake - - - - - - - 19
Closing stock level - - - - - - - -
CRUDE OIL, NGL, FEEDSTOCKS AND OTHER
Indigenous productio
n
19 182 21 891 20 564 27 493 24 159 22 877 24 548 23 126
+ Backflows - - ---- - -
+ Transfers - - - - 3 639 4 326 5 124 4 229
+ Imports 8 675 10 244 10 098 9 901 20 347 20 935 19 503 21 870
- Exports 18 - - 5 574 14 304 14 207 14 612 15 795
- Direct use 1 042 1 840 1 696 2 034 1 193 1 089 1 275 1 181
+ Stock change - - 75 - 56 - 290 - 278 174 39 - 420
- Statistical differences - 123 779 - 418 - 75 22 1 518 1 550 840
Refinery intake 26 920 29 441 29 328 29 571 32 348 31 498 31 777 30 989
Closing stock level 1 220 1 295 1 385 2 237 2 799 2 625 2 586 3 006
Source: Annual Oil Statistics.
INTERNATIONAL ENERGY AGENCY

OIL INFORMATION (2011 Edition) - III.81
AUSTRALIA
Table 3: Motor gasoline - supply
000 metric tons
1973 1978 1980 1990 2007 2008 2009 2010e
MOTOR GASOLINE
Refinery output 8 787 10 203 10 795 11 969 12 992 12 541 12 570 12 339
+ Imports 409 465 359 1 166 2 128 2 581 2 987 2 851
- Exports 303 290 229 153 564 458 178 171
+ Transfers - - - - 106 189 265 281
+ Stock change - 553 - 206 - 53 - 36 32 - 43 47
- Statistical differences - 1 257 - 196 - 14 511 832 1 828 1 600
Total consumption 8 894 10 674 10 915 12 943 14 115 14 053 13 773 13 747
Closing stock level - 710 848 891 746 714 757 710
Table 4: Aviation fuels - supply
000 metric tons
1973 1978 1980 1990 2007 2008 2009 2010e
AVIATION GASOLINE
Refinery output 28 39 66 159 85 84 74 73
+ Imports 49 50 27 6 1 - - -
- Exports 8 16 6 58 57 68 39 19
+ Transfers - - ---- - -
+ Stock change - 13 - 14 - 5 9 - 6 2 -
- Statistical differences - 5 6 - 7 11 - 25 - 52 - 32 - 3
Total consumption 74 80 80 91 63 62 69 57
Closing stock level - 25 33 36 11 17 15 15
GASOLINE TYPE JET FUEL
Refinery output - - - - - - - -
+ Imports - - ---- - -
- Exports - - ---- - -
+ Transfers - - ---- - -
+ Stock change - - ---- - -
- Statistical differences - - - - - - - -
Total consumption - - - - - - - -
Closing stock level - - - - - - - -
KEROSENE TYPE JET FUEL
Refinery output 1 373 1 756 1 747 2 611 4 238 4 121 4 370 4 254
+ Imports 79 120 140 185 829 1 462 1 604 1 748
- Exports 219 224 166 419 95 118 84 56
+ Transfers - - ---- - -
+ Stock change - 38 19 - 7 42 30 - 35 34
- Statistical differences 8 94 101 115 385 682 959 743
Total consumption 1 225 1 596 1 639 2 255 4 629 4 813 4 896 5 237
Closing stock level - 151 118 143 248 218 253 219
Source: Annual Oil Statistics.
INTERNATIONAL ENERGY AGENCY

III.82 - OIL INFORMATION (2011 Edition)
AUSTRALIA
Table 5A: Gas/diesel oil - supply and consumption
000 metric tons
1973 1978 1980 1990 2007 2008 2009 2010e
Refinery output 5 866 6 988 7 283 8 700 9 270 10 201 10 248 9 807
+ Recycled products - - - - - - - -
+ Imports 448 566 566 871 4 588 6 302 6 959 7 291
- Exports 587 751 604 619 241 389 302 153
- Intl. marine bunkers 428 209 189 123 71 65 61 63
+ Transfers - - - - 49 46 77 63
+ Stock changes - 149 - 165 - 116 65 - 78 - 197 114
- Statistical differences 114 57 77 162 -1 044 332 921 863
Total consumption 5 185 6 686 6 814 8 551 14 704 15 685 15 803 16 196
Transformation 110 724 502 563 361 499 483 ..
Main activity producer electricity 110 352 178 76 228 297 300 ..
Autoproducer electricity - 357 302 487 133 202 183 ..
Main activity producer CHP - - - - - - - ..
Autoproducer CHP - - - - - - - ..
Main activity producer heat - - - - - - - ..
Autoproducer heat - - - - - - - ..
Petrochemical industry - - - - - - - ..
Other transformation - 15 22 - - - - ..
Energy industry own use 60 104 118 271 776 790 856 ..
Refinery fuel - - - - - - - ..
Other energy industry 60 104 118 271 776 790 856 ..
Final consumption 5 015 5 858 6 194 7 717 13 567 14 396 14 464 ..
Transport
1 620 2 692 3 200 5 043 8 783 9 463 9 590 ..
Aviation - - - 1 - - - ..
Road 915 1 653 2 213 4 385 7 614 8 157 8 241 ..
Rail 455 604 615 547 616 737 760 ..
Domestic navigation 250 435 372 110 411 412 433 ..
Non-specified - - - - 142 157 156 ..
Industry
1 111 1 873 1 676 1 509 2 511 2 640 2 533 ..
Iron and steel 58 207 37 3 40 42 43 ..
Chemical (incl. pet.-chem.) - 107 121 5 105 108 97 ..
Non-ferrous metals - 76 106 56 89 299 183 ..
Non-metallic minerals - 100 72 24 36 40 37 ..
Transport equipment - 13 12 2 - - - ..
Machinery - 23 18 2 20 20 19 ..
Mining and quarrying - 395 319 487 1 695 1 604 1 639 ..
Food and tobacco - 127 100 24 23 26 25 ..
Pulp, paper and printing - 15 11 1 - - - ..
Wood and wood products - 35 36 19 13 11 11 ..
Construction - 765 833 884 489 489 478 ..
Textiles and leather - 10 11 2 1 1 1 ..
Non-specified 1 053 - - - - - - ..
Other
2 284 1 293 1 318 1 165 2 273 2 293 2 341 ..
Commerce and public - 382 339 59 497 499 509 ..
Residential - 102 89 52 29 28 26 ..
Agriculture (incl. fishing) 984 809 890 1 054 1 747 1 766 1 806 ..
Non-specified 1 300 - - - - - - ..
Memo: Non-energy use - 11 3 4 - - - ..
Chem/petchem. feedst. - 11 3 4 - - - ..
Other - - - - - - - ..
Closing stock level - 877 666 687 507 585 782 668
Source: Annual Oil Statistics.
INTERNATIONAL ENERGY AGENCY

OIL INFORMATION (2011 Edition) - III.83
AUSTRALIA
Table 5B: Fuel oil (residual) - supply and consumption
000 metric tons
1973 1978 1980 1990 2007 2008 2009 2010e
Refinery output 5 010 4 726 4 150 2 440 952 984 890 859
+ Recycled products - - - - - - - -
+ Imports 2 271 1 968 2 498 1 000 1 288 1 540 1 596 1 428
- Exports 620 237 325 561 196 243 179 97
- Intl. marine bunkers 1 400 1 231 946 537 750 872 750 658
+ Transfers - - - - - - - -
+ Stock changes - 193 - 160 - 54 65 7 - 3 67
- Statistical differences - 489 - 25 31 274 154 153 314 1 005
Total consumption 5 750 5 444 5 186 2 014 1 205 1 263 1 240 594
Transformation 314 594 676 384 172 179 147 ..
Main activity producer electricity 314 438 448 351 132 140 115 ..
Autoproducer electricity - 148 204 16 19 18 15 ..
Main activity producer CHP - - - - - - - ..
Autoproducer CHP - - - - - - - ..
Main activity producer heat - - - - - - - ..
Autoproducer heat - - - - - - - ..
Petrochemical industry - - - - - - - ..
Other transformation - 8 24 17 21 21 17 ..
Energy industry own use 320 486 310 108 75 68 60 ..
Refinery fuel 320 484 308 107 45 56 49 ..
Other energy industry - 2 2 1 30 12 11 ..
Final consumption 5 116 4 364 4 200 1 522 958 1 016 1 033 ..
Transport
870 759 744 440 165 156 145 ..
Aviation - - - - - - - ..
Road - - - - - - - ..
Rail - - - - - - - ..
Domestic navigation 870 759 744 440 165 156 145 ..
Non-specified - - - - - - - ..
Industry
4 136 3 529 3 403 1 061 790 857 885 ..
Iron and steel 1 020 364 370 5 - - - ..
Chemical (incl. pet.-chem.) 284 170 115 15 17 17 15 ..
Non-ferrous metals - 1 759 1 761 861 704 772 806 ..
Non-metallic minerals - 297 154 27 11 12 11 ..
Transport equipment - 22 10 1 - - - ..
Machinery - 33 23 - - - - ..
Mining and quarrying - 226 391 53 7 7 7 ..
Food and tobacco - 402 323 52 19 17 15 ..
Pulp, paper and printing - 156 176 22 19 19 18 ..
Wood and wood products - 30 32 18 - - - ..
Construction - 2 2 - 11 11 11 ..
Textiles and leather - 68 46 7 2 2 2 ..
Non-specified 2 832 - - - - - - ..
Other
110 76 53 21 3 3 3 ..
Commerce and public 110 76 53 21 3 3 3 ..
Residential - - - - - - - ..
Agriculture (incl. fishing) - - - - - - - ..
Non-specified - - - - - - - ..
Memo: Non-energy use - 20 2 1 - - - ..
Chem/petchem. feedst. - 20 2 1 - - - ..
Other - - - - - - - ..
Closing stock level - 1 173 1 038 425 163 156 159 92
Source: Annual Oil Statistics.
INTERNATIONAL ENERGY AGENCY

III.84 - OIL INFORMATION (2011 Edition)
AUSTRALIA
Table 5C: Total products - supply and consumption
000 metric tons
1973 1978 1980 1990 2007 2008 2009 2010e
Refinery output 25 251 30 065 28 933 30 758 30 981 31 453 31 396 30 095
+ Recycled products - - - 310 4 181 4 545 5 345 4 429
+ Imports 3 580 3 460 4 165 4 192 10 821 14 114 15 229 15 301
- Exports 3 185 3 575 3 127 3 236 1 399 1 462 967 694
- Intl. marine bunkers 1 828 1 440 1 135 660 821 937 811 721
+ Transfers 1 042 1 840 1 696 2 034 -2 446 -3 237 -3 849 -3 048
+ Stock changes - 49 964 - 434 - 495 - 31 134 - 261 112
- Statistical differences - 211 654 - 229 443 - 323 1 953 3 737 3 084
Total consumption 25 022 30 660 30 327 32 460 41 609 42 657 42 345 42 390
Transformation 674 1 407 1 263 977 552 692 641 ..
Main activity producer electricity 424 790 626 427 360 437 415 ..
Autoproducer electricity - 505 506 503 152 220 198 ..
Main activity producer CHP - - - - - - - ..
Autoproducer CHP - - - - - - - ..
Main activity producer heat - - - - - - - ..
Autoproducer heat - - - - - - - ..
Petrochemical industry - - - - - - - ..
Other transformation 250 112 131 47 40 35 28 ..
Energy industry own use 405 2 905 2 356 2 243 2 323 2 243 2 167 ..
Refinery fuel 320 2 760 2 197 1 963 1 401 1 323 1 163 ..
Other energy industry 85 145 159 280 922 920 1 004 ..
Final consumption 23 943 26 348 26 708 29 240 38 734 39 722 39 537 ..
Transport
12 703 15 835 16 655 21 177 28 919 29 638 29 549 ..
Aviation 1 299 1 676 1 719 2 347 4 692 4 875 4 965 ..
Road 9 829 12 361 13 205 17 732 22 892 23 300 23 089 ..
Rail 455 604 615 548 616 737 760 ..
Domestic navigation 1 120 1 194 1 116 550 576 568 578 ..
Non-specified - - - - 143 158 157 ..
Industry
7 852 8 045 7 874 6 390 7 079 7 301 7 126 ..
Iron and steel 1 092 586 419 22 51 54 54 ..
Chemical (incl. pet.-chem.) 1 673 1 514 1 559 1 844 1 389 1 362 1 285 ..
Non-ferrous metals - 1 984 2 034 1 477 1 630 1 946 1 789 ..
Non-metallic minerals - 423 249 120 147 163 169 ..
Transport equipment - 40 27 8 - - - ..
Machinery - 71 59 25 34 34 34 ..
Mining and quarrying - 629 713 547 1 734 1 645 1 685 ..
Food and tobacco - 555 452 138 60 61 61 ..
Pulp, paper and printing - 174 190 39 36 36 36 ..
Wood and wood products - 66 70 41 13 11 11 ..
Construction 474 1 340 1 423 1 547 1 340 1 319 1 334 ..
Textiles and leather - 82 62 21 21 19 19 ..
Non-specified 4 613 581 617 561 624 651 649 ..
Other
3 388 2 468 2 179 1 673 2 736 2 783 2 862 ..
Commerce and public 110 541 488 235 573 574 588 ..
Residential 769 1 069 754 351 282 306 305 ..
Agriculture (incl. fishing) 1 035 847 921 1 075 1 881 1 903 1 969 ..
Non-specified 1 474 11 16 12 - - - ..
Memo: Non-energy use 2 397 2 414 2 623 3 591 3 464 e 3 467 3 362 ..
Chem/petchem. feedst. 1 283 1 122 1 261 1 806 1 210 1 172 1 120 ..
Other 1 114 1 292 1 362 1 785 2 254 e 2 295 2 242 ..
Closing stock level - 3 873 3 231 3 243 2 717 2 583 2 844 2 732
Source: Annual Oil Statistics.
INTERNATIONAL ENERGY AGENCY

OIL INFORMATION (2011 Edition) - III.85
AUSTRALIA
Table 6A: Supply and consumption
000 metric tons
1990 2008 2009 2010e 1990 2008 2009 2010e
LPG AND ETHANE REFINERY GAS
Refinery output 521 799 771 632 1 442 815 648 710
+ Recycled products - - - - - - - -
+ Imports 44 493 487 543 - - - -
- Exports 1 070 - - - - - - -
- Intl. marine bunkers - - - - - - - -
+ Transfers 2 024 727 790 707 - - - -
+ Stock change - 22 - 16 14 - 18 - - - -
- Statistical difference - 74 - 465 - 398 - 520 - - - -
Total consumption 1 571 2 468 2 460 2 384 1 442 815 648 710
of which: ethane - 375 318 347 - - - -
Transformation 30 14 11 .. - - - ..
Energy industry own use 2 65 66 .. 1 437 750 595 ..
Transport 405 1 194 1 201 .. - - - ..
Industry 810 821 797 .. 5 65 53 ..
Other 324 374 385 .. - - - ..
Memo: Non-energy use 581 608 562 .. - - - ..
Closing stock level 117 191 177 195 - - - -
NAPHTHA OTHER KEROSENE
Refinery output 217 380 254 159 247 84 58 30
+ Recycled products - - - - - - - -
+ Imports - - - - 30 - - -
- Exports - - - - 18 - - -
- Intl. marine bunkers - - - - - - - -
+ Transfers - - - - - - - -
+ Stock change 3 - - 18 - 14 3 - 3 3 3
- Statistical difference - 119 363 219 121 103 57 37 5
Total consumption 339 17 17 24 159 24 24 28
Transformation - - - .. - - - ..
Energy industry own use - - - .. - 9 11 ..
Transport - - - .. - - - ..
Industry 339 17 17 .. 8 5 5 ..
Other - - - .. 151 10 8 ..
Memo: Non-energy use 333 - - .. 6 5 5 ..
Closing stock level 2 - 18 32 45 11 8 5
WHITE SPIRIT + SBP LUBRICANTS
Refinery output 40 103 76 .. 560 103 97 ..
+ Recycled products - - - .. - - - ..
+ Imports - - - .. 48 351 327 ..
- Exports - - - .. 222 142 146 ..
- Intl. marine bunkers - - - .. - - - ..
+ Transfers - - - .. - - - ..
+ Stock change - 9 - 5 6 .. 9 13 9 ..
- Statistical difference - 62 - 165 - 173 .. - 67 - 63 - 105 ..
Total consumption 93 263 255 .. 462 388 392 ..
Transformation - - - .. - - - ..
Energy industry own use - - - .. - - - ..
Transport - - - .. - - - ..
Industry 93 263 255 .. 462 388 392 ..
Other - - - .. - - - ..
Memo: Non-energy use 93 259 251 .. 462 388 392 ..
Closing stock level 51 14 8 .. 125 64 55 ..
Source: Annual Oil Statistics.
INTERNATIONAL ENERGY AGENCY

III.86 - OIL INFORMATION (2011 Edition)
AUSTRALIA
Table 6B: Supply and consumption
000 metric tons
1990 2008 2009 2010e 1990 2008 2009 2010e
BITUMEN PARAFFIN WAXES
Refinery output 571 653 621 .. 20 5 6 ..
+ Recycled products - - - .. - - - ..
+ Imports 67 425 391 .. - - - ..
- Exports 1 3 1 .. - - - ..
- Intl. marine bunkers - - - .. - - - ..
+ Transfers - - - .. - - - ..
+ Stock change 2 13 - 10 .. - 1 - 1 - ..
- Statistical difference - 17 279 167 .. 13 - - ..
Total consumption 656 809 834 .. 6 4 6 ..
Transformation - - - .. - - - ..
Energy industry own use - - - .. - - - ..
Transport - - - .. - - - ..
Industry 656 809 834 .. 6 4 6 ..
Other - - - .. - - - ..
Memo: Non-energy use 656 809 834 .. 6 4 6 ..
Closing stock level 41 25 35 .. 6 1 1 ..
PETROLEUM COKE OTHER PRODUCTS
Refinery output 431 472 473 493 830 108 240 739
+ Recycled products - - - - 310 4 545 5 345 4 429
+ Imports 631 869 798 718 144 91 80 722
- Exports - - - - 115 41 38 198
- Intl. marine bunkers - - - - - - - -
+ Transfers - - - - 10 -4 199 -4 981 -4 099
+ Stock change - - - - - 245 148 11 - 121
- Statistical difference 118 - - - - - - - 730
Total Consumption 944 1 341 1 271 1 211 934 652 657 2 202
Transformation - - - .. - - - ..
Energy industry own use 419 472 473 .. 6 89 106 ..
Transport - - - .. - - - ..
Industry 525 869 798 .. 916 563 551 ..
Other - - - .. 12 - - ..
Memo: Non-energy use 525 869 798 .. 924 525 e 514 ..
Closing stock level - - - - 674 587 576 796
Source: Annual Oil Statistics.
INTERNATIONAL ENERGY AGENCY

OIL INFORMATION (2011 Edition) - III.87
AUSTRALIA
Table 7A: Imports by country of origin
000 metric tons
2008 2009 2010e 2008 2009 2010e 2008 2009 2010e
Crude oil Natural gas liquids Feedstocks and other
Australia - - - - - - - - -
Bel
g
ium - - - - - - - - -
Canada - - - - - - - - -
Czech Re
p
ubli
c
- - - - - - - - -
Denmark - - - - - - - - -
Finland - - - - - - - - -
France - - - - - - - - -
German
y
- - - - - - - - -
Greece - - - - - - - - -
Hun
g
ar
y
- - - - - - - - -
Ireland - - - - - - - - -
Ital
y
- - - - - - - - -
Ja
p
an - - - - - - - - -
Korea - - - - - - - - -
Mexic
o
- - - - - - - - -
Netherlands - - - - - - - - -
New Zealand 1 579 1 851 2 055 - - - - - -
Norwa
y
- - - - - - - - -
Poland - - - - - - - - -
S
p
ain - - - - - - - - -
Sweden - - - - - - - - -
Turke
y
- - - - - - - - -
United Kin
g
dom - - - - - - - - -
United States - - - - - - - - -
Othe
r
- - - - - - - - -
OECD 1 579 1 851 2 055 - - - - - -
Ar
g
entina - - - - - - - - -
Brazil - - - - - - - - -
Colombia - - - - - - - - -
Ecuado
r
- - - - - - - - -
Netherlands Antilles - - - - - - - - -
Peru - - - - - - - - -
Trinidad and Toba
go
- - - - - - - - -
Venezuela - - - - - - - - -
Othe
r
- - - - - - - - -
Latin America - - - - - - - - -
Kazakhstan - - - - - - - - -
Russian Federation 275 478 366 - - - - - -
Other - - 256 - - - - - -
Non-OECD Europe/Eurasia
275 478 622 - - - - - -
Iran - - 34 - - - - - -
Ira
q
34 32 - - - - - - -
Kuwai
t
- - - - - - - - -
Oman - - - - - - - - -
Qata
r
- - - - - - - - -
Saudi Arabia 459 620 382 - - - - - -
United Arab Emirates 2 928 2 334 3 074 - - - - - -
Othe
r
- - - - - - - - -
Middle East 3 421 2 986 3 490 - - - - - -
India - - - - - - - - -
Indonesi
a
2 610 2 933 3 399 - - - 25 - -
Sin
g
a
p
ore 74 83 86 - - - 578 420 463
Othe
r
12 026 10 413 9 934 - - - 61 28 63
Asia 14 710 13 429 13 419 - - - 664 448 526
China - 92 - - - - - - -
Al
g
eria 149 164 296 - - - - - -
An
g
ola - - - - - - - - -
Cameroon - - - - - - - - -
E
gypt
- - - - - - - - -
Gabon - - 38 - - - - - -
Lib
y
an Arab Jamahiri
y
a - - 363 - - - - - -
Ni
g
eria - - 888 - - - - - -
Tunisia - - - - - - - - -
Othe
r
- - - - - - - - -
Africa 149 164 1 585 - - - - - -
Non-spec./other 137 47 173 - - - - 8 -
Total imports 20 271 19 047 21 344 - - - 664 456 526
Memo: Total OPEC 3 570 3 150 5 037 - - - - - -
Source: Annual Oil Statistics.
INTERNATIONAL ENERGY AGENCY