Henini M. Handbook of Self Assembled Semiconductor Nanostructures for Novel devices in Photonics and Electronics
Подождите немного. Документ загружается.

Quantum Optics with Single CdSe/ZnS Colloidal Nanocrystals 729
experimental impossibility to monitor them individually. Isolated single-QD microscopy experi-
ments, on the contrary, can easily follow the fl uorescence trajectory of each emitter within a collec-
tion of QDs, and directly investigate the relation between time- and ensemble-averaged quantities
in systems driven by broad power-law distributions, and address the ergodic hypothesis, usually
promoted to the status of principle given the practical impossibility to check its validity.
24.5.3.3 QD blinking: a non-stationary dynamics driven by rare events
The main tool to further grasp the properties of broad distributions is the generalized central
limit theorem. This theorem, formulated by Pierre Lévy in 1937, states that the sum of N inde-
pendent variables, instead of scaling as N , scales instead as N
1/ μ
when these variables follow
broad power distributions of index μ 1 [118] . Following this theoretical result, the total time
θ ( N ) spent in the off state after N switching events:
θτ()
()
N
i
i
iN
off
0
∑
is expected to scale as
NN
1
2
/μ
off
for independent off-state durations following a power-law
distribution with μ
off
1/2 [111] . As a result, as time passes, larger and larger off-events occur,
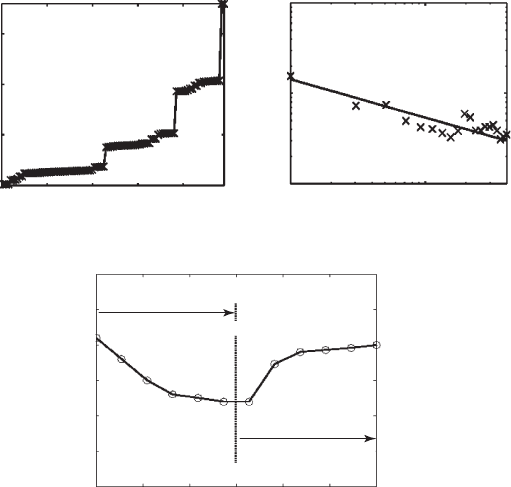
and θ ( N ) is expected to grow faster than N . Figure 24.15a , showing θ ( N ) as measured on a CdSe
QD by simply recording its blinking intensity over a long durations Θ 10 min, fully supports
this analysis. The sum θ ( N ) is dominated by a few long events of the order of θ ( N ) itself. The con-
sequence of this unusual scaling property of θ ( N ) is that, as time grows, QDs are increasingly
found “ stuck ” in longer and longer off states, and so the probability to observe a switch-on event
decreases with time ( Fig. 24.15b ). Due to the occurrence of Lévy statistics, time translation is
broken in the blinking process, QDs showing an aging effect of purely statistical origin ( “ statisti-
cal aging ” ) even if the QD sample does not experience any progressive physical degradation (e.g.
photobleaching) upon excitation.
This effect has practical importance at non-vanishing excitation power, when truncation
effects appear at long timescales in the on-states distribution. In this case, the truncation defi nes
an upper boundary for the on-states duration, while larger and larger unbounded off states con-
tinue to appear in the QD time traces, accounting for a progressive darkening in the fl uorescence
of the whole QD sample ( Fig. 24.15c ).
Knowledge concerning the blinking properties of QDs is therefore essential in the fl uorescence
behaviour of an ensemble of QDs. Where one might have erroneously concluded that the obser-
vation of photodarkening shows that QDs undergo signifi cant irreversible photobleaching, we
see that photodarkening on a QD sample can also originate as a manifestation of non-stationary
behaviour, with the sample completely recovering its initial brightness when laser excitation is
interrupted ( Fig. 24.15c ) [107, 108] .
24.5.3.4 Semiconductor QDs as non-ergodic systems
Further analysis also reveals that, due to the occurrence of Lévy statistics, time averages and
ensemble averages on CdSe QDs are no longer defi ned. This was evidenced by comparing the frac-
tion Φ of QDs in the on state within a given sample, and the fraction of time spent in the on state
by each QD individually. Under the ergodic assumption, these two quantities should coincide, and
provide the probability for a QD to be in its on state. However, QDs reveal a completely different
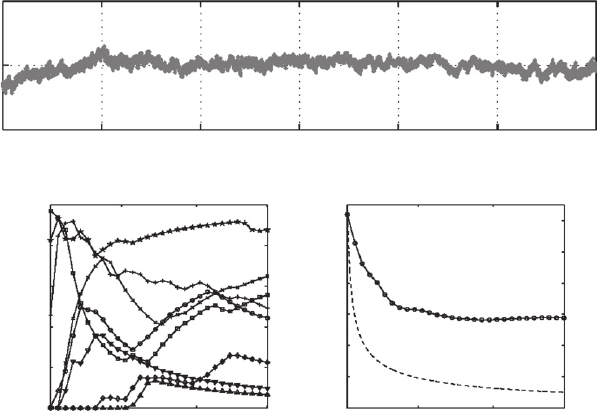
pattern ( Fig. 24.16 ). While the ensemble-averaged fraction of QDs remains constant over time,
time averages are found to fl uctuate from QD to QD, even after integration times as large as 10
minutes [107] . Due to blinking, observing the fl uorescence intermittency of a single QD does not
provide any information on its ensemble-averaged properties.
Reported and discussed here on a particular observable (the total intensity of the QD sample),
blinking-induced non-ergodic behaviour could conceivably also affect many other QD observables.
Indeed, as fl uorescence intermittency correlates in time with incessant charge-reorganization
events randomly altering most electronic QD properties (as discussed above, see section 24.5.2.2),
the broad statistics encountered in fl uorescence intermittency might also appear in the fl uctuating
CH024-I046325.indd 729CH024-I046325.indd 729 6/25/2008 11:13:13 AM6/25/2008 11:13:13 AM
730 Handbook of Self Assembled Semiconductor Nanostructures for Novel Devices in Photonics and Electronics
dynamics of other QD properties, and yield, for example, non-trivial statistical aging effects in
their ensemble fl uorescence spectrum [119] .
24.5.4 Origin of quantum dot blinking kinetics
Is the transition between on and off states a discontinuous quantum jump? Or does it occur in a
continuous fashion which has not been temporally resolved yet [121] ? Does blinking also hap-
pen at very short timescales? As questions concerning the properties of the switching process
still abound, models attempting to account for available data QD blinking phenomena appeared,
and continue to fl ourish.
24.5.4.1 Blinking models: an overview
The fi rst class of models consists of a QD interacting with one or several traps [122] . This model,
reminiscent of two-level systems coupled to a dark, triplet state, constitutes a simple mechanism
for QD fl uorescence intermittency. However, a single dot interacting with a single static trap only
yields exponential on and off waiting time distributions, with rates given by the ionization rate
and neutralization rate, respectively.
24.5.4.1.1 Distributed traps models
More complex models were then developed, attempting to account for the strongly non-
exponential, broad power-law decay observed on QDs and their seemingly universal μ 1 / 2
exponent. As reviewed by Kuno [123] , such models mainly explored two directions, namely
the possibility for the QD (1) to be coupled not to one, but to an ensemble of traps with widely
Laser excitation off
Laser excitation on
1000
0
0.5
1
1.5
2
2.5
3
0
0
(a) (b)
(c) Time (s)
100
200
300
20 40
Number N of switch on events
60 80
10
1
10
2
10
1
10
0
10
0
200 300 400 500 600
Total intensity (a.u.)
θ (S)
S (θ)
θ (N) (S)
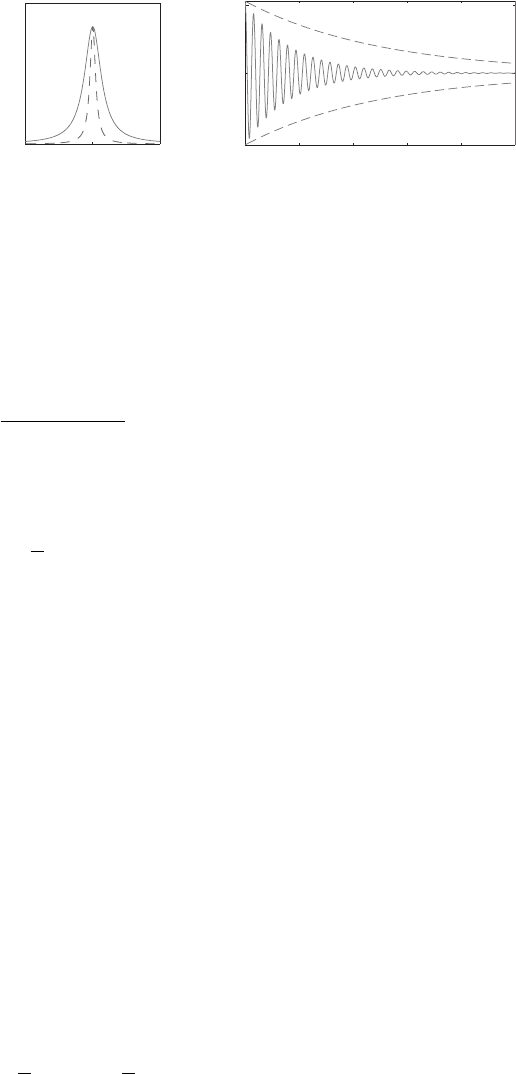
Figure 24.15 Statistical aging in the fl uorescence of single CdSe QDs. (a) Evolution of the total time θ ( N ) spent
in the off state as a function of N , the number of switching events experienced by the QD since the beginning of its
observation. The sum θ ( N ) is dominated by a few large events. (b) Probability density s ( θ ) to see a QD switching on
after having spent a total time θ in the off state, as measured on an ensemble of 215 QDs ( ). The “ switch on ” prob-
ability density s ( θ ) decreases in time according to a power-law decay θ
α
with α μ
off
1/2, as expected from the
theory (solide line) [107, 111] . As a result, the total intensity of the sample undergoes a progressive (yet reversible)
decay (c) [95] .
CH024-I046325.indd 730CH024-I046325.indd 730 6/25/2008 11:13:13 AM6/25/2008 11:13:13 AM
Quantum Optics with Single CdSe/ZnS Colloidal Nanocrystals 731
distibuted neutralization rates [124] , or (2) to have a slowly varying parameter (such as the QD
shell width) resulting in large fl uctuations of its ionization rate [101] . Scenario (1) so far fails to
account for the fact that multi-exponential decay is observed for both on and off waiting times,
since the escape rate of a charge in a QD coupled to many traps is simply given by the sum of
the individual escape rate to each trap, yielding an overall single-exponential escape probability
distribution. Finally, models following scenario (2) predict correlations in the duration between
successive on and off states at timescales shorter than the correlation time of the slowly varying
parameter. These correlations so far failed to materialize to experimenters [101] . Importantly,
these models do not provide any verifi ed explanation for the μ 1/2 exponent observed across
a variety of colloidal semiconductor QDs (CdTe, CdSe, CdS), no matter their size, temperature or
excitation intensity [102] .
24.5.4.2.1 First-passage models
A striking fact is that power-law statistics with the particular exponent value of μ 1/2 appear
not only in QDs blinking statistics, but also – and more fundamentally – in the fi eld of random
walks theory. Indeed, the time needed for a random walker to cross the point where he started his
motion (also called the fi rst-passage time) is power-law distributed, with an exponent μ 1/2. This
observation forms the basis of a third class of models, elaborating on possible mechanisms to turn
what might fi rst have appeared as an incidental coincidence into an essential and guiding pattern.
Shimizu [102] fi rst proposed a model along this idea for a QD interacting with a single trap.
The trap is assumed to perform a random walk in the (one-dimensional) energy space under
the infl uence of fl uctuations in its nanoscale environment, the QD state (on/off) subsequently
switching each time an electron is exchanged between the QD and the trap, i.e. when crossing
occurs between the trap energy and the excited-state energy. Despite its formal simplicity, this
Integration time (s)
Time (s)
0
0
0.2
0.4
0.6
0.8
0
0.2
0.4
0.6
0.8
1
1.2
100 200 300
0
0
0.5
1
100 200 300 400 500 600
Integration time (s)
0 200 400 600
σ
R
(Δt)
φ
(i)
(Δt)
φ(t)
(a)
(b) (c)
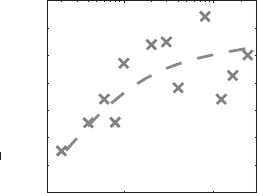
Figure 24.16 Non-ergodic behaviour of QDs in a sample of 231 emitters under low excitation power. (a) Fraction
of QDs found in the on state at time t within the sample. The constant ensemble-averaged value of 1/2 for Φ ( t )
is in agreement with the fact the blinking process is symetric (i.e. μ
on
μ
off
) at low excitation power [111, 120] .
(b) Fraction of time spent Φ
(
i
)
( Δ t ) in the on state over an integration time Δ t for eight different QDs. These time
averages widely fl uctuate from QD to QD, even in the limit of long integration times (here Δ t 5 min). For an
ergodic sample, the relative dispersion σ
r
( Δ t ) of Φ
(
i
)
( Δ t ) – i.e. the standard deviation of the distribution Φ
(
i
)
( Δ t )
over the set of QDs, divided by its mean value – would decay to zero over long integration times (solid line (c)). QDs,
on the contrary, exhibit non–vanishing time-average fl uctuations showing that time averages do not converge to any
defi nite value, indicative of the non-ergodic character of their fl uorescence properties.
CH024-I046325.indd 731CH024-I046325.indd 731 6/25/2008 11:13:13 AM6/25/2008 11:13:13 AM
732 Handbook of Self Assembled Semiconductor Nanostructures for Novel Devices in Photonics and Electronics
model has the elegance to provide a simple and direct explanation for the occurrence of power-
laws with a μ 1/2 exponent.
Despite having QDs interacting with a single trap of infi nite lifetime, and performing an
unbounded random walk in the energy space seems quite unrealistic, this approach paved the way
for elegant and powerful models later developed along the same “ fi rst-passage time ” concept.
Inspired by diffusion-controlled electron transfer effects, Tang and Marcus replaced the
(unbounded) random walk in the energy space by the diffusive walk of a reaction coordinate in a
free energy harmonic (confi ning) potential, i.e. around a stability point of the QD [125] . Within
this frame, spectral diffusion and fl uorescence intermittency become the manifestation of the dif-
fusive walk of QD reaction coordinates in the harmonic potentials of the on and off state under
the infl uence of the slow relaxation of the QD environment.
Major achievements of their model are its unifi ed description of both blinking and spectral
diffusion – two effects heretofore treated in a disconnected fashion – and an unparalleled ability
to account under rather broad assumptions for the many properties of spectral diffusion and
blinking as seen in a variety of experiments (e.g. dependence of blinking and spectral diffusion
against temperature and excitation intensities, signifi cance and consistent description of the
long-time cut-offs in the on and off waiting time distributions).
24.5.5 Conclusion
Seen as a pitfall leading to unwanted line broadening and instability both in spectroscopy [126]
and in future optoelectronic QD-based devices (nanoprobes in biology [127] , single-photon
sources for quantum information processing [128, 129] ), interactions of QDs with their environ-
ment, whenever properly measured and understood, also turn each of these emitters into tiny
probes reporting information on local electric fi elds, electronic dynamics and optical properties
in their surroundings [98] .
From a general standpoint, blinking in QDs has so far signifi cantly stimulated the development
of new strategies and techniques to further investigate its bright and dark states ’ waiting time
distributions and provide a clearer picture of the QD environment dynamical properties.
24.6 Time coherence of the single photons emitted by an individual nanocrystal
24.6.1 Monomode photons and quantum computing
Apart from blinking, another important effect of the local environment of the nanocrystal
appears in the fl uorescence spectrum. In the perspective of single-photon emission for quantum
cryptography, the details of the emission spectrum are of little importance. For further quantum
computing realizations, however, these aspects should be investigated much more closely.
Knill et al. [130] have shown that quantum logic gates can be realized with only linear optical
components, provided that the photons are indistinguishable. This relies on a mechanism called
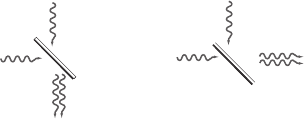
“ coalescence ” , which is the interference of two indistinguishable photons. Let us consider two such
photons A and B impinging each on one side of a 50/50 non-polarizing beam splitter ( Fig. 24.17 ).
The output wavefunction is (| α 〉 | β〉 )
A
丢 (| α 〉 | β 〉 )
B
. This is equal to | α 〉
A
丢 | α〉
B
| β 〉
A
丢 | β〉
B
since | α 〉
A
丢 | β〉
B
| β 〉
A
丢 | α〉
B
as A and B are bosons. Thus the two photons
“ coalesce ” : they are detected at the same output.
or
B
α
B
B
B
A
A
A
α
ββ
Figure 24.17 Principle of photon coalescence: if two indistiguishable photons A and B arrive on two sides of a
non-polarizing beam splitter, they are both detected at the same output.
CH024-I046325.indd 732CH024-I046325.indd 732 6/25/2008 11:13:14 AM6/25/2008 11:13:14 AM
Quantum Optics with Single CdSe/ZnS Colloidal Nanocrystals 733
To be indistinguishable, two photons must be (i) each in a single mode and (ii) both in the same
mode (in terms of wavelength and polarization). The fi rst condition, which requires the absence of
any dephasing during an emission, is characterized by Γ
2
Γ
1
/2, where Γ
1
and Γ
2
are the res-
pective decay rates of the excited-state population and of the emitting dipole coherence. These
conditions are fulfi lled for photons emitted by a trapped atom, as evidenced by a coalescence
experiment performed in 2004 [131] . This might not be the case for other sources, as interac-
tions with the surrounding solid matrix might perturb the emission, following two limit regimes:
● Slow and large fl uctuations, like fl uctuations of the local electric fi eld caused by charge
movements (see section 24.5), create a spectral diffusion of the emission. If spectral diffu-
sion occurred between the emissions of the two photons, they do not match condition (ii).
● Fast and small fl uctuations, like collisions with impurities or with the phonon bath, cre-
ate random dephasings during each emission. On average, these dephasings decrease the
dipole coherence at a rate Γ
deph
which adds to the rate Γ
1
/2 related to emission mecha-
nisms. The decoherence rate Γ
2
Γ
1
/2 Γ
deph
is thus superior to the “ transform-limited ”
value Γ
1
/2, which characterizes mono-mode emission. This corresponds to a perturbed
emission spectrally broadened by the term Γ
deph
so that more than one mode have to be
taken into account to describe the emitted photon state, and condition (i) is not fulfi lled.
It can also be understood as an individual photon emission undergoing a specifi c sequence
of dephasings, which makes each emitted photon distinguishable from the others.
For some molecules at low temperature in a crystalline matrix, a transform-limited linewidth
has been measured [133] . Some self-assembled dots coupled to a cavity also exhibited indistin-
guishable photons emission [134, 135] , evidenced by indirect coalescence measurements using
a Hong–Ou–Mandel set-up [136] . For coloured centres, interaction with phonons creates large
broad sidebands. The zero-phonon line – the one which might be transform limited – represents
only 3% of the emission spectrum and its study would not be relevant [81] . As for nanocrystals,
their emission spectrum is not easy to characterize, as is detailed below.
24.6.2 Spectroscopy of a single nanocrystal
Therefore, spectroscopy of an emitter is an important aspect of its characterization, because it
provides information about the infl uence of the local environment, and because spectral broad-
ening and spectral diffusion are key parameters for quantum-computing applications. In order to
distinguish between the linewidth 2 Γ
2
and the spectral-diffusion broadening during τ , which we
label 2 Γ
τ
, one must be able to perform fast spectroscopic measurements.
Time resolution is a very general problem in single-emitter experiments, as signals of typically
10 000 counts per second are detected. If one wants to plot the intensity, with a signal-to-noise ratio
of 5, one needs 25 counts per time bin, so that the time resolution is limited to typically 2.5 ms. This
restricts, for instance, the possibility to study very fast blinking, as discussed in section 24.5.
In the same way, if one wants to plot consecutive spectra, each spectrum requiring around 1000
counts, the resolution is limited to 100 ms. If spectral diffusion occurs faster than 100 ms, it broadens
the measured spectra: following our choice of notations, the measured linewidth is 2( Γ
2
Γ
100ms
).
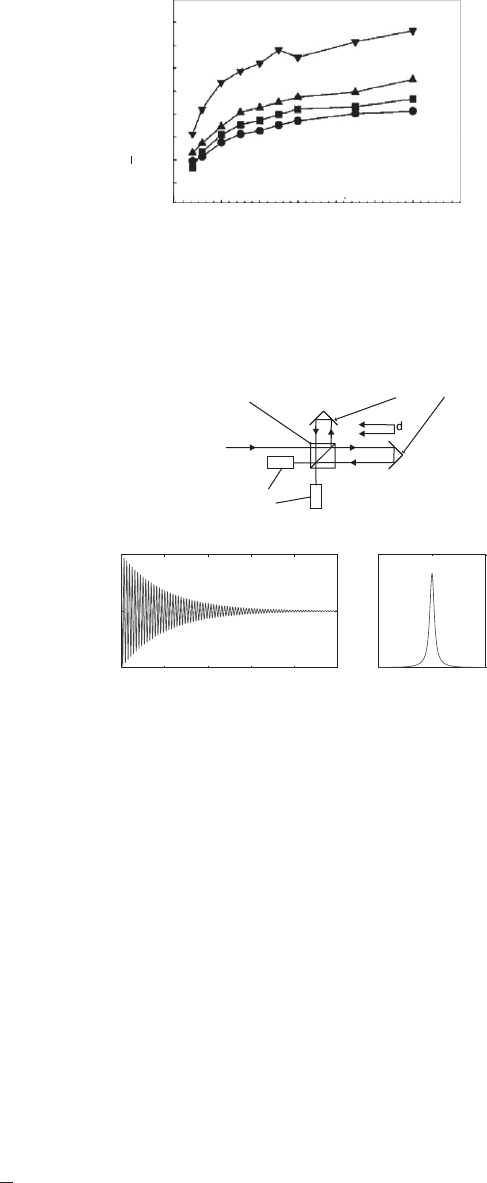
Indeed, for single nanocrystals, the linewidth measured at 10 K shows a strong dependence on
the acquisition time [132] , which is well accounted for by a diffusion-in-a-potential model [125] .
Values of a few meV are measured – 120 μ eV at best ( Fig. 24.18 ).
Better time resolutions are achieved on ensembles of emitters. For nanocrystals, spectral diffusion
over a few tens of μ eV has been observed during tens of microseconds by spectral hole burning, and
a linewidth of 6 μ eV has been reported [137] . Three-pulse photon echo experiments have also been
performed [138] . Although designed to suppress inhomogeneous broadening, these methods still
consider ensemble averages and are less satisfying. Moreover, they probe the absorption spectrum,
which, because of fast intraband relaxation, is substantially different from the emission spectrum.
The same problem exists with the fi rst method investigated for single-molecule time-resolved spec-
troscopy, which calculated the correlations of consecutive two-photon excitation spectra [139] – and
the resolution was limited to a few milliseconds, which would not be suffi cient for nanocrystals.
CH024-I046325.indd 733CH024-I046325.indd 733 6/25/2008 11:13:14 AM6/25/2008 11:13:14 AM
734 Handbook of Self Assembled Semiconductor Nanostructures for Novel Devices in Photonics and Electronics
24.6.3 Photon-correlation Fourier spectroscopy
This problem brought about the proposal of a new method, called photon-correlation Fourier
spectroscopy (PCFS) [140] . Let us outline this method briefl y (precise calculations can be found
in [140] and [141] ), by considering a classical dipole emitter with a simple spectral diffusion
where spectral jumps during τ follow a Lorentzian distribution of width 4 Γ
τ
.
Standard Fourier spectroscopy, using the scanning Michelson interferometer described in
Fig. 24.19 , measures the intensity I
a
on photodiode a as a function of the path difference d
t
η t . If
the time resolution of the intensity measurement (say, 2.5 ms) is longer than the correlation time
of spectral diffusion (which is the case for nanocrystals), the measured interferometer is broad-
ened by spectral diffusion:
It
I
ed
a
d
t
t
( ) cos( ) .
()
2
1
210
0
Γ
ms
ω
()
(24.18)
Average measured linewidth
2h(Γ
2
+ Γ
τ
) (meV)
Integration time τ (s)
0 80 120
0
2
4
6
10 K
20 K
30 K
40 K
40
Figure 24.18 Measured emission linewidth 2 ( Γ
2
Γ
τ
) as a function of the spectrum integration time τ , at vari-
ous temperatures (reproduced from [132] authorization for reproduction asked). Each dot is an average over several
tens of CdSe/ZnS nanocrystals with 2.8 nm radius.
Light source
Retroreflectors
Beam splitter
a
bPhoton
counters(a)
(b)
0 10 20 30 40
0
0.5
1
Ia
8 10 12
(c)
d
s
ω
Figure 24.19 Standard Fourier spectroscopy. (a) Michelson interferometer with a temporal path difference d and
two photon-counting detectors. (b) Intensity on detector a as a function of d and (c) corresponding emission spec-
trum s ( ω ), for a two-level emitter of frequency ω
0
10 and coherence time T
2
10 (arbitrary units). One can
show that I
a
( d ) I ( 1 R ( g
(1)
( d )))/2, and the Wiener–Khintchine theorem states that g
(1)
( d ) is the Fourier
transform of s ( ω ) .
CH024-I046325.indd 734CH024-I046325.indd 734 6/25/2008 11:13:14 AM6/25/2008 11:13:14 AM
Quantum Optics with Single CdSe/ZnS Colloidal Nanocrystals 735
The principle of PCFS is, during the same interferometer scan, to measure the intensity
cross-correlation:
gt
ItIt
It It
ab
ab t
atbt
(, )
() ( )
() ()
τ
τ
δ
δδ
〈〉
〈〉〈〉
(24.19)
for consecutive times t (and corresponding path differences d
t
). If the averaging time δ t is chosen
so that one scans a large but not too large number of fringes (that is, η ω
0
δ t 1 and η Γ
2
δ t 1):
gt e
ab
d
t
(, ) cos
()
τωητ
τ
1
1
2
2
0
2
(24.20)
and cos ω
0
η τ
⯝
1 for short τ , the dependence of g
ab
( t , τ ) on d
t
thus yields the decoherence rate Γ
2
and the spectral diffusion Γ
τ
.
Like studies of fast blinking through bunching in the g
(2)
function [28] , PCFS takes advantage of
the very general fact that intensity correlations can be measured with a much better time resolu-
tion than intensity itself, provided that the acquisition time δ t is long enough. More explicitly, since
the number of photon pairs counted per ([ t , t δ t ], [ τ , τ δ τ ]) bin is of the order of I
a
I
b
δ t δ τ and
should be at least 25 for a reasonable 5/1 signal-to-noise ratio, δ τ , the precision on τ is of the order
of 25/ I
a
I
b
δ t , and can be taken arbitrarily short by setting a suffi ciently long δ t integration time.
PCFS has been performed on single nanocrystals at 10 K [142] . The duration of the experi-
ment was limited to 10 minutes by both nanocrystal blinking and slow position drift of the
nanocrystal into the cryostat, resulting in a δ τ 2 0 μ s resolution on correlation measurements.
The measured g
ab
( t , τ ) showed the expected decrease with increasing d
t
, with the exponential
dependence assumed above. The fi tted linewidth Γ
2
Γ
τ
is plotted in Fig. 24.21 : a spectral diffu-
sion of a few μ eV over around 200 μ s is observed, and an upper limit of 6 μ eV is measured for the
linewidth 2 Γ
2
, corresponding to a coherence time T
2
200 ps.
Although longer than indicated by previous spectroscopic studies, this coherence time is much
shorter than the excited-state lifetime ( T
1
⬃ 200 ns at 10K), and the limit of mono-mode photons
( T
2
2 T
1
) seems hardly achievable. However, if one considers, for instance, the same Michelson
interferometer, with a fi xed d T
1
path difference, the normalized cross-correlation will be for
τ d /2 (here without spectral diffusion):
gee
ab
r
()
()
τ
ττ
1
1
2
1
2
12
2
(24.21)
so that g
ab
( τ T
2
) 0, which can be interpreted as follows: when considered on a timescale
shorter than the characteristic time between two dephasings, two photons behave as if they were
indistinguishable and coalesce. Thus two-photon interference effects could be observed, even
with non-mono-mode photons, provided that a suffi ciently good resolution on τ can be achieved.
(b)
0481216
0
0.5
1
Ia
812
(a)
d
S
ω
10
Figure 24.20 Infl uence of spectral diffusion on standard (a) spectroscopy (spectrum S ( ω )) and (b) Fourier spec-
troscopy (interferogram I
a
( d ), where d is the path difference), in the case of a two-level emitter of frequency 10,
linewidth 0.2 and spectral-diffusion broadening 0.6 (in arbitrary units), where spectral diffusion is assumed to be
faster than the spectrum or intensity measurement. The dotted line indicates the envelope of the case without spectral
diffusion.
CH024-I046325.indd 735CH024-I046325.indd 735 6/25/2008 11:13:15 AM6/25/2008 11:13:15 AM
736 Handbook of Self Assembled Semiconductor Nanostructures for Novel Devices in Photonics and Electronics
It might allow two-photon interferences experiments, by use of a detection system following an
experiment reported in the atomic physics domain [131] .
24.7 Multiexcitonic emission of colloidal quantum dots
24.7.1 Auger processes in colloidal quantum dots
Under pulsed and continuous excitation, colloidal CdSe quantum dots appear to be perfect single
photon emitters at room and cryogenic temperature (see section 24.4). The fl uorescence of these
solid-state sources is then similar to that of a single two-level system such as an atom. This prop-
erty reinforces the image of “ artifi cial atoms ” suggested by their atomic-like spectrum and are com-
monly used to describe semiconductor quantum dots. As already discussed, compared to individual
molecules, ions or atoms, quantum dots display a crucial difference since various electrons can be
excited simultaneously by absorption of the optical excitation. Due to the Auger effect, these multi-
electron–hole pairs mostly decay non-radiatively, the energy being transferred to charge carriers.
Multiexciton states in semiconductor quantum dots have been studied in detail fi rst for a fun-
damental understanding of many-body interactions in nanometre-sized confi ned volume which
is much smaller than the volume occupied by an excition in the bulk semiconductor. They are
also important for the realization of practical optoelectronic devices including quantum dots and
gain applications such as lasers [143] .
Auger processes are much more effi cient in nanometre-sized structures than in the correspond-
ing bulk materials. In the bulk material, the excitons ’ maximum density is equal to one exciton per
excitonic volume which is of the order of the Bohr radius exciton cubed. Above this concentration,
electron and holes build up a plasma. Resulting screening effects reduce Coulomb interactions and
effi ciency of the Auger processes. On the contrary, strong carrier confi nement prevents dynamic
screening and Coulomb interactions are enhanced. Moreover, the very small size of nanocrystals
implies that there is no translation symmetry and hence no carrier momentum conservation.
Auger processes forbidden in bulk semiconductor become very effi cient in quantum dots.
The high effi ciency of Auger effects has been reported in various experimental and theoretical
works. For CdSe nanocrystals with radii ranging between 1.2 and 3.6 nm, the Auger process occurs
in less than 100 ps, a time much faster than the radiative lifetime which is of the order of 20 ns
[67] . The photoluminescence signal mostly comes from the recombination of single excitations
generated directly by optical excitation or by Auger recombination of multi electron–hole pairs.
The dynamics of multiexcitonic states emission was fi rst examined with very fast time resolved
methods in a transient regime. Since the recombination of multiexcitonic states is mostly non-
radiative, these experiments were fi rst carried out on nanocrystal ensembles. Multiparticle
Auger rate photoluminescence measurements exhibit emission bands from multi-career excited
10
2
10
3
5
6
7
8
9
10
11
12
2h (Γ
2
Γ
τ
) (μeV)
τ (μs)
Figure 24.21 Effective-linewidth-during- τ 2 ( Γ
2
Γ
τ
) measured on a single CdSe/ZnS colloidal nanocrystal by
photon-correlation Fourier spectroscopy [142] .
CH024-I046325.indd 736CH024-I046325.indd 736 6/25/2008 11:13:15 AM6/25/2008 11:13:15 AM
Quantum Optics with Single CdSe/ZnS Colloidal Nanocrystals 737
states in nanocrystals. Achermann et al . obtained two additional bands [144] . The fi rst is blue
shifted compared to the single excitation peak, while the other one is red shifted. The authors
assigned the the fi rst one to a negatively charged biexciton and the second one to a neutral
biexciton. However, the exact nature of the state at the origin of the light remains controver-
sial. More recently, an alternative pumping scheme was proposed [145] . It consists in an excita-
tion pulse of long duration compared to the Auger rate, the absorption rate being kept smaller
than the relaxation rate to the band edge. It enables the quantum dots to be pumped to a given
number of electron hole pairs controlled by the intensity pump without passing through a large
number of excitons. The authors obtained the emission spectra of higher excitonic bands and
their order of appearance which enabled the nature of the electronic state involved in each line
to be determined.
The size dependence of the Auger rate was investigated for quantum dots with radii R ranging
between 1 and 4 nanometres. The relaxation time is found to be proportional to R
3
for two, three
and four electron–hole pair states [67] . The absence of multiexcitonic emission for high pump-
ing power is specifi c to colloidal quantum dots, because they can be very small. Indeed, epitaxi-
ally grown quantum dots exhibit multiexcitonic emission unless low pumping is used. As already
mentionnend, from the point of view of single photon generation, this property is a clear advan-
tage since epitaxially grown quantum dots require the use of spectral fi ltering in order to isolate
the single-exciton emission leading to optical losses.
V
X
H
X
H
BX
V
BX
BX
XX
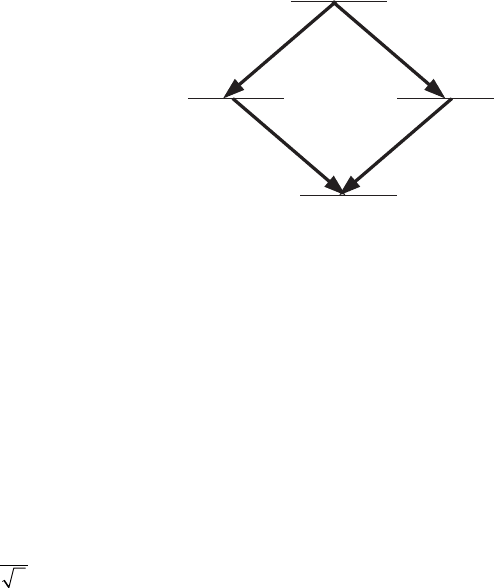
Figure 24.22 Schematic description of the biexcition – exciton cascade in quantum dots.
24.7.2 Entangled photon pair generation by solid-state sources
However, in the fi eld of optical quantum information protocols, biexcitonic emission of an epi-
taxially grown quantum dot can be used to generate polarization entangled photon pairs, follow-
ing the scheme of Fig. 24.22 [146, 147] . The two-exciton space of a quantum dot consists in
a ground state, two single exciton states and the biexciton state. The biexciton decays through
two intermediate exciton states. The proposal that the biexciton radiative cascade can provide
a source of polarization entangled photon pairs is based on the fact that the two decay paths
involve different polarization schemes. It also requires the indistinguishability of the two paths
concerning parameters other than polarization. In an ideal situation, the polarization of the BX
photon is entangled with the one of the X photon, yielding the state:
1
2
()兩兩HH VV
BX X BX X
〉〉
(24.22)
where H (respectively V) means horizontally (respectively vertically) polarized. Until recently,
various experiments showed a splitting of the intermediate states. This splitting comes from the
in-plane anisotropy of the structure of epitaxially grown quantum dots which induces strain and
elongation. In this case, only classically correlated photons can be obtained. In 2006, two groups
following different experimental schemes succeeded in getting photon pairs to satisfy entanglement
CH024-I046325.indd 737CH024-I046325.indd 737 6/25/2008 11:13:16 AM6/25/2008 11:13:16 AM
738 Handbook of Self Assembled Semiconductor Nanostructures for Novel Devices in Photonics and Electronics
conditions. Akopian et al . applied spectral fi ltering to erase the energy “ which path ” information
[147] . The spectra of biexcitonic and monoexcitonic emission are composed of two lines corre-
sponding to the horizonal and vertical polarization. The detuning between the two lines being lower
that the linewidth of each line, a monochromator with a spectral resolution lower than the width
of the spectral common part of lines project the photons in the same energy state whatever their
polarization may be. Stevenson et al . were the fi rst to carefully grow epitaxially quantum dots in
order to suppress the splitting due the anisotropy of the structure [148, 149] . Alternatively, they
applied a magnetic fi eld to tune to zero the splitting between monoexcitonic states.
24.7.3 Entangled photon pair generation by CdSe quantum dots
In the case of colloidal nanocrystals, the effi ciency of Auger effects must be reduced to detect
multiexcitonic emission at the single-molecule level. Fisher et al . used nanocrystals with a large
radius greater than 5 nm [66] . According to the volume proportionality of Auger lifetime, the
biexcitonic lifetime becomes of the order of 1 ns. This long lifetime enables the observation of
biexcitonic (and even triexcitonic) emission with a quantum effi ciency of the order of 10%. At
room temperature, the authors demonstrate time correlations between the various emissions.
These results could be the fi rst step towards the generation of entangled photons. As for epi-
taxially grown quantum dots, the next step consists in getting the degeneracy of the two states
corresponding to bright monoexcitons. In the fi rst approximation, the two levels can be consid-
ered as degenerated (see section 24.3). However, Furis et al . recently reported results concerning
polarization resolved resonant photoluminescence spectroscopy of these states [75] . The meas-
ured intrinsic fi ne structure exhibits a splitting between the bright excitons which ranges from
1.1 to 2.0 meV depending on the size of the quantum dot. This splitting is much greater than the
corresponding splitting measured for CdSe epitaxially grown quantum dots (of the order of 100
μ eV) and comes from the very small size of colloidal quantum dots which enhances anistropic
exchange terms. This clear drawback in the perspective of getting bright exciton degeneracy may
be balanced by the great spectral diffusion observed in colloidal quantum dots (typically several
meV at room temperature) which may enable the spectral fi ltering technique used for epi-taxially
grown quantum dots.
Finally, radiative multiexcitonic emission could also be obtained by using type II colloidal semi-
conductor quantum dots [150] . Recently synthetized, CdTe/CdSe, core–shell nanocrystals are an
example of such a type II structure. When compared to standard CdSe quantum dots (denoted as
type I structures), the crucial difference relies on the localization of the charges. Due to the rela-
tive position of CdTe and CdSe conduction and valence bands, the hole is confi ned to the CdTe
core while the electron is confi ned to the CdSe shell when its thickness is greater than 1 nm. As a
result, the carrier wave function overlap is reduced, and the Auger lifetime, like the radiative life-
time, is increased. Moreover, the Auger lifetime no longer scales as the volume of the nanocrystal
and reaches values as high as 1 ns. The strong reduction of the effi ciency of Auger transitions,
even if it is at the cost of the reduction of the oscillator strength of the radiative transition, may
lead to an increase in the quantum effi ciency of radiative multiexcitonic recombinations. As a
result, this kind of structure, which opens new possibilities of quantum engineering, could be a
promising alternative to generate entangled photon pairs.
24.8 Controlling quantum dot emission with photonic structures
24.8.1 Cavity quantum electodynamics
Single photon emission by semiconductor nanocrystals comes from the discrete structure of the
quantum dot carrier energy levels. Their spontaneous emission behaviour, which corresponds to
the interaction between the emitter and the electromagnetic fi eld, depends also on their optical
environment – more precisely on the density of photonic states. This property is at the heart of
cavity quantum electrodynamics (CQED) experiments which consist in controlling the radiative
characteristics of an emitter using the modifi cation of the light mode characteristics induced by
CH024-I046325.indd 738CH024-I046325.indd 738 6/25/2008 11:13:16 AM6/25/2008 11:13:16 AM