Hahn Th. (ed.) International tables for crystallography. Vol. A. Space-group symmetry
Подождите немного. Документ загружается.

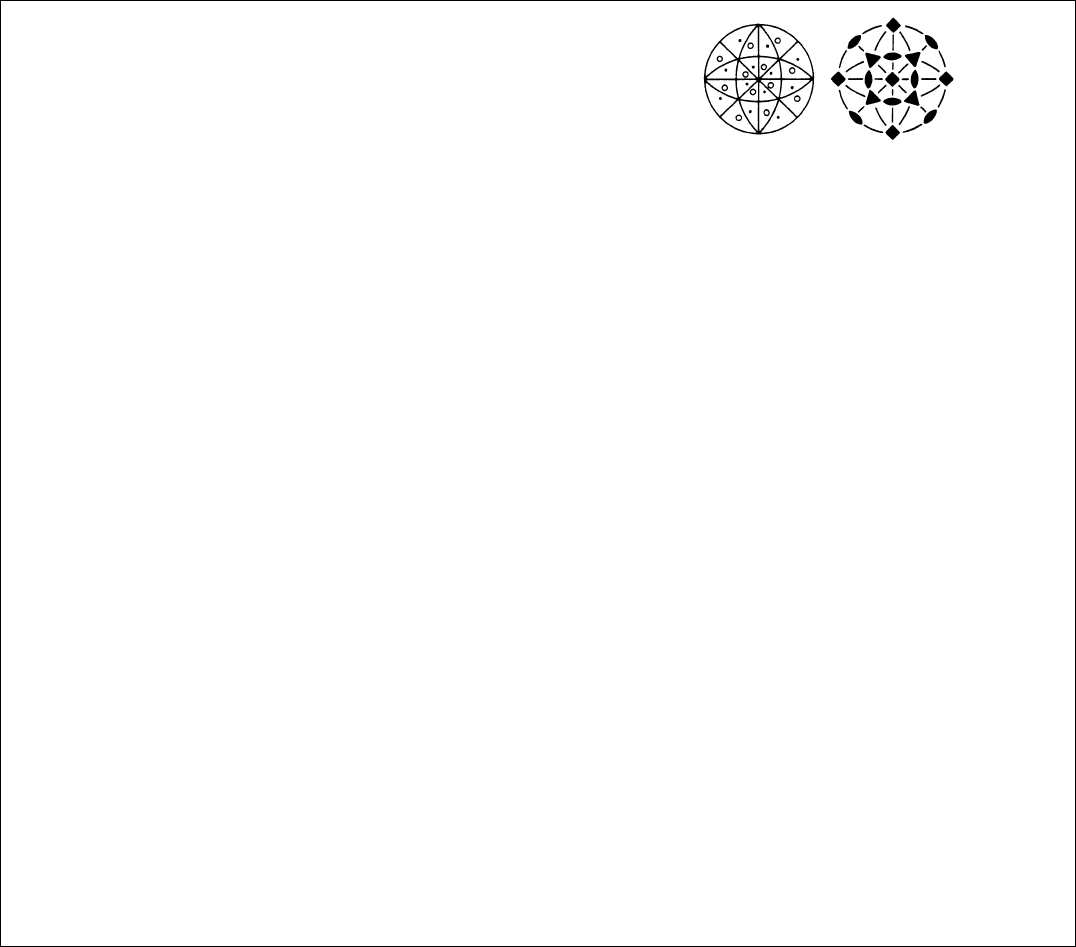
m
3
2
m
3
T
h
24 d 1
Didodecahedron or diploid
or dyakisdodecahedron
Cube & octahedron &
pentagon-dodecahedron l
hkl
h
kl
hk
lh
k
l
lhkl
h
k
l
hk
lh
k
klh
kl
hk
l
h
k
lh
h
k
lhk
lh
kl
hkl
l
h
k
lhk
lh
kl
hk
k
l
hk
lh
klhkl
h
Tetragon-trioctahedron or trapezohedron
or deltoid-icositetrahedron
(for jhj < jlj)
Cube & octahedron & rhomb-
dodecahedron
for jxj < jzj
Trigon-trioctahedron or trisoctahedron
(for jhj < jlj )
Cube truncated by octahedron
for jxj > jzj
8
>
>
>
>
>
>
>
>
>
>
>
>
>
>
<
>
>
>
>
>
>
>
>
>
>
>
>
>
>
:
9
>
>
>
>
>
>
>
>
>
>
>
>
>
>
=
>
>
>
>
>
>
>
>
>
>
>
>
>
>
;
hhl
h
hl
hh
lh
h
l
lhhl
h
h
l
hh
lh
h
hlh
hl
hh
l
h
h
lh
h
h
lhh
l
h
hl
hhl
l
h
h
lhhlh
hl
hh
h
l
hh
lh
hlhhl
h
12 cm..
Pentagon-dodecahedron
or dihexahedron or pyritohedron
Irregular icosahedron
pentagon-dodecahedron octahedronj
0kl0
kl0k
l0
k
l
l0kl0
k
l0k
l 0
k
kl0
kl0k
l0
k
l 0
Rhomb-dodecahedron
Cuboctahedron
0110
1101
10
1
1
10110
1
101
10
1
110
1101
10
1
10
8 b .3.
Octahedron
Cube i
111
1
11
11
11
1
1
1
1
1
11
11
11
111
6 a 2mm..
Cube or hexahedron
Octahedron e
100
100
0100
10
00100
1
Symmetry of special projections
Along 001 Along 111 Along 110
2mm 62mm
Table 10.1.2.2. The 32 three-dimensional crystallographic point groups ( cont.)
CUBIC SYSTEM (cont.)
787
10.1. CRYSTALLOGRAPHIC AND NONCRYSTALLOGRAPHIC POINT GROUPS
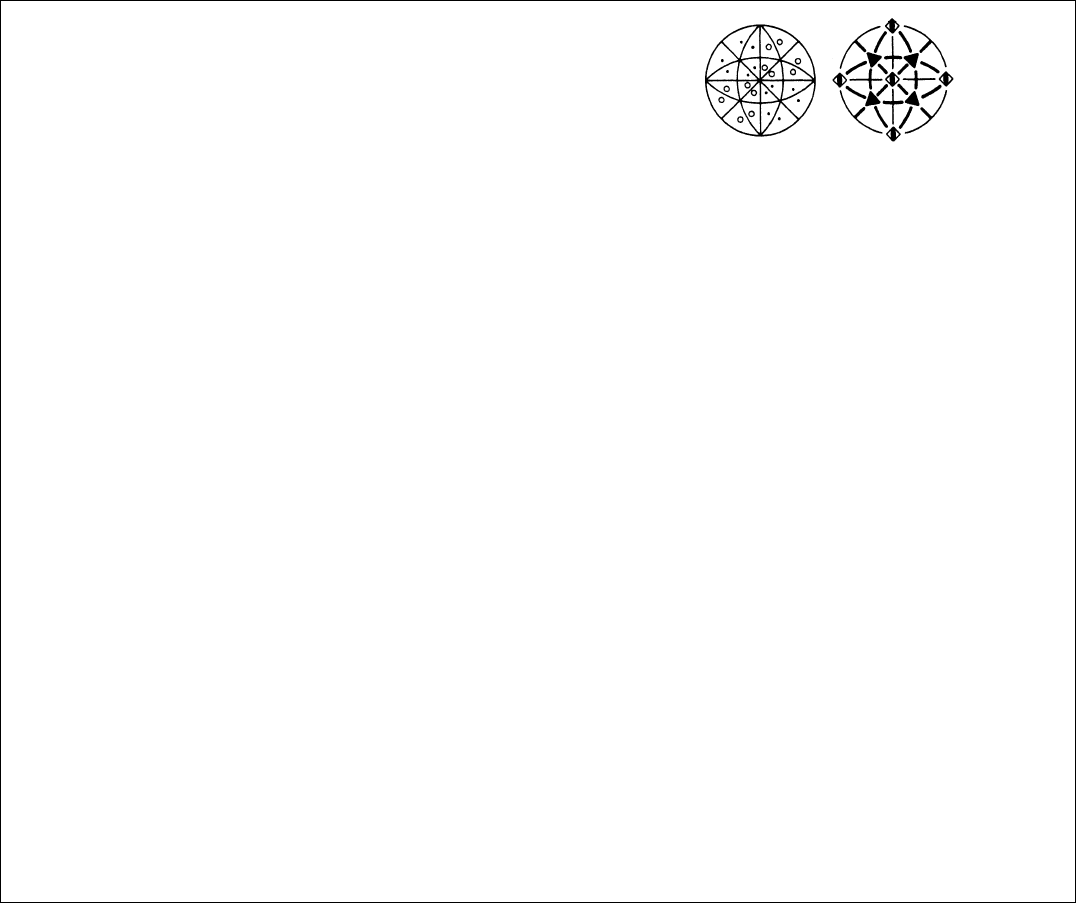
432 O
24 d 1
Pentagon-trioctahedron
or gyroid
or pentagon-icositetrahedron
Snub cube cube
octahedron pentagon-
trioctahedronk
hkl
h
kl
hk
lh
k
lkh
l
k
h
lk
hl
khl
lhkl
h
k
l
hk
lh
k
lkh
l
k
hlk
hl
kh
klh
kl
hk
l
h
k
lhh
lk
h
l
k
hlkhl
k
Tetragon-trioctahedron
or trapezohedron
or deltoid-icositetrahedron
(for jhj < jlj)
Cube & octahedron &
rhomb-dodecahedron
for jxj < jzj
Trigon-trioctahedron
or trisoctahedron
(for jhj > jlj
Cube truncated by octahedron
for jxj < jzj
8
>
>
>
>
>
>
>
>
>
>
>
>
>
>
>
>
>
>
>
>
<
>
>
>
>
>
>
>
>
>
>
>
>
>
>
>
>
>
>
>
>
:
9
>
>
>
>
>
>
>
>
>
>
>
>
>
>
>
>
>
>
>
>
=
>
>
>
>
>
>
>
>
>
>
>
>
>
>
>
>
>
>
>
>
;
hhl
h
hl
hh
lh
h
lhh
l
h
h
lh
hl
hhl
lhhl
h
h
l
hh
lh
h
lhh
l
h
hlh
hl
hh
hlh
hl
hh
l
h
h
lhh
lh
h
l
h
hlhhl
h
Tetrahexahedron
or tetrakishexahedron
Octahedron truncated by cube
0kl0
kl0k
l0
k
lk0
l
k0
l k
0l
k0l
l0kl0
k
l0k
l 0
k
lk0
l
k0lk0l
k0
kl0
kl0k
l0
k
l00
lk0
l
k0lk0l
k
12 c ..2
Rhomb-dodecahedron
Cuboctahedron i
0110
1101
10
1
1
10110
1
101
10
1
110
1101
10
1
10
8 b .3.
Octahedron
Cube g
111
1
11
11
11
1
1
1
1
111
11
11
111
6 a 4..
Cube or hexahedron
Octahedron e
100
100
010
0
10
00100
1
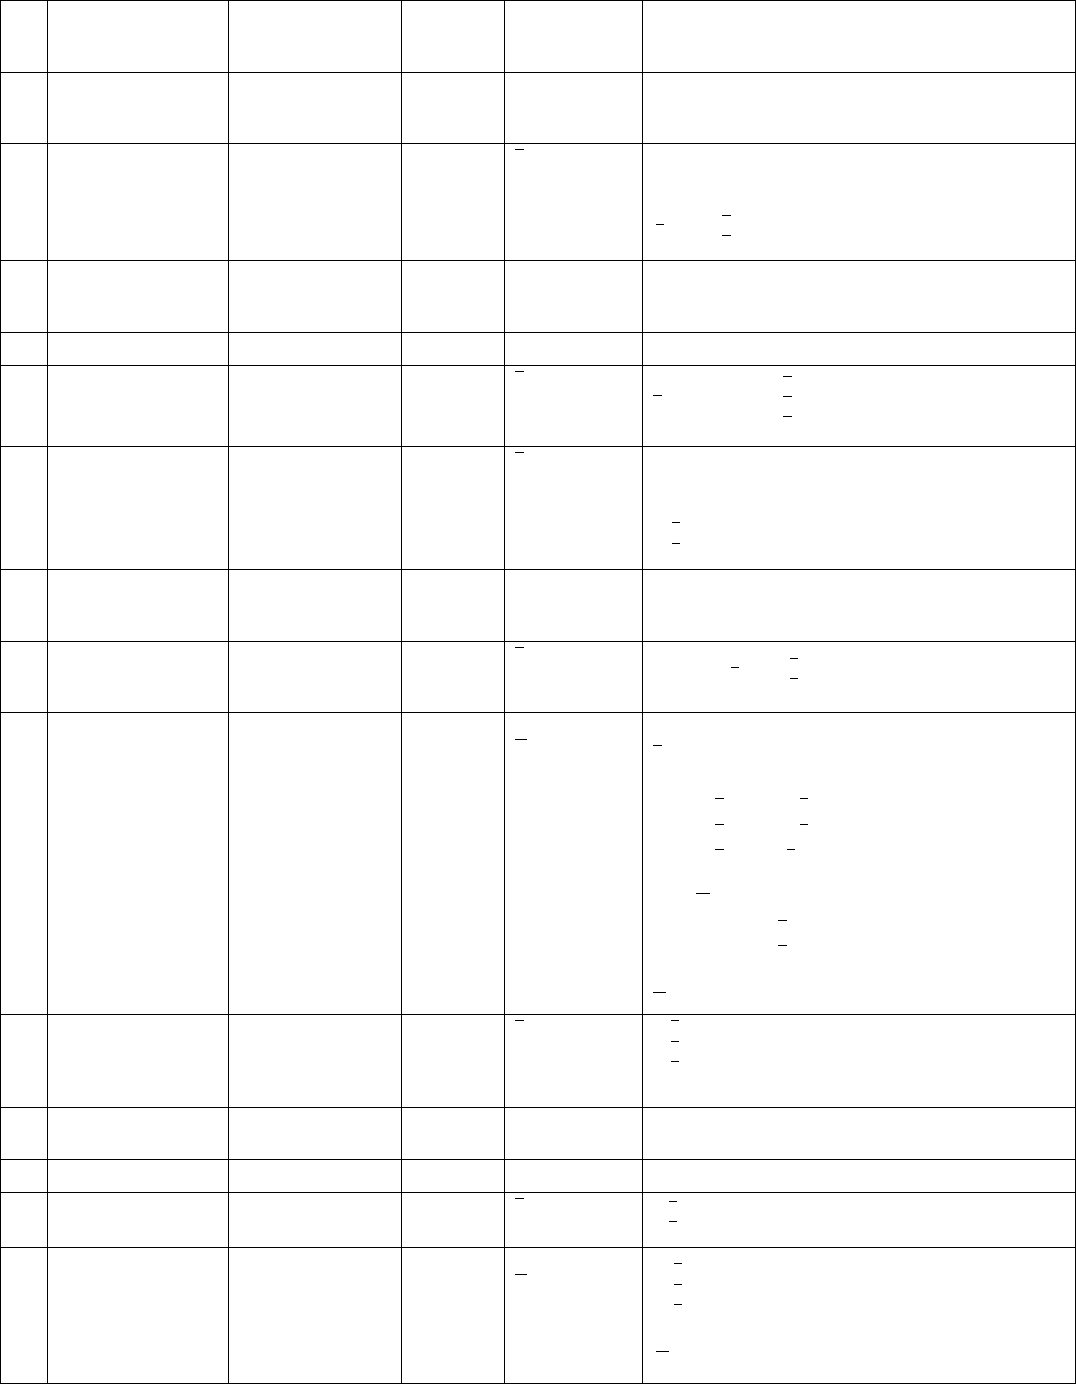
Symmetry of special projections
Along 001 Along 111 Along 110
4mm 3m 2 mm
Table 10.1.2.2. The 32 three-dimensional crystallographic point groups ( cont.)
CUBIC SYSTEM (cont.)
788
10. POINT GROUPS AND CRYSTAL CLASSES
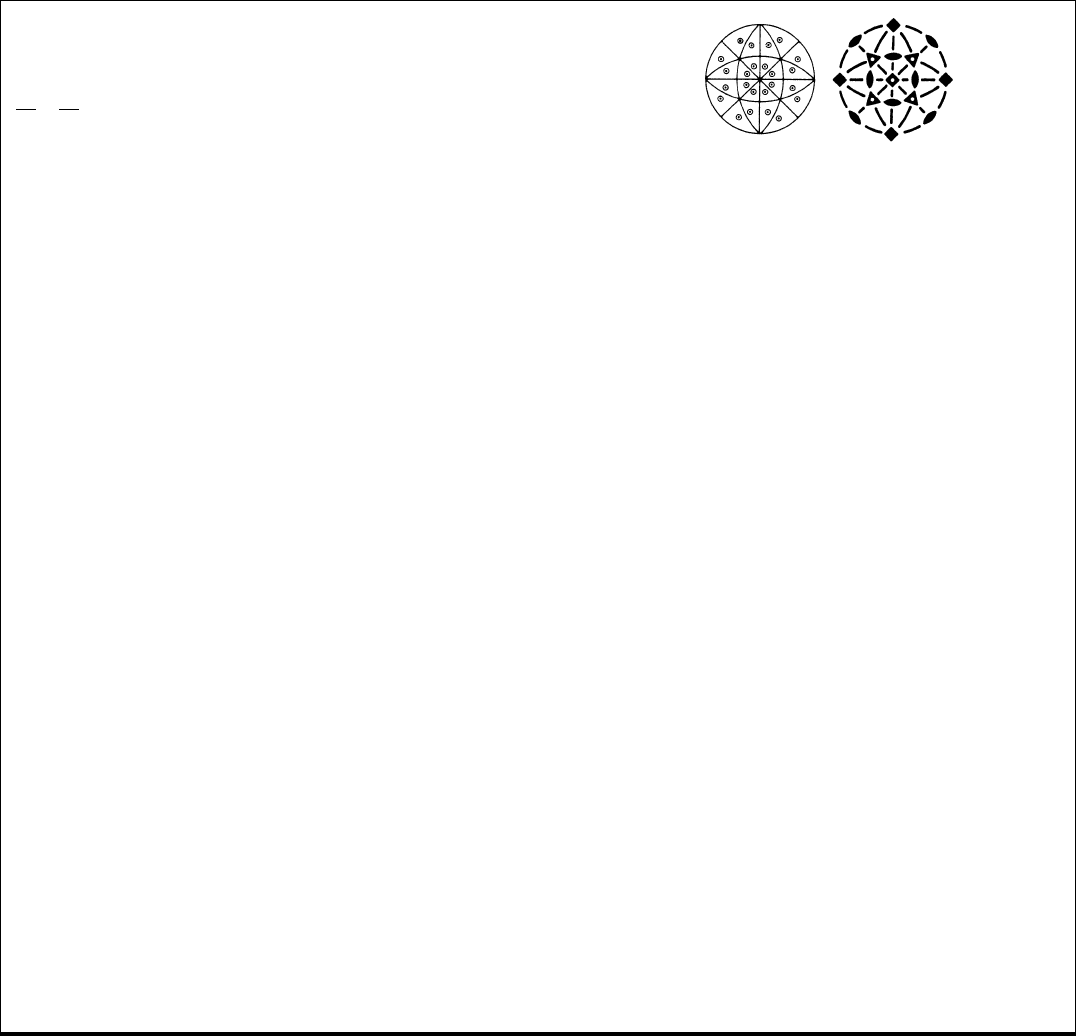
43mT
d
24 d 1
Hexatetrahedron
or hexakistetrahedron
Cube truncated by
two tetrahedra j
hkl
h
kl
hk
lh
k
lkhl
k
hlk
h
l
kh
l
lhkl
h
k
l
hk
lh
klkhl
k
h
lk
h
l
kh
klh
kl
hk
l
h
klhhlk
hl
k
h
lkh
l
k
Tetrahexahedron
or tetrakishexahedron
Octahedron truncated by cube
0kl0
kl0k
l0
k
lk0l
k0lk0
l
k0
l
l0kl0
k
l0k
l0
klk0 l
k0
lk0
l
k0
kl0
kl0k
l0
k
l00lk0l
k0
lk0
l
k
12 c ..m
Trigon-tritetrahedron
or tristetrahedron
(for jhj < jlj)
Tetrahedron truncated
by tetrahedron i
for jxj < jzj
Tetragon-tritetrahedron
or deltohedron
or deltoid-dodecahedron
(for jhj > jlj )
Cube & two tetrahedra i
for jxj > jzj
8
>
>
>
>
>
>
>
>
>
>
>
>
>
>
>
>
>
>
>
>
<
>
>
>
>
>
>
>
>
>
>
>
>
>
>
>
>
>
>
>
>
:
9
>
>
>
>
>
>
>
>
>
>
>
>
>
>
>
>
>
>
>
>
=
>
>
>
>
>
>
>
>
>
>
>
>
>
>
>
>
>
>
>
>
;
hhl
h
hl
hh
lh
h
l
lhhl
h
h
l
hh
lh
h
hlh
hl
hh
l
h
h
lh
Rhomb-dodecahedron
Cuboctahedron
110
1
10
1101
10
0110
1
10
1101
1
101
10
110
1
101
6 b 2.mm
Cube or hexahedron
Octahedron f
100
100
0100
10
001
00
1
4 a .3m
Tetrahedron
Tetrahedron e
111
1
11
11
11
1
1
or
1
1
111
11
11
111
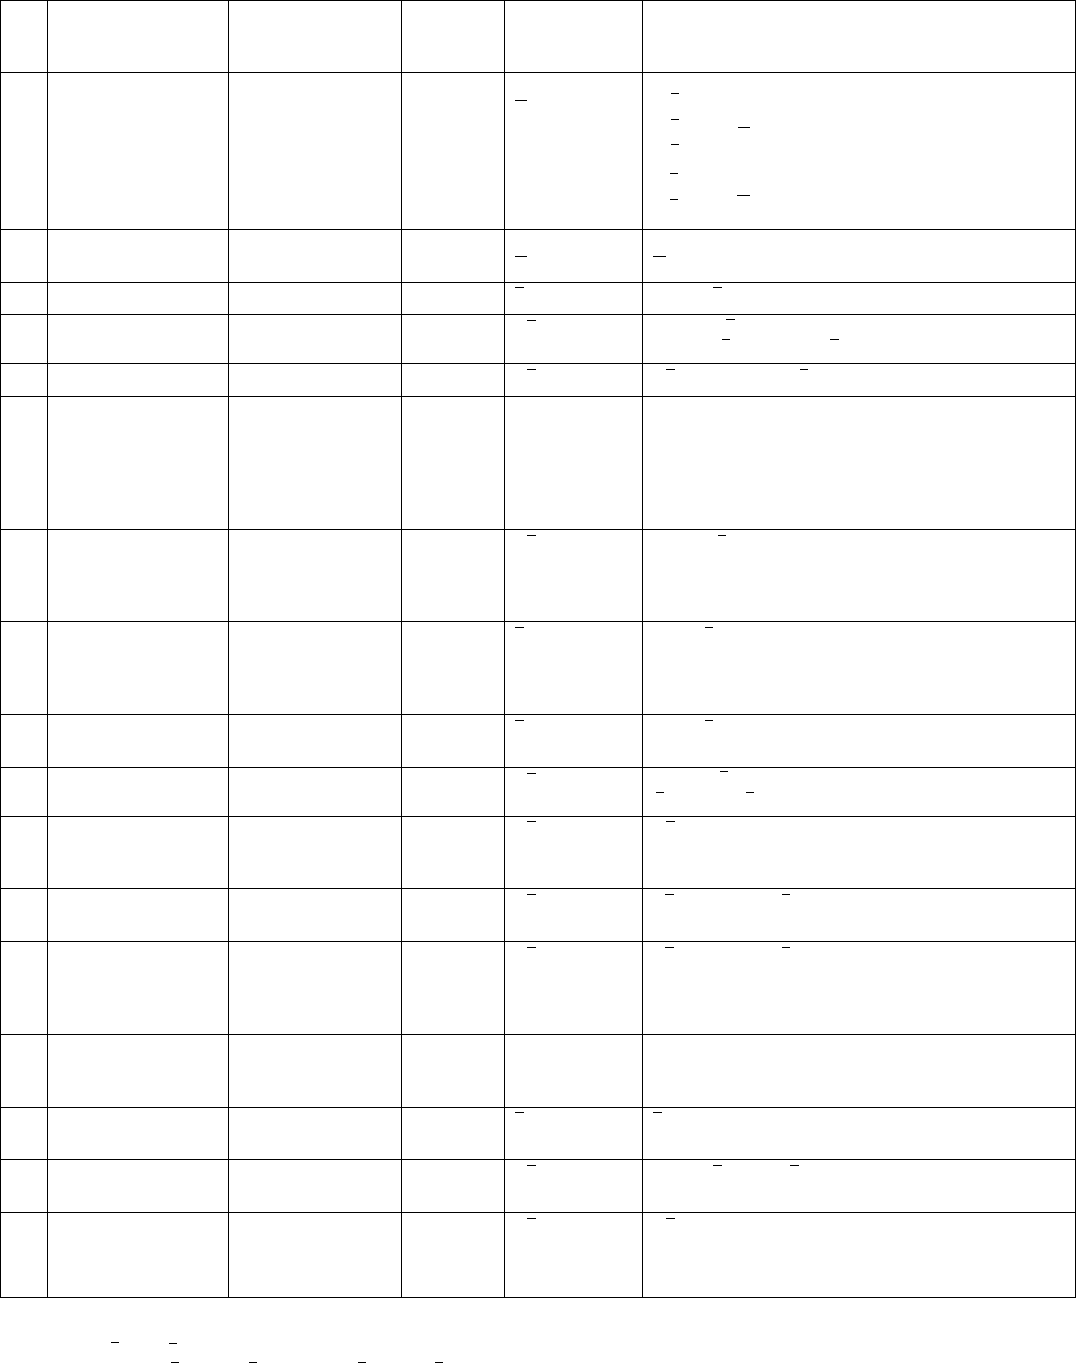
Symmetry of special projections
Along 001 Along 111 Along 110
4mm 3mm
Table 10.1.2.2. The 32 three-dimensional crystallographic point groups ( cont.)
CUBIC SYSTEM (cont.)
789
10.1. CRYSTALLOGRAPHIC AND NONCRYSTALLOGRAPHIC POINT GROUPS
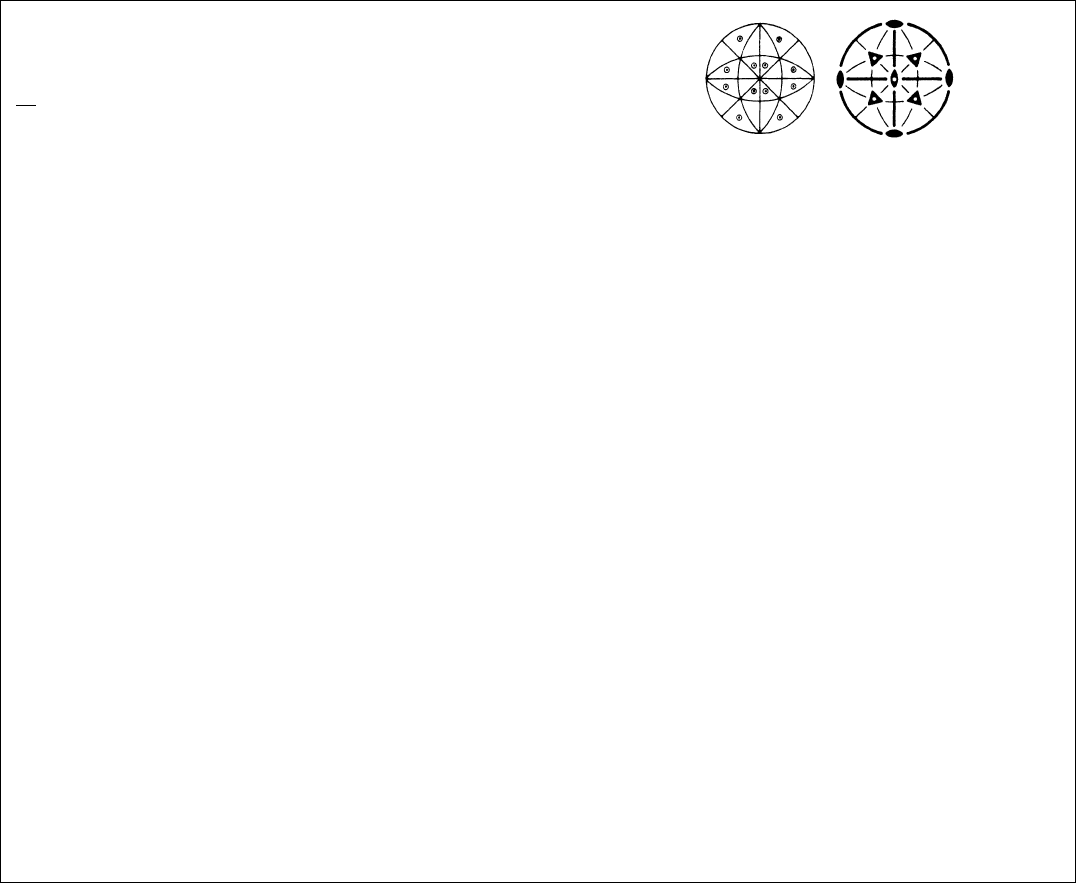
m
3m
4
m
3
2
m
O
h
48 fl
Hexaoctahedron
or hexakisoctahedron
Cube truncated by
octahedron and by rhomb-
dodecahedron n
hkl
h
kl
hk
lh
k
lkh
l
k
h
lk
hl
khl
lhkl
h
k
l
hk
lh
k
lkh
l
k
hlk
hl
kh
klh
kl
hk
l
h
k
lhh
lk
h
l
k
hlkhl
k
h
k
lhk
lh
kl
hkl
k
hlkhl
kh
lk
h
l
l
h
k
lhklh
kl
hkl
k
hlkh
l
kh
lk
h
k
l
hk
lh
klhkl
h
hl
khlkh
l
k
h
lk
24 e ..m
Tetragon-trioctahedron
or trapezohedron
or deltoid-icositetrahedron
(for jhj < jlj )
Cube & octahedron & rhomb-
dodecahedron m
for jxj < jzj
Trigon-trioctahedron
or trisoctahedron
(for jhj > jlj
Cube truncated by
octahedron m
for jxj < jzj
8
>
>
>
>
>
>
>
>
>
>
>
>
>
>
>
>
>
>
>
>
>
>
<
>
>
>
>
>
>
>
>
>
>
>
>
>
>
>
>
>
>
>
>
>
>
:
9
>
>
>
>
>
>
>
>
>
>
>
>
>
>
>
>
>
>
>
>
>
>
=
>
>
>
>
>
>
>
>
>
>
>
>
>
>
>
>
>
>
>
>
>
>
;
hhl
h
hl
hh
lh
h
lhh
l
h
h
lh
hl
hhl
lhhl
h
h
l
hh
lh
h
lhh
l
h
hlh
hl
hh
hlh
hl
hh
l
h
h
lhh
lh
h
l
h
hlhhl
h
24 dm..
Tetrahexahedron
or tetrakishexahedron
Octahedron truncated
by cube k
0kl0
kl
0k
l0
k
lk0
l
k0
lk0l
k0l
l0kl0
k
l0k
l0
k
lk0
l
k0lk0l
k0
kl0
kl0k
l0
k
l 00
lk0
l
k0
lk0l
k
12 cm.m2
Rhomb-dodecahedron
Cuboctahedron i
0110
1101
10
1
1
10110
1
101
10
1
110
1101
10
1
10
8 b .3m
Octahedron
Cube g
111
1
11
11
11
1
111
1
1
1
1
1
11
111
6 a 4 m.m
Cube or hexahedron
Octahedron e
100
100
0100
10
00100
1
Symmetry of special projections
Along 001 Along 111 Along 110
4mm 6mm 2mm
Table 10.1.2.2. The 32 three-dimensional crystallographic point groups ( cont.)
CUBIC SYSTEM (cont.)
790
10. POINT GROUPS AND CRYSTAL CLASSES
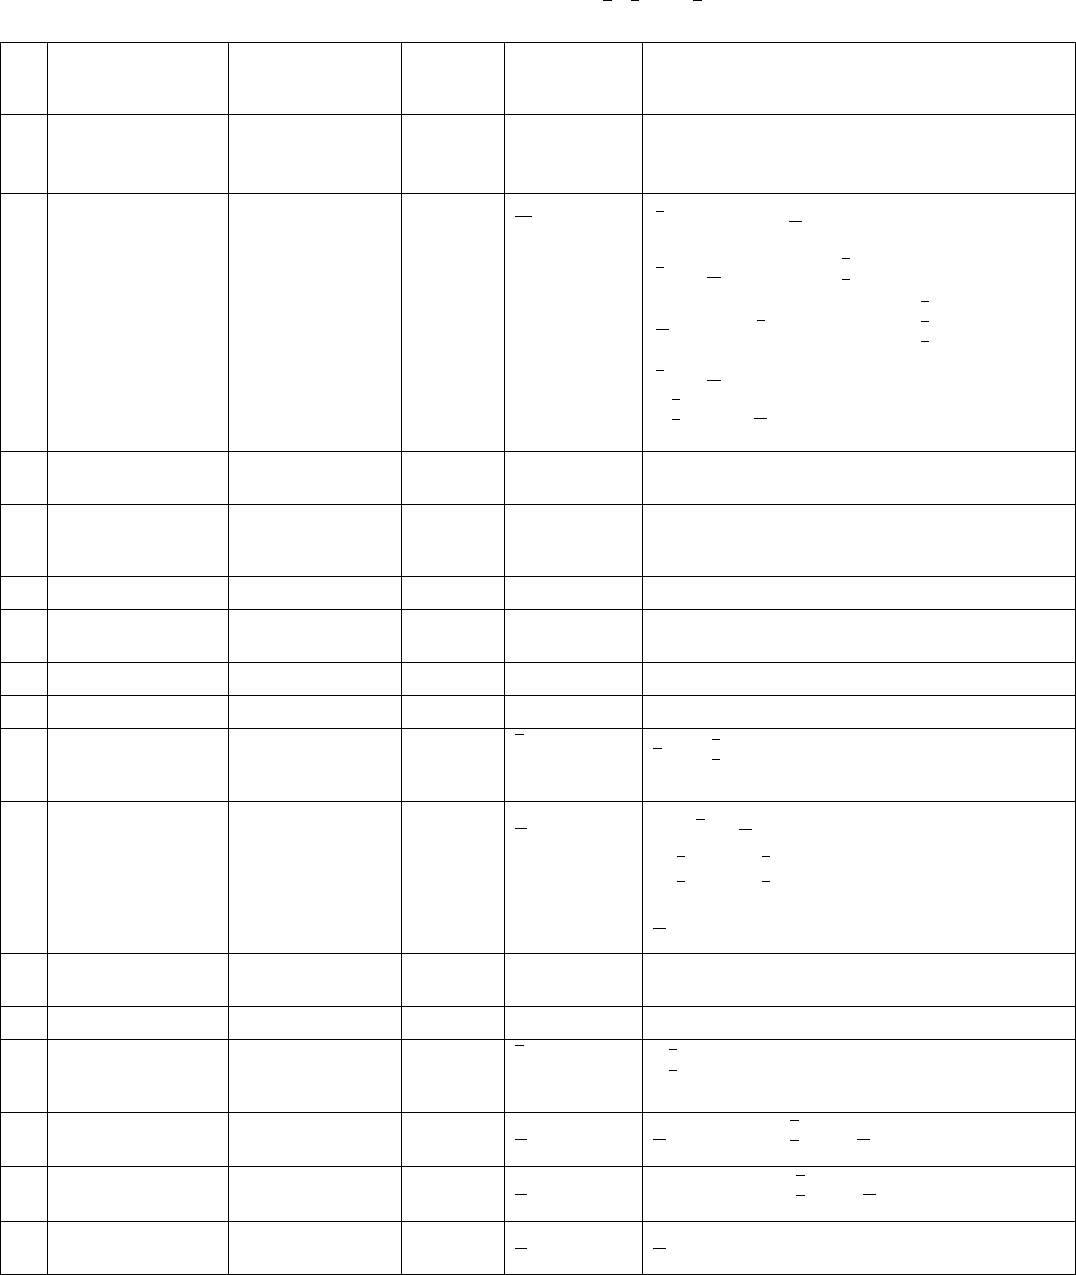
Table 10.1.2.3. The 47 crystallographic face and point forms, their names, eigensymmetries, and their occurrence in the
crystallographic point groups (generating point groups)
The oriented face (site) symmetries of the forms are given in parentheses after the Hermann–Mauguin symbol (column 6); a symbol such as mm2:m:, m::
indicates that the form occurs in point group mm2 twice, with face (site) symmetries .m. and m... Basic (general and special) forms are printed in bold face, limiting
(general and special) forms in normal type. The various settings of point groups 32, 3m,
3m, 42m and 6m2 are connected by braces.
No. Crystal form Point form
Number of
faces or
points Eigensymmetry
Generating point groups with oriented face (site)
symmetries between parentheses
1 Pedion or monohedron Single point 1 1m
11; 22; mm; 33; 44;
66; mm2mm2; 4mm4mm;
3m3m; 6mm6mm
2 Pinacoid or
parallelohedron
Line segment through
origin
2
1
m
m
11; 21; m1;
2
m
2.m; 2222.., .2., ..2;
mm2:m:, m::; mmm2mm, m2m, mm2;
42..;
4
m
4..; 4224..,
42m2.mm
4m22mm.
;
4
m
mm4mm;
33..;
3213..
3123..;
32 3.
8
<
:
3m13m.
31m3.m;
3m13m
8
<
:
63..;
6
m
6..; 6226..;
6m23m.
62m3.m
;
6
m
mm6mm
3 Sphenoid, dome, or
dihedron
Line segment 2 mm2 21; m1; mm2.m., m..
4 Rhombic disphenoid
or rhombic
tetrahedron
Rhombic tetrahedron 4 222 2221
5 Rhombic pyramid Rectangle 4 mm2 mm21
6 Rhombic prism Rectangle through
origin
4 mmm 2=m1; 2221*; mm21; mmmm.., .m., ..m
7 Rhombic dipyramid Quad 8 mmm mmm1
8 Tetragonal pyramid Square 4 4mm 41; 4mm..m, .m.
9 Tetragonal disphenoid
or tetragonal
tetrahedron
Tetragonal
tetrahedron
4 42m
41;
42m..m
4m2.m.
10 Tetragonal prism Square through origin 4
4
m
mm
41;
41;
4
m
m..; 422..2, .2.; 4mm::m, :m:;
y
42m.2. & 42m::m
4m2..2 & 4m2:m:
(
;
4
m
mmm.m2, m2m.
11 Tetragonal
trapezohedron
Twisted tetragonal
antiprism
8 422 4221
12 Ditetragonal pyramid Truncated square 8 4mm 4mm1
13 Tetragonal
scalenohedron
Tetragonal
tetrahedron cut off
by pinacoid
8
42m
42m1
4m21
14 Tetragonal dipyramid Tetragonal prism 8
4
m
mm
4
m
1; 4221*; †
42m1
4m21
;
4
m
mm.m, .m.
15 Ditetragonal prism Truncated square
through origin
8
4
m
mm 4221; 4mm1;
42m1
4m21
;
4
m
mmm..
16 Ditetragonal dipyramid Edge-truncated
tetragonal prism
16
4
m
mm
4
m
mm1
791
10.1. CRYSTALLOGRAPHIC AND NONCRYSTALLOGRAPHIC POINT GROUPS
No. Crystal form Point form
Number of
faces or
points Eigensymmetry
Generating point groups with oriented face (site)
symmetries between parentheses
17 Trigonal pyramid Trigon 3 3m
31;
3m1.m.
31m..m
3m .m
8
<
:
18 Trigonal prism Trigon through origin 3
62m
31;
321.2.
312..2;
32 .2
8
<
:
3m1:m:
31m::m;
3m :m
8
<
:
6m..;
6m2mm2
62mm2m
19 Trigonal
trapezohedron
Twisted trigonal
antiprism
632
3211
3121
32 1
8
<
:
20 Ditrigonal pyramid Truncated trigon 6 3m 3m1
21 Rhombohedron Trigonal antiprism 6
3m
31;
3211
3121;
32 1
8
<
:
3m1.m.
31m..m
3m .m
8
<
:
22 Ditrigonal prism Truncated trigon
through origin
6
62m
3211
3121;
32 1
8
<
:
3m11
31m1;
3m 1
8
<
:
6m2m..
62mm..
23 Hexagonal pyramid Hexagon 6 6mm
3m11
31m1;
3m 1
8
<
:
61; 6mm..m, .m.
24 Trigonal dipyramid Trigonal prism 6
62m
3211
3121;
32 1
8
<
:
61;
6m2.m.
62m..m
25 Hexagonal prism Hexagon through
origin
6
6
m
mm
31;
3211
3121;
32 1
8
>
<
>
:
3m11
31m1
3m 1
8
>
<
>
:
y
3m1.2. & 3m1:m:
31m..2 & 31m::m;
3m.2 & 3m:m
8
>
<
>
:
61;
6
m
m..; 622.2., ..2;
6mm::m, :m:;
6m2m::
62mm::
(
;
6
m
mmm2m, mm2
26 Ditrigonal
scalenohedron or
hexagonal
scalenohedron
Trigonal antiprism
sliced off by
pinacoid
12
3m
3m11
31m1
3m 1
8
<
:
27 Hexagonal
trapezohedron
Twisted hexagonal
antiprism
12 622 6221
28 Dihexagonal pyramid Truncated hexagon 12 6mm 6mm1
29 Ditrigonal dipyramid Edge-truncated
trigonal prism
12
62m
6m21
62m1
30 Dihexagonal prism Truncated hexagon 12
6
m
mm
3m11
31m1;
3m 1
8
<
:
6221; 6mm1;
6
m
mmm..
Table 10.1.2.3. The 47 crystallographic face and point forms, their names, eigensymmetries, and their occurrence in the
crystallographic point groups (generating point groups) (cont.)
792
10. POINT GROUPS AND CRYSTAL CLASSES
No. Crystal form Point form
Number of
faces or
points Eigensymmetry
Generating point groups with oriented face (site)
symmetries between parentheses
31 Hexagonal dipyramid Hexagonal prism 12
6
m
mm
3m11
31m1;
3m 1
8
>
<
>
:
6
m
1; 6221
;
6m21
62m1
(
;
6
m
mm..m, .m.
32 Dihexagonal
dipyramid
Edge-truncated
hexagonal prism
24
6
m
mm
6
m
mm1
33 Tetrahedron Tetrahedron 4
43m 23.3.; 43m.3m
34 Cube or hexahedron Octahedron 6 m
3m
232..; m
32mm..;
4324..;
43m2.mm; m3m4m.m
35 Octahedron Cube 8 m
3m m3.3.; 432.3.; m3m.3m
36 Pentagon-
tritetrahedron or
tetartoid or
tetrahedral
pentagon-
dodecahedron
Snub tetrahedron
(=pentagon-
tritetrahedron +
two tetrahedra)
12 23 231
37 Pentagon-
dodecahedron or
dihexahedron or
pyritohedron
Irregular icosahedron
(= pentagon-
dodecahedron +
octahedron)
12 m
3231; m3m..
38 Tetragon-tritetrahedron
or deltohedron or
deltoid-
dodecahedron
Cube and two
tetrahedra
12
43m 231; 43m..m
39 Trigon-tritetrahedron
or tristetrahedron
Tetrahedron truncated
by tetrahedron
12
43m 231; 43m..m
40 Rhomb-dodecahedron Cuboctahedron 12 m
3m
231; m
3m::; 432..2;
43m::m; m3mm.m2
41 Didodecahedron or
diploid or
dyakisdodecahedron
Cube & octahedron
& pentagon-
dodecahedron
24 m
3 m31
42 Trigon-trioctahedron
or trisoctahedron
Cube truncated by
octahedron
24 m
3mm31; 4321; m3m..m
43 Tetragon-trioctahedron
or trapezohedron or
deltoid-
icositetrahedron
Cube & octahedron
& rhomb-
dodecahedron
24 m
3mm31; 4321; m3m..m
44 Pentagon-trioctahedron
or gyroid
Cube + octahedron +
pentagon-
trioctahedron
24 432 4321
45 Hexatetrahedron or
hexakistetrahedron
Cube truncated by
two tetrahedra
24
43m 43m1
46 Tetrahexahedron or
tetrakishexahedron
Octahedron truncated
by cube
24 m
3m 4321; 43m1; m3mm..
47 Hexaoctahe dron or
hexakisoctahedron
Cube truncated by
octahedron and by
rhomb-
dodecahedron
48 m
3m m3m1
* These limiting forms occur in three or two non-equivalent orientations (different types of limiting forms); cf. Table 10.1.2.2.
† In point groups
42m and 3m, the tetragonal prism and the hexagonal prism occur twice, as a ‘basic special form’ and as a ‘limiting special form’. In these cases, the point
groups are listed twice, as
42m.2. & 42m::m and as 3m1.2. & 3m1:m:.
Table 10.1.2.3. The 47 crystallographic face and point forms, their names, eigensymmetries, and their occurrence in the
crystallographic point groups (generating point groups) (cont.)
793
10.1. CRYSTALLOGRAPHIC AND NONCRYSTALLOGRAPHIC POINT GROUPS
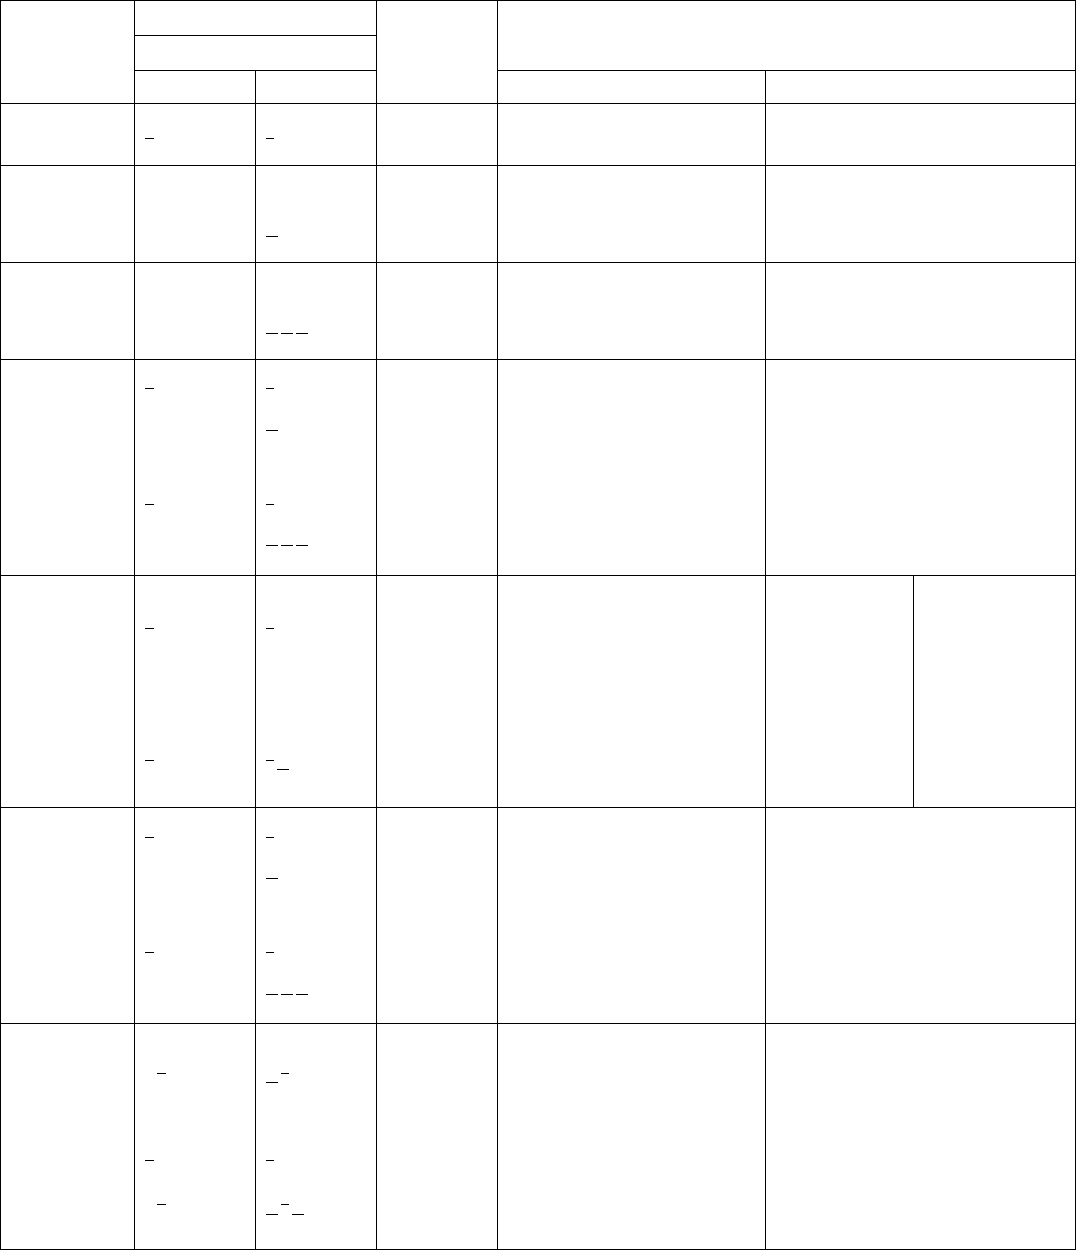
Table 10.1.2.4. Names and symbols of the 32 crystal classes
Point group
System used in
this volume
International symbol
Schoenflies
symbol
Class names
Short Full Groth (1921) Friedel (1926)
Triclinic 1 1 C
1
Pedial (asymmetric) Hemihedry
1 1 C
i
S
2
Pinacoidal Holohedry
Monoclinic 2 2 C
2
Sphenoidal Holoaxial hemihedry
mmC
s
C
1h
Domatic Antihemihedry
2=m
2
m
C
2h
Prismatic Holohedry
Orthorhombic 222 222 D
2
V Disphenoidal Holoaxial hemihedry
mm2 mm2 C
2v
Pyramidal Antihemihedry
mmm
2
m
2
m
2
m
D
2h
V
h
Dipyramidal Holohedry
Tetragonal 4 4 C
4
Pyramidal Tetartohedry with 4-axis
4 4 S
4
Disphenoidal Sphenohedral tetartohedry
4=m
4
m
C
4h
Dipyramidal Parahemihedry
422 422 D
4
Trapezohedral Holoaxial hemihedry
4mm 4mm C
4v
Ditetragonal-pyramidal Antihemihedry with 4-axis
42m 42mD
2d
V
d
Scalenohedral Sphenohedral antihemihedry
4/mmm
4
m
2
m
2
m
D
4h
Ditetragonal-dipyramidal Holohedry
Hexagonal Rhombohedral
Trigonal 3 3 C
3
Pyramidal Ogdohedry Tetartohedry
3 3 C
3i
S
6
Rhombohedral Paratetartohedry Parahemihedry
32 32 D
3
Trapezohedral Holoaxial
tetartohedry
with 3-axis
Holoaxial
hemihedry
3m 3mC
3v
Ditrigonal-pyramidal Hemimorphic
antitetartohedry
Antihemihedry
3m 3
2
m
D
3d
Ditrigonal-scalenohedral Parahemihedry
with 3-axis
Holohedry
Hexagonal 6 6 C
6
Pyramidal Tetartohedry with 6-axis
6 6 C
3h
Trigonal-dipyramidal Trigonohedral antitetartohedry
6=m
6
m
C
6h
Dipyramidal Parahemihedry with 6-axis
622 622 D
6
Trapezohedral Holoaxial hemihedry
6mm 6mm C
6v
Dihexagonal-pyramidal Antihemihedry with 6-axis
62m 62mD
3h
Ditrigonal-dipyramidal Trigonohedral antihemihedry
6=mmm
6
m
2
m
2
m
D
6h
Dihexagonal-dipyramidal Holohedry
Cubic 23 23 T
Tetrahedral-pentagondodecahedral
tetartoidal
Tetartohedry
m
3
2
m
3 T
h
Disdodecahedral
diploidal
Parahemihedry
432 432 O
Pentagon-icositetrahedral
gyroidal
Holoaxial hemihedry
43m 43mT
d
Hexakistetrahedral
hextetrahedral
Antihemihedry
m
3m
4
m
3
2
m
O
h
Hexakisoctahedral
hexoctahedral
Holohedry
794
10. POINT GROUPS AND CRYSTAL CLASSES
(2) In point group 32, the general form is a trigonal trapezohedron
fhklg; this form can be considered as two opposite trigonal
pyramids, rotated with respect to each other by an angle . The
trapezohedron changes into the limiting forms ‘trigonal dipyr-
amid’ fhhlgfor 0
and ‘rhombohedron’ fh0lg for 60
.
(vii) One and the same type of polyhedron can occur as a general,
special or limiting form.
Examples
(1) A tetragonal dipyramid is a general form in point group 4=m,a
special form in point group 4=mmm and a limiting general form
in point groups 422 and
42m.
(2) A tetragonal prism appears in point group
42m both as a basic
special form (4b) and as a limiting special form (4c).
(viii) A peculiarity occurs for the cubic point groups. Here the
crystal forms f hhlg are realized as two topologically different kinds
of polyhedra with the same face symmetry, multiplicity and, in
addition, the same eigensymmetry. The realization of one or other of
these forms depends upon whether the Miller indices obey the
conditions jhj > jlj or jhj < jlj, i.e. whether, in the stereographic
projection, a face pole is located between the directions [110] and
[111] or between the directions [111] and [001]. These two kinds of
polyhedra have to be considered as two realizations of one type of
crystal form because their face poles are located on the same set of
conjugate symmetry elements. Similar considerations apply to the
point forms x, x, z.
In the point groups m
3m and 43m, the two kinds of polyhedra
represent two realizations of one special ‘Wyckoff position’; hence,
they have the same Wyckoff letter. In the groups 23, m
3 and 432,
they represent two realizations of the same type of limiting general
forms. In the tables of the cubic point groups, the two entries are
always connected by braces.
The same kind of peculiarity occurs for the two icosahedral point
groups, as mentioned in Section 10.1.4 and listed in Table 10.1.4.3.
10.1.2.5. Names and symbols of the crystal classes
Several different sets of names have been devised for the 32
crystal classes. Their use, however, has greatly declined since the
introduction of the international point-group symbols. As examples,
two sets (both translated into English) that are frequently found in
the literature are given in Table 10.1.2.4. To the name of the class
the name of the system has to be added: e.g. ‘tetragonal pyramidal’
or ‘tetragonal tetartohedry’.
Note that Friedel (1926) based his nomenclature on the point
symmetry of the lattice. Hence, two names are given for the five
trigonal point groups, depending whether the lattice is hexagonal or
rhombohedral: e.g. ‘hexagonal ogdohedry’ and ‘rhombohedral
tetartohedry’.
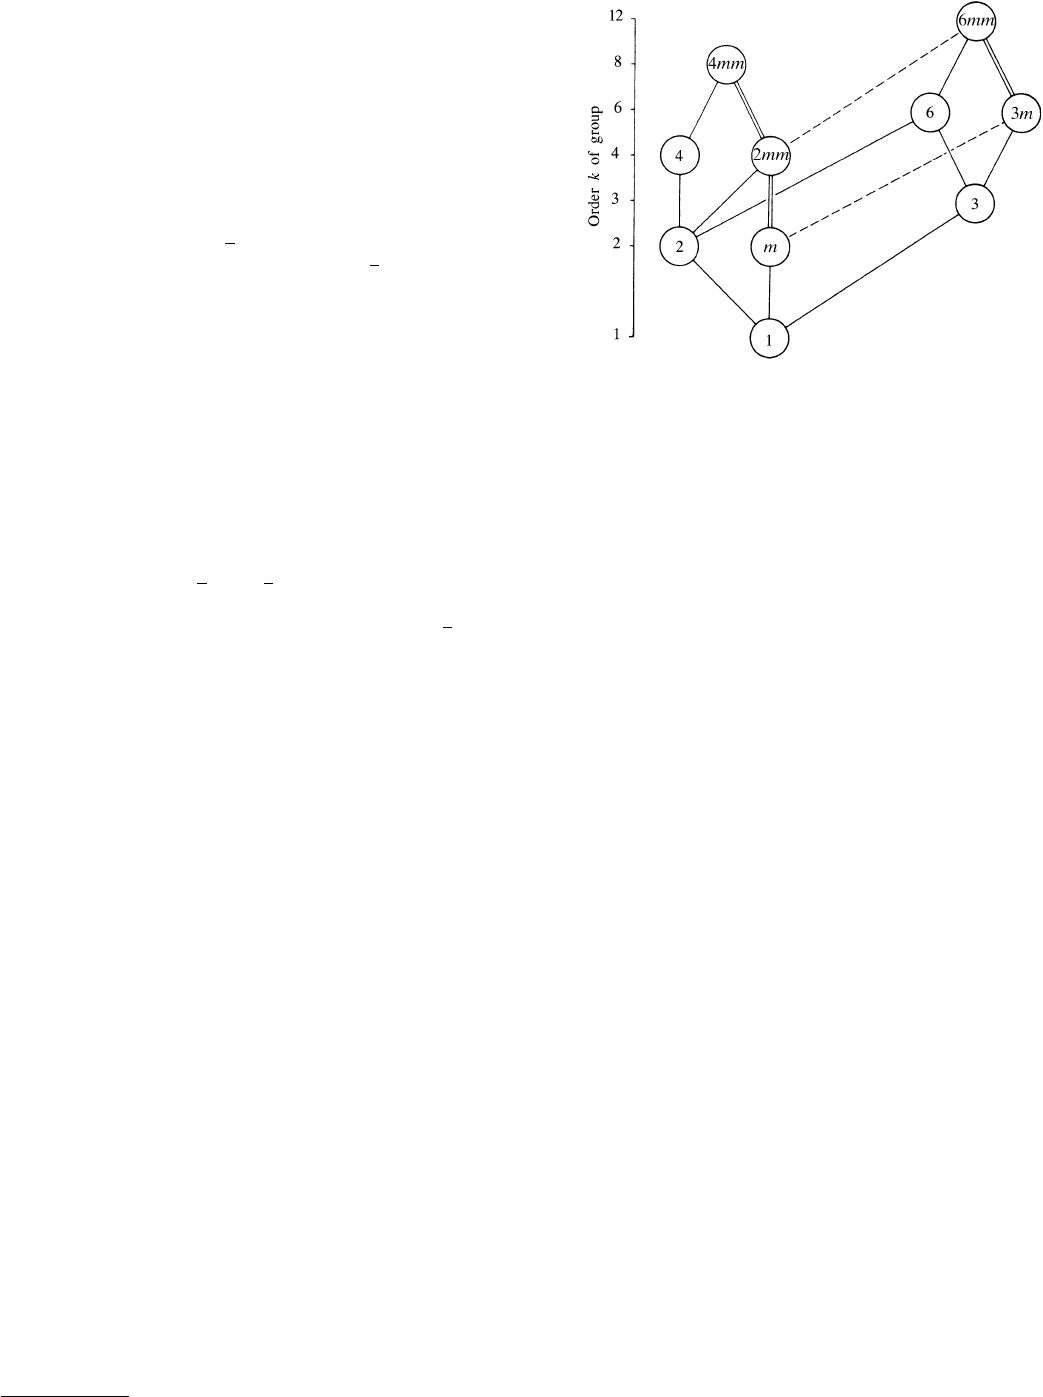
10.1.3. Subgroups and supergroups of the
crystallographic point groups
In this section, the sub- and supergroup relations between the
crystallographic point groups are presented in the form of a ‘family
tree’.* Figs. 10.1.3.1 and 10.1.3.2 apply to two and three
dimensions. The sub- and supergroup relations between two groups
are represented by solid or dashed lines. For a given point group P
of order k
P
the lines to groups of lower order connect P with all its
maximal subgroups H with orders k
H
; the index [i] of each
subgroup is given by the ratio of the orders k
P
=k
H
. The lines to
groups of higher order connect P with all its minimal supergroups S
with orders k
S
; the index [i ] of each supergroup is given by the ratio
k
S
=k
P
. In other words: if the diagram is read downwards, subgroup
relations are displayed; if it is read upwards, supergroup relations
are revealed. The index is always an integer (theorem of Lagrange)
and can be easily obtained from the group orders given on the left of
the diagrams. The highest index of a maximal subgroup is [3] for
two dimensions and [4] for three dimensions.
Two important kinds of subgroups, namely sets of conjugate
subgroups and normal subgroups, are distinguished by dashed and
solid lines. They are characterized as follows:
The subgroups H
1
, H
2
, ..., H
n
of a group P are conjugate
subgroups if H
1
, H
2
, ..., H
n
are symmetrically equivalent in P, i.e.
if for every pair H
i
, H
j
at least one symmetry operation
W
of P
exists which maps H
i
onto H
j
:
W
1
H
i
W
H
j
; cf. Section 8.3.6.
Examples
(1) Point group 3 m has three different mirror planes which are
equivalent due to the threefold axis. In each of the three
maximal subgroups of type m, one of these mirror planes is
retained. Hence, the three subgroups m are conjugate in 3m.
This set of conjugate subgroups is represented by one dashed
line in Figs. 10.1.3.1 and 10.1.3.2.
(2) Similarly, group 432 has three maximal conjugate subgroups of
type 422 and four maximal conjugate subgroups of type 32.
The subgroup H of a group P is a normal (or invariant) subgroup
if no subgroup H
0
of P exists that is conjugate to H in P. Note that
this does not imply that H is also a normal subgroup of any
supergroup of P. Subgroups of index [2] are always normal and
maximal. (The role of normal subgroups for the structure of space
groups is discussed in Section 8.1.6.)
Examples
(1) Fig. 10.1.3.2 shows two solid lines between point groups 422
and 222, indicating that 422 has two maximal normal subgroups
222 of index [2]. The symmetry elements of one subgroup are
rotated by 45
around the c axis with respect to those of the other
subgroup. Thus, in one subgroup the symmetry elements of the
two secondary, in the other those of the two tertiary tetragonal
symmetry directions (cf. Table 2.2.4.1) are retained, whereas the
primary twofold axis is the same for both subgroups. There
exists no symmetry operation of 422 that maps one subgroup
onto the other. This is illustrated by the stereograms below. The
two normal subgroups can be indicated by the ‘oriented
Fig. 10.1.3.1. Maximal subgroups and minimal supergroups of the two-
dimensional crystallographic point groups. Solid lines indicate maximal
normal subgroups; double solid lines mean that there are two maximal
normal subgroups with the same symbol. Dashed lines refer to sets of
maximal conjugate subgroups. The group orders are given on the left.
*
This type of diagram was first used in IT (1935): in IT (1952) a somewhat
different approach was employed.
795
10.1. CRYSTALLOGRAPHIC AND NONCRYSTALLOGRAPHIC POINT GROUPS
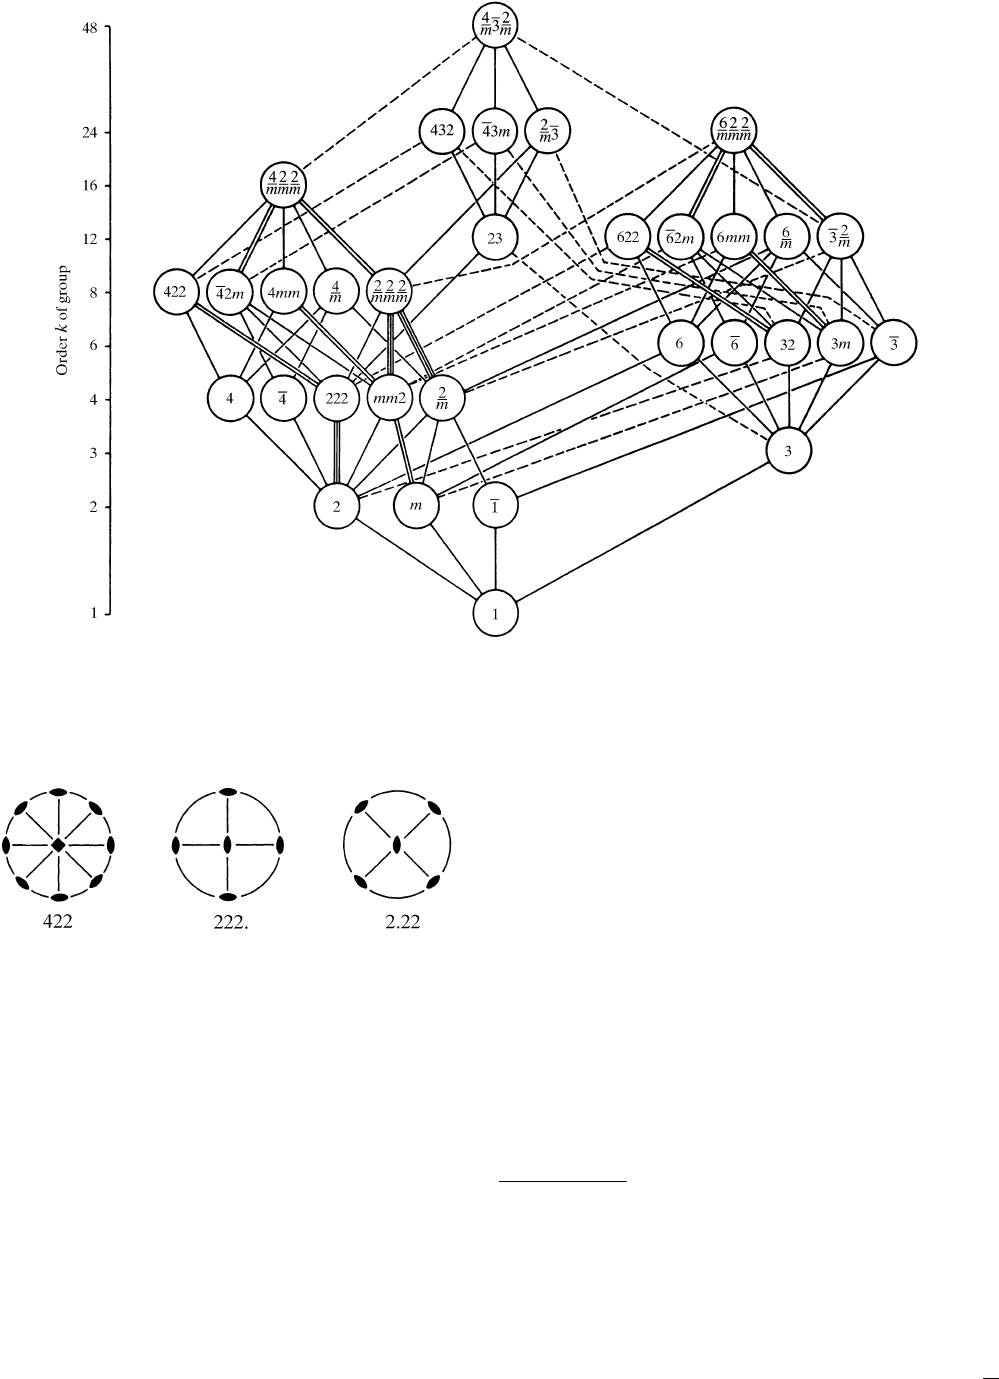
symbols’ 222. and 2.22.
(2) Similarly, group 432 has one maximal normal subgroup, 23.
Figs. 10.1.3.1 and 10.1.3.2 show that there exist two ‘summits’ in
both two and three dimensions from which all other point groups can
be derived by ‘chains’ of maximal subgroups. These summits are
formed by the square and the hexagonal holohedry in two dimensions
and by the cubic and the hexagonal holohedry in three dimensio ns.
The sub- and supergroups of the point groups are useful both in
their own right and as basis of the translationengleiche or t
subgroups and supergroups of space groups; this is set out in Section
2.2.15. Tables of the sub- and supergroups of the plane groups and
space groups are contained in Parts 6 and 7. A general discussion of
sub- and supergroups of crystallographic groups, together with
further explanations and examples, is given in Section 8.3.3.
10.1.4. Noncrystallographic point groups
10.1.4.1. Description of general point groups
In Sections 10.1.2 and 10.1.3, only the 32 crystallographic point
groups (crystal classes) are considered. In addition, infinitely many
noncrystallographic point groups exist that are of interest as
possible symmetries of molecules and of quasicrystals and as
approximate local site symmetries in crystals. Crystallographic and
noncrystallographic point groups are collected here under the name
general point groups. They are reviewed in this section and listed in
Tables 10.1.4.1 to 10.1.4.3.
Because of the infinite number of these groups only classes of
general point groups ( general classes)* can be listed. They are
grouped into general systems, which are similar to the crystal
systems. The ‘general classes’ are of two kinds: in the cubic,
icosahedral, circular, cylindrical and spherical system, each general
class contains one point group only, whereas in the 4N-gonal,
2N 1-gonal and 4N 2-gonal system, each general class
contains infinitely many point groups, which differ in their principal
n-fold symmetry axis, with n 4, 8, 12, ... for the 4N-gonal
system, n 1, 3, 5, ... for the 2N 1-gonal system and n
2, 6, 10, ... for the 4N 2-gonal system.
Furthermore, some general point groups are of order infinity
because they contain symmetry axes (rotation or rotoinversion axes)
of order infinity† (1-fold axes). These point groups occur in the
Fig. 10.1.3.2. Maximal subgroups and minimal supergroups of the three-dimensional crystallographic point groups. Solid lines indicate maximal normal
subgroups; double or triple solid lines mean that there are two or three maximal normal subgroups with the same symbol. Dashed lines refer to sets of
maximal conjugate subgroups. The group orders are given on the left. Full Hermann–Mauguin symbols are used.
*
The‘classes of generalpoint groups’are not thesame as thecommonly used ‘crystal
classes’ because some of them contain point groups of different orders. All these
orders, however, follow a common scheme. In this sense, the ‘general classes’ are an
extension of the concept of (geometric) crystal classes. For example, the general class
nmm of the 4N-gonal system contains the point groups 4mm (tetragonal), 8mm
(octagonal), 12mm (dodecagonal), 16mm etc.
{
The axes of order infinity, as considered here, do not correspond to cyclic groups(as
do the axes of finite order) because there is no smallest rotation from which all other
rotations can be derived as higher powers, i.e. by successive application. Instead,
rotations of all possible angles exist. Nevertheless, it is customary to symbolize these
axes as 1 or C
1
; note that the Hermann–Mauguin symbols 1=m and 1 are
equivalent, and so are the Schoenflies symbols C
1h
, S
1
and C
1i
. (There exist also
axes of order infinity that do correspond to cyclic groups, namely axes based upon
smallest rotations with irrational values of the rotation angle.)
796
10. POINT GROUPS AND CRYSTAL CLASSES