Gopalakrishnan K., Birgisson B., Taylor P., Attoh-Okine N.O. (Eds.) Nanotechnology in Civil Infrastructure: A Paradigm Shift
Подождите немного. Документ загружается.


Characterization of Asphalt Materials for Moisture Damage 241
was selected through trials in the range of 25 to 45 for asphalt imaging. When the
drive amplitude was too large, the cantilever made an intermittent contact with the
surface.
2.1 Tip Functionalization and Calibration
Silicon nitride tips are purchased from VEECO Instruments, Inc (Veeco Instru-
ment Inc., 2007). This tip is a beam bounce cantilever (called RFESPA-CP
MPP211) with a length of 125 μm, natural frequency of 90 kHz, and spring con-
stant of 3 N/m. AFM tips were functionalized using carboxyl (-COOH), methyl
(-CH3), ammin (-NH3) and hydroxyl (-OH) groups from the help of Novascan
Technologies, Ames, IA. These functionals are known to be the major part of as-
phalt chemistry (Testa, 1995). The functionalized AFM test requires calibration of
tips. As discussed previously the force in AFM is calculated for a specific tip, the
tip constant is determined through calibration. Special module to calibrate the
AFM tips supplied by Veeco was used in this study. In calibration procedure, the
tip distances are measured on a sample on a sample of known force between the
tip and the sample molecules. Tip constant is calculated from known force and
displacement (k =F/δ). This constant is used for converting displacement data of
other samples to force; thereby producing force distance (F-D) curve.
2.2 Asphalt Sample Surface Imaging
This paper describes the results of AFM testing on two types of PG grade asphalt
binders under wet and dry conditions. Noncontact mode AFM with Proscan soft-
ware was used to conduct the AFM testing and to analyze the images. In AFM
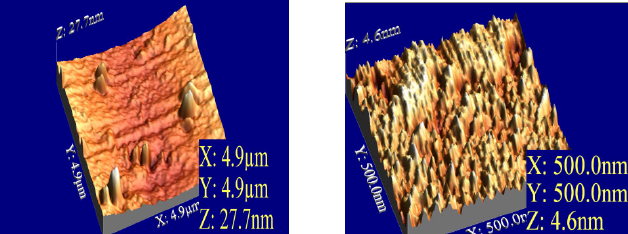
testing, sample image is produced as a first step. Figure 2 shows the 3D images of
dry and wet PG 70-22 binder samples. It can be seen that wet sample has more
spikes than the dry samples. These images were analyzed using WSXM software
(Horacos et al. 2007). In image analysis, asphalt film roughness is measured using
quantities such as average, maximum and root mean square (RMS) values of sur-
face roughness. These quantities are listed in Table 2. It can be seen that PG 76-28
(Dry) sample shows the lowest RMS value (0.56 nm) and the all other RMS val-
ues are fairly close. In general, the RMS roughness values of the wet samples are
higher than those of dry samples.
Table 2 Height and Roughness values of all samples
Sample
Maximum
height (nm)
Average
height (nm)
RMS
Roughness
(nm)
PG 70-22 (dry) 27.96 9.40 2.97
PG 70-22 (wet) 4.59 2.51 0.56
PG 76-28 (dry) 17.73 13.47 0.94
PG 76-28 (wet) 23.21 8.51 2.43
242 R.A. Tarefder and A. Zaman
Figure 2 shows that wet samples have more spikes than dry samples. This is
due to the fact that wet sample was damaged by water action, which has probably
made the asphalt film surface more rough. The acceptable value of roughness for
AFM sample is about 25 nm. As shown in Table 2, as all of the 4 samples have
RMS roughness value less than the limiting 25 nm value.
(a) PG 70-22 (dry) (b) PG 70-22 (wet)
Fig. 2 Three dimensional (3D) images of asphalt surface using AFM
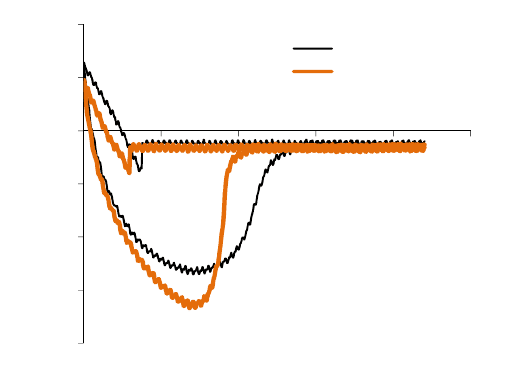
2.3 Characteristics of F-D Curve of Asphalt
F-D curve is defined by the force between tip and sample plotted as a function of
distance between the tip and sample surface. When the AFM tip approaches and
retracts from the sample, it is deflected by the interaction with the sample. A force
curve is such a plot of the force applied to the AFM tip as a function of the tip-
sample displacement of the cantilever holder relative to the surface. Figure 3
shows the force distance curves comparison of dry and wet PG 76-28 samples.
The black colored graph represents the dry sample and the orange colored graph
represents the wet sample. The cycle in the force measurement starts at a tip-
surface separation. At a large distance, no force acts between the tip and surface,
but as the tip approaches, the distance decreases and attractive forces pull the can-
tilever tip towards the sample. At a certain point, the tip jumps or bends towards
the sample surface. This jump or bending occurs when the gradient of attractive
forces exceeds the spring constant plus the gradient of repulsive forces. Moving
the tip further causes a deflection of the cantilever equal in amount to that pro-
duced if the sample were pushed. Next, the tip is withdrawn back to its starting
position. During retraction, at one point, tip finally snaps outward. The lowest
point of the retracting F-D curve shown in Figure 3 is the maximum force in the
retracting curve, at which point the adhesion is broken and the cantilever breaks
free from the surface. Adhesion between the tip and the sample is mainly due to
van der Waals interactions and electrostatic forces (acid-base). Asphalt surface is
Characterization of Asphalt Materials for Moisture Damage 243
Fig. 3 Force distance graph of PG 76-28 sample with –COOH tip
charge neutral; adhesion force is mainly due to van der Waals interaction. From
Figure 3, it can be seen that adhesion force in wet asphalt sample is higher than
that in dry sample.
2.4 Dry vs. Wet Adhesion Forces
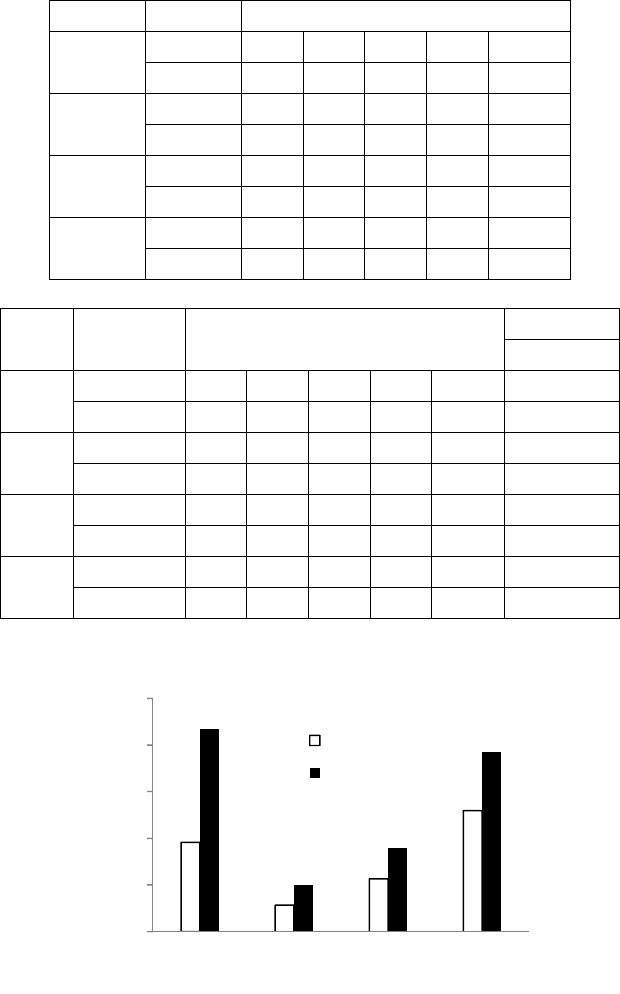
Each asphalt sample was tested at nine different locations. Table 3 shows the test
results on dry and wet PG 70-22 samples adhesion with all the functionalized tips.
All the ten (10) point’s tests values as well as the average result are tabularized
here to show the wet and dry adhesion forces. Due to space limitation, adhesion
data of PG 76-28 samples are not shown. Form this table data, it is possible to
show that test data are quite consistent and repeatable, which is not discussed fur-
ther detail in this chapter.
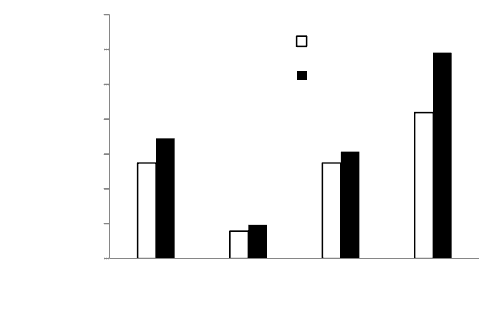
The average adhesion values of dry and wet samples of PG 70-22 and PG 76-
28 are plotted in the Figures 4 and 5. For PG 70-22, the adhesion values of all the
wet samples are smaller than those of dry samples as shown in Figure 4. The ad-
hesion value obtained by –COOH functionalized tip is higher that the adhesion
value obtained by –CH
3
functionalized tips. Probably, tip type, –COOH being hy-
drophilic and –CH
3
being hydrophobic, has affected the results. For PG 76-28
binder, the adhesion values of all the wet samples are higher than those of dry
samples as shown in Figure 5. Instead of –COOH, the –OH functional which is
also a hydrophilic tip, has shown the highest adhesion values. The hydrophobic –
CH
3
has shown a slight increase in adhesion force due to sample wetting indicat-
ing PG 76-22 is less susceptible to moisture damage compared to the PG 70-22.
-200
-150
-100
-50
0
50
100
0 200 400 600 800 1000
Force (nN)
Distance (nm)
Dry
Wet
Adhesion Force
244 R.A. Tarefder and A. Zaman
Table 3 Dry and wet adhesion forces of PG 70-22 sample
Tip Cond Adhesion Forces (nN) (first 5 points)
COOH
Dry 147 181 239 231 291
Wet 377 512 361 488 378
CH3
Dry 60 73 89 38 57
Wet 105 90 94 89 102
NH3
Dry 99 126 95 82 109
Wet 201 120 147 172 203
OH
Dry 234 273 288 291 291
Wet 483 362 310 409 272
Tip Condition Adhesion Forces (nN) (second 5 points)
Average
Force (nN)
COOH
Dry 147 92 126 191 308 191
Wet 377 367 422 499 457 435
CH3
Dry 60 65 34 43 56 57
Wet 105 129 119 89 92 102
NH3
Dry 99 158 95 110 139 114
Wet 201 183 205 227 204 181
OH
Dry 234 282 184 209 212 260
Wet 483 414 376 477 419 386
Fig. 4 Average dry vs. wet adhesion forces in PG 70-22 binder
0
100
200
300
400
500
COOH CH3 NH3 OH
Adhesion Force (nN)
Dry
Wet
Characterization of Asphalt Materials for Moisture Damage 245
Fig. 5 Average dry vs. wet adhesion forces in PG 76-28 binder
2.5 Remarks Based on AFM Results
Based on the AFM testing of wet and dry asphalt sample, the following remarks
can be made:
• The chemistry of the tip, functional groups in asphalt, affects its adhesion
behavior.
• Wet sample shows higher adhesion force values compared to the dry
sample. This indicates that damage occurs in wet asphalt film due to wa-
ter action.
• The ratio of wet and dry adhesion force in PG 70-22 binder is higher than
that in PG 76-28. This indicates that the PG 76-28 binders are more resis-
tant to moisture damage than the PG 70-22 binders.
3 Nanoindentation for Moisture Damage Study
In a nanoindentation test, the movement of a diamond probe in contact with a
sample surface is measured by applying an increasing load. Time, load, and dis-
placement are recorded during the test. The elastic and plastic properties of the
sample are determined from the load-displacement data. Stiffness and hardness are
the most common mechanical properties measured from indentation data. Stiffness
is the ratio of stress to strain. Hardness is the resistance to permanent deformation.
It is defined as the maximum applied load divided by the projected plastic area of
contact. Nanoindentation tests were conducted using a nanoindenter supplied by
MicroMaterials Ltd. Wrexham, UK. Nanoindentation test was performed using
spherical tips and the direction of indentation was horizontal. This nanoindenter is
a pendulum-based electro-magnetical depth-sensing system, in which samples are
mounted vertically as shown in Figure 5. This kind of horizontal indenter has ad-
vantages over the vertical indenter as the horizontal indenter does not use self
0
50
100
150
200
250
300
350
COOH CH3 NH3 OH
Adhesion Force (nN)
Dry
Wet
246 R.A. Tarefder and A. Zaman
weight on the sample during indentation. As shown in the Figure 5, a pendulum
using a coil and magnet is rotated about its frictionless pivot so that the diamond
probe penetrates the sample surface placed in a sample holder. Indenter displace-
ment is measured with a parallel plate capacitor achieving sub-nanometer resolu-
tion. The balance weight is adjusted to balance the pendulum when different tip
geometries are used with the indenter. The damping plates are used to damp out
any oscillations that may occur during the indentation process.
In the horizontal indenter, a high resolution microscope and an AFM are avail-
able to take images of sample during indentation test. The nanoindentation system
is enclosed in a thermally controlled cabinet. This cabinet provided protection
from air disturbances, allowed the system to be thermally controlled and reduced
error due to noise disturbance by providing sound insulation. Though asphalt is a
temperature dependent material, all the indentation was conducted in this cabinet,
however only at one temperature of 23.7 °C. This indenter has load resolution of 1
nN and depth resolution of 0.004 nm. Routine calibrations are done to keep the
machine performing at its resolution level. Calibration includes: (a) load calibra-
tion which determines the forces that can be applied at the indenter tip during
measurements, and (b) depth calibration which relates a known distance moved by
the sample in contact with the indenter to a change in capacitance.
Fig. 6 Horizontal Nanoindenter at the University of New Mexico
3.1 Nanoindentation Theory
To determine the mechanical properties of the tested asphalt sample, the depth
versus loading-unloading data was fitted using the following power law function
(Oliver and Pharr 1992):
Tip
Sample
holder

Characterization of Asphalt Materials for Moisture Damage 247
(1)
where h is any depth, h
c
is the unrecoverable or plastic depth, a and m are con-
stants. At h=h
max,
P=P
max;
therefore above equation can be expressed as:
(2)
where C is the contact compliance equal to the tangent at maximum load or the
slope of the initial portion of unloading curve. The value of
ε
depends on the in-
denter geometry. The value of
ε
is 0.75 for a Berkovich indenter and 0.85 for
spherical indenter. Asphalt sample hardness (H) can be determined from the peak
load (P
max
) and the projected area of contact, A:
(3)
The reduced modulus of the sample can be analyzed using the unloading portion
of the depth-load curve as follows:
(4)
where C is the contact compliance and E
r
is the reduced modulus. Reduced mod-
ulus is a measure of the elastic modulus of the sample. It can be thought of as an
intermediate parameter accounting for the non-rigid effect of diamond indenters in
contact with other materials. Finally, reduced modulus is converted to the Young's
modulus using the following equation also known as Oliver and Pharr Equation
(Oliver and Pharr 1992):
(5)
where
E
s
= Young’s modulus of sample
s
= Poisons ratio of sample
E
i
= Young’s modulus of indenter (1141 GPa)
i
= Poisons ratio of indenter (0.07)
E
r
= Reduced modulus of sample obtained from Eq. (4)
Fortunately, a NanoTest software developed by the nanoindentation manufacturer
uses the above method of Oliver and Pharr for automatic curve fitting and analysis
of the raw indentation data. The hardness value is related to loading curve and the
elastic modulus value is related to unloading load-displacement curve of the
nanoindentation.
m)hh(aP
c
−=
()
maxmaxc
P.Chh
ε
−=
A/PH
max
=
50
50
2
.
.
r
AC
E
π
=
i
i
s
s
r
EEE
22
111 ν−
−
ν−
=

248 R.A. Tarefder and A. Zaman
3.2 Nanoindentation on Asphalt Samples
Nanoindentation tests were conducted on three asphalt concrete samples that were
designed using performance grade binder PG 76-28 and PG 70-22. Three mixes
that uses the aforementioned PG binders were collected from the local plant. Of
them, SP-III mix was made of PG 76-28 binder, and SP-B and SP-C mixes used
PG 70-22 binder. Each of the mixes is compacted into 6 in. diameter cylinders by
a Superpave gyratory compactor using a 600 kPa (87,02 psi) vertical pressure
(AASHTO T 312). Using a water-cooled laboratory saw, one-inch thick disc is
sliced from the center of each cylinder in an attempt to acquire samples with uni-
form air voids.
Smooth surface of the cube is very important for nanoindentation experiment.
Because the contact area is measured indirectly from the depth of penetration, a
rough surface may cause errors in the determination of the area of contact be-
tween the indenter and the specimen (Johnson 1985). Fine laboratory saws at Ge-
ology Department at the University of New Mexico were used to cut and prepare
thin AC cubes (12 mm x 12 mm x 6 mm). The cube surfaces were polished by a
grinding machine rotating at angular speed of 150 rpm with a sequence of SiC pa-
pers of decreasing abrasiveness (100, 200, 400, 800, 1000, 1200 and 1400-grit)
under continuous water cooling. Each step was carried out for 150 second. Only
one phase (surface) of the cube sample was polished. Finally, the specimens were
washed in a water bath to remove any remaining dusts. Figure 7 shows polished
asphalt concrete cube that was used for nanoindentation testing. The sample di-
mension was about 25 mm x 25 mm x 3 mm.
One set of samples were tested under dry, and the other set was tested under
wet condition (AASHTO T 283). Freeze and thaw cycles are the main elements of
this method to make the sample ready for moisture related damage testing evalua-
tion. The nanoindentation test samples are kept in a vacuum jar to vacuum for 10
minutes under 25 kPa pressure. Then the samples are kept in fridge at -20ºC tem-
perature for 24 hours. After that they are placed in 60ºC hot water bath for another
24 hours. From the hot water bath they are kept in room temperature bath for an-
other two hours. The samples are kept in zip lock bag so that it may not drop the
available moisture before final testing.
Fig. 7 Asphalt concrete cube for nanoindentation tests
Mastic
Aggregate
Characterization of Asphalt Materials for Moisture Damage 249
3.3 Sample Image after Nanoindentation
The nanoindentation on both aggregate and mastic phases of asphalt concrete cube
sample were performed using a nanopositioner attached with our nanoindentation
equipment. The photographs of asphalt samples after nanoindentation are shown
in Figures 8(a) and 8(b). It can be seen that a significant impression on mastic
sample from Figure 8(a). Where as the impression on aggregate is recovered
quickly as shown in Figure 8(b). Aggregate sample is much stronger than the mas-
tic sample and hence a little deformation is observed here. The deformation was
permanent on the mastic as the picture was taken almost 1 hour after the test.
(a) Mastic (b) Aggregate
Fig. 8 Mastic and aggregate samples after nanoindentation
3.4 Nanoindentation Results and Discussions
In a standard indentation test, a range of load is set on a specified grid points, and
only successful indentation results are used for analysis. Whether an indentation
was successful, that means whether the good data obtained is good or bad, is
determined by whether Oliver and Pharr method can be applied to the load vs in-
dentation raw data. As a result, the amount of load may vary for successful inden-
tation. Using Oliver and Pharr equation, hardness and Young’s modulus of dry
and wet samples at several grid points are calculated. Since the contact area of the
nanoindenter is small, several grid points were selected on samples with a hetero-
geneous composition on later scale of about 40 μm. The indents are located at
least 40 μm (micrometer) apart to avoid the influence of residual stresses from ad-
jacent impressions. The load and displacement resolution of the indenter are 1 nN
(NanoNewton) and 0.01 nm (nanometer) respectively. Both load and depth
controlled tests are conducted on asphalt. On the asphalt concrete sample, the

250 R.A. Tarefder and A. Zaman
locations of aggregate and mastic are determined using the nano-positioner
attached with our nanoindenter equipment.
The range of aggregate modulus and hardness values and their average are pre-
sented in Table 4. From the results, it can be concluded that no one level of
modulus or hardness can be selected as per representative value of mastic and ag-
gregate modulus and hardness. In addition, wet to dry ratio of hardness and
modulus are shown in Table 4. From the results, it can be seen that wet to dry ratio
is greater than one in all the samples except SP-III. This could not be explained
from this study. It is possible that surface roughness of the aggregate has affected
such results. Perhaps the surface became rougher after wet conditioning of the
samples and resulted in high hardness and young’s modulus values.
Table 4 Hardness and Young’s modulus of wet and dry aggregate
Sample Condition
Hardness
Ranges (MPa)
Avg. Hardness
(MPa)
Wet/Dry
Ratio
SP-B
Dry 1249 to 1347 1271
17.5
Wet 3253 to 56732 22332
SP-C
Dry 7 to 9 8
4.3
Wet 2 to 94 34
SP-III
Dry 65 to 311 198
8.9
Wet 302 to 4050 1776
Sample Condition
Young’s Modulus
Ranges (MPa)
Avg. Modulus
(MPa)
Wet/Dry Ratio
SP-B
Dry 24243 to 51819 1271
10
Wet 49192 to 810478 394989
SP-C
Dry 133 to 260 197
32.8
Wet 902 to 17439 6479
SP-III
Dry 20341 to 25822 20481
0.3
Wet 6898 to 3711 5721
The range of mastic modulus and hardness values and their average are pre-
sented in Table 5. Overall, hardness and Young’s modulus values of wet samples
are smaller than those of the dry samples. It shows the weakness of asphalt con-
crete mastic against the moisture. Hardness of SP-B and SP-III mastics are much
higher than the hardness of SP-C sample. However, wet to dry hardness of SP-C
sample is smaller than that of other two mixes. This indicates that SP-C mastic is
less susceptible to moisture damage than the SP-B and SP-III mastics. Though SP-
C and SP-B mixes contains a PG 70-22 binder, the gradation of fine mastic parti-
cles (passing number 200 sieve materials) are not same. Probably, binder content
and percentage passing number 200 sieve materials have affected the mastic’s
moisture damage behaviour. Mastic has been studied separately, not being in