Fuller S.H., Millett L.I. The Future of Computing Performance: Game Over or Next Level?
Подождите немного. Документ загружается.


Copyright © National Academy of Sciences. All rights reserved.
The Future of Computing Performance: Game Over or Next Level?
86 THE FUTURE OF COMPUTING PERFORMANCE
tity called capacitance
11
and the square of the supply voltage. The load
capacitance of the wiring decreases by 1/k because the smaller gates make
all the wires shorter and capacitance is proportional to length. Therefore,
the power requirements per unit of space on the chip (mm
2
), or energy
per second per mm
2
, remain constant:
Power = (number of gates)(C
Load/gate
)(Clock Rate)(V
supply
2
)
Power density = N
g
C
load
F
clk
V
dd
2
N
g
= CMOS gates per unit area
C
load
= capacitive load per CMOS gate
F
clk
= clock frequency
V
dd
= supply voltage
Power density = ( k
2
)( 1/k )( k )(1/k)
2
= 1
That the power density (power requirements per unit space on the
chip, even when each unit space contains many, many more gates) can
remain constant across generations of CMOS scaling has been a critical
property underlying progress in microprocessors and in ICs in general. In
every technology generation, ICs can double in complexity and increase
in clock frequency while consuming the same power and not increasing
in cost.
Given that description of classic CMOS scaling, one would expect
the power of processors to have remained constant since the CMOS tran-
sition, but this has not been the case. During the late 1980s and early
1990s, supply voltages were stuck at 5 V for system reasons. So power
density would have been expected to increase as technology scaled from
2 mm to 0.5 mm. However, until recently supply voltage has scaled with
technology, but power densities continued to increase. The cause of the
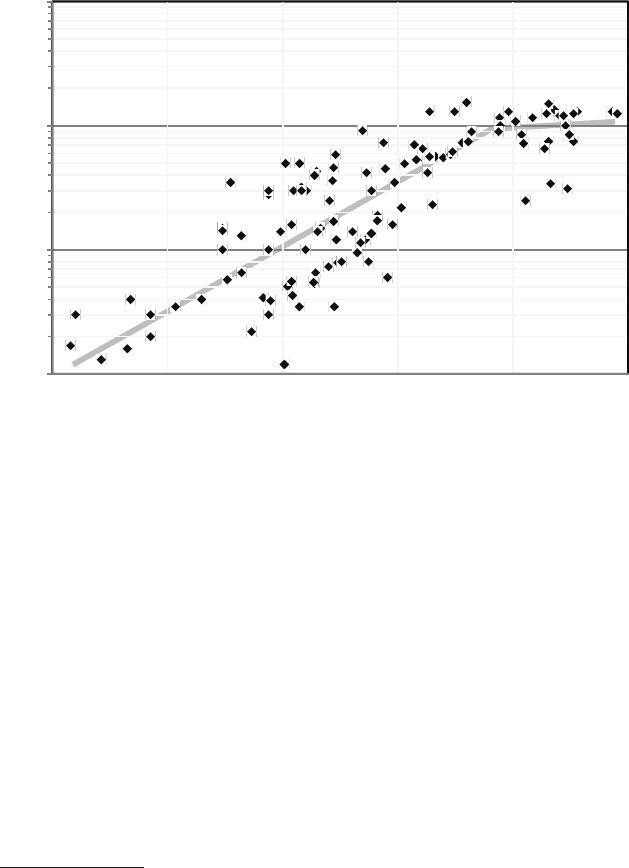
discrepancy is explained in the next section. Note that Figure 3.1 shows no
microprocessors above about 130 W; this is because 130 W is the physical
limit for air cooling, and even approaching 130 W requires massive heat
sinks and local fans.
11
Capacitance is a measure of how much electric charge is needed to increase the voltage
between two points and is also the proportionality constant between energy stored on a wire
and its voltage. Larger capacitors require more charge (and hence more current) to reach
a voltage than a smaller capacitor. Physically larger capacitors tend to have larger capaci-
tance. Because all wires have at least some parasitic capacitance, even just signaling across
the internal wires of a chip dissipates some power. Worse, to minimize the time wasted in
charging or discharging, the transistors that drive the signal must be made physically larger,
and this increases their capacitance load, which the prior gate must drive, and costs power
and increases the incremental die size.
Copyright © National Academy of Sciences. All rights reserved.
The Future of Computing Performance: Game Over or Next Level?
POWER IS NOW LIMITING GROWTH IN COMPUTING PERFORMANCE 87
1
10
100
1,000
1985 1990 1995 2000 2005 2010
Year of Introduction
FIGURE 3.1 Microprocessor power dissipation (watts) over time (1985-2010).
HOW CMOS-PROCESSOR PERFORMANCE IMPROVED
EXPONENTIALLY, AND THEN SLOWED
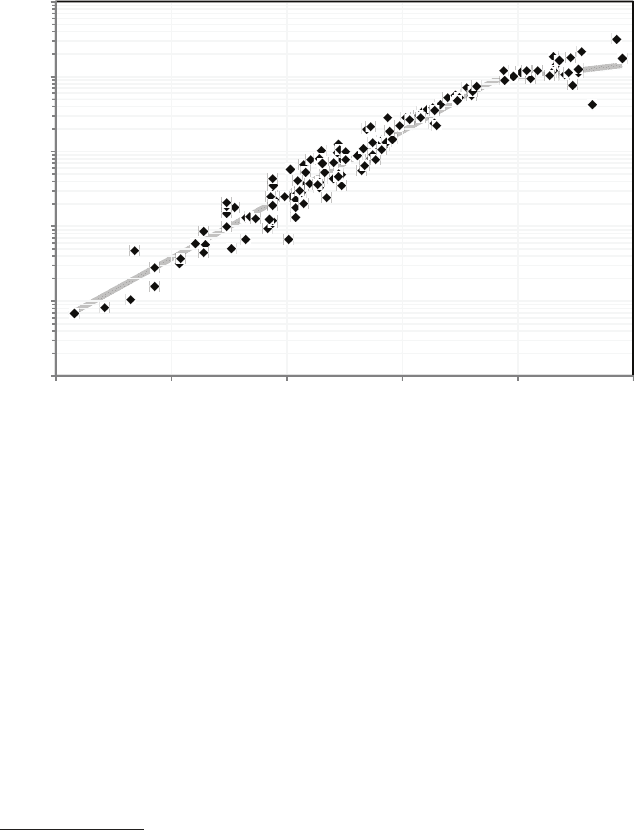
Microprocessor performance, as measured against the SPEC2006
benchmark
12,13,14
was growing exponentially at the rate of more than 50
percent per year (see Figure 3.2). That phenomenal single-processor per-
formance growth continued for 16 years and then slowed substantially
15
partially because of power constraints. This section briefly describes how
those performance improvements were achieved and what contributed to
the slowdown in improvement early in the 2000s.
To achieve exponential performance growth, microprocessor design-
ers scaled processor-clock frequency and exploited instruction-level paral-
12
For older processors, SPEC2006 numbers were estimated from older versions of the
SPEC benchmark by using scaling factors.
13
John L. Henning, 2006, SPEC CPU2006 benchmark descriptions, ACM SIGARCH Com-
puter Architecture News 34(4): 1-17.
14
John L. Henning, 2007, SPEC CPU suite growth: An historical perspective, ACM SI-
GARCH Computer Architecture News 35(1): 65-68.
15
John L. Hennessy and David A. Patterson, 2006, Computer Architecture: A Quantitative
Approach, fourth edition, San Francisco, Cal.: Morgan Kauffman, pp. 2-4.
Copyright © National Academy of Sciences. All rights reserved.
The Future of Computing Performance: Game Over or Next Level?
88 THE FUTURE OF COMPUTING PERFORMANCE
lelism (ILP) to increase the number of instructions per cycle.
16,17,18
The power
problem arose primarily because clock frequencies were increasing faster
than the basic assumption in Dennard scaling (described previously).
The assumption there is that clock frequency will increase inversely pro-
portionally to the basic gate speed. But the increases in clock frequency
were made because of improvements in transistor speed due to CMOS-
technology scaling combined with improved circuits and architecture. The
designs also included deeper pipelining and required less logic (fewer
operations on gates) per pipeline stage.
19
Separating the effect of technology scaling from those of the other
improvements requires examination of metrics that depend solely on the
improvements in underlying CMOS technology (and not other improve-
16
Ibid.
17
Mark Horowitz and William Dally, 2004, How scaling will change processor architecture,
IEEE International Solid States Circuits Conference Digest of Technical Papers, San Fran-
cisco, Cal., February 15-19, 2004, pp. 132-133.
18
Vikas Agarwal, Stephen W. Keckler, and Doug Burger, 2000, Clock rate versus IPC: The
end of the road for conventional microarchitectures, Proceedings of the 27th International
Symposium Computer Architecture, Vancouver, British Columbia, Canada, June 12-14, 2000,
pp. 248-259.
19
Pipelining is a technique in which the structure of a processor is partitioned into simpler,
sequential blocks. Instructions are then executed in assembly-line fashion by the processor.
0
0
0
1
10
100
1985 1990 1995 2000 2005
2010
Year of Introduction
0.1
0.001
0.01
FIGURE 3.2 Integer application performance (SPECint2006) over time (1985-2010).

Copyright © National Academy of Sciences. All rights reserved.
The Future of Computing Performance: Game Over or Next Level?
POWER IS NOW LIMITING GROWTH IN COMPUTING PERFORMANCE 89
ments in circuits and architecture). (See Box 3.1 for a brief discussion of
this separation.) Another contribution to increasing power requirements
per chip has been the nonideal scaling of interconnecting wires between
CMOS devices. As the complexity of computer chips increased, it was
not sufficient simply to place two copies of the previous design on the
new chip. To yield the needed performance improvements, new commu-
BOX 3.1
Separating the Effects of CMOS Technology Scaling
on Performance by Using the FO4 Metric
To separate the effect of CMOS technology scaling from other sorts of
optimizations, processor clock-cycle time can be characterized by using the
technology-dependent delay metric fanout-of-four delay (FO4), which is defined
as the delay of one inverter driving four copies of an equally sized inverter.
1,2
The metric measures the clock cycle in terms of the basic gate speed and gives
a number that is relatively technology-independent. In Dennard scaling, FO4/
cycle would be constant. As it turns out, clock-cycle time decreased from 60-90
FO4 at the end of the 1980s to 12-25 in 2003-2004. The increase in frequency
caused power to increase and, combined with growing die size, accounted for
most of the power growth until the early 2000s.
That fast growth in clock rate has stopped, and in the most recent machines
the number of FO4 in a clock cycle has begun to increase. Squeezing cycle time
further does not result in substantial performance improvements, but it does
increase power dissipation, complexity, and cost of design.
3,4
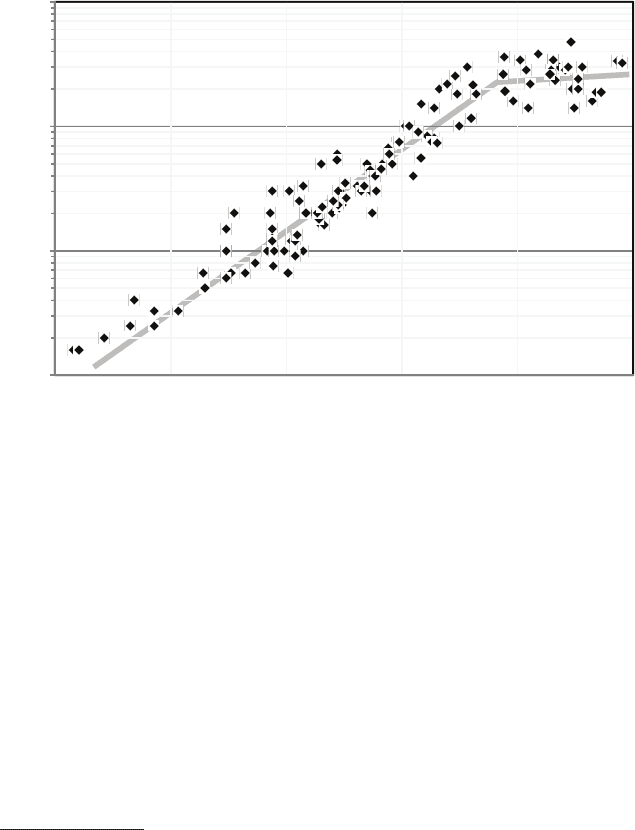
As a result, clock
frequency is not increasing as fast as before (see Figure 3.3). The decrease in
the rate of growth in of clock frequency is also forecast in the 2009 ITRS semi-
conductor roadmap,
5
which shows the clock rate for the highest-performance
single processors no more than doubling each decade over the foreseeable
future.
1
David Harris, Ron Ho, Gu-Yeon Wei, and Mark Horowitz, The fanout-of-4 inverter delay
metric, Unpublished manuscript, May 29, 2009, available online at http://www-vlsi.stanford.
edu/papers/dh_vlsi_97.pdf.
2
David Harris and Mark Horowitz, 1997, Skew-tolerant Domino circuits, IEEE Journal of
Solid-State Circuits 32(11): 1702-1711.
3
Mark Horowitz and William Dally, 2004, How scaling will change processor architecture,
IEEE International Solid States Circuits Conference Digest of Technical Papers, San Francisco,
Cal., February 15-19, 2004, pp. 132-133.
4
Vikas Agarwal, Stephen W. Keckler, and Doug Burger, 2000, Clock rate versus IPC: The
end of the road for conventional microarchitectures. Proceedings of the 27th International Sym-
posium on Computer Architecture, Vancouver, British Columbia, Canada, June 12-14, 2000,
pp. 248-259.
5
See http://www.itrs.net/Links/2009ITRS/Home2009.htm.

Copyright © National Academy of Sciences. All rights reserved.
The Future of Computing Performance: Game Over or Next Level?
90 THE FUTURE OF COMPUTING PERFORMANCE
nication paths across the entire machine were needed—interconnections
that did not exist in the previous generation. To provide the increased
interconnection, it was necessary to increase the number of levels of
metal interconnection available on a chip, and this increased the total
load capacitance faster than assumed in Dennard scaling. Another fac-
tor that has led to increases in load capacitance is the slight scaling up
of wire capacitance per length. That has been due to increasing side-to-
side capacitance because practical considerations limited the amount of
vertical scaling possible in wires. Technologists have attacked both those
issues by creating new insulating materials that had lower capacitance
per length (known as low K dielectrics); this has helped to alleviate the
problem, but it continues to be a factor in shrinking technologies.
One reason that increasing clock rate was pushed so hard in the 1990s,
apart from competitive considerations in the chip market, was that find-
ing parallelism in an application constructed from a sequential stream of
instructions (ILP) was difficult, required large hardware structures, and
was increasingly inefficient. Doubling the hardware (number of transistors
available) generated only about a 50 percent increase in performance—a
relationship that at Intel was referred to as Pollack’s rule.
20
To continue to
scale performance required dramatic increases in clock frequency, which
drove processor power requirements. By the early 2000s, processors had
attained power dissipation levels that were becoming difficult to handle
cheaply, so processor power started to level out. Consequently, single-
processor performance improvements began to slow. The upshot is a core
finding and driver of the present report (see Figure 3.3), namely,
Finding: After many decades of dramatic exponential growth, single-
processor performance is increasing at a much lower rate, and this situ-
ation is not expected to improve in the foreseeable future.
HOW CHIP MULTIPROCESSORS ALLOW SOME
CONTINUED PERFORMANCE-SCALING
One way around the performance-scaling dilemma described in the
previous section is to construct computing systems that have multiple,
explicitly parallel processors. For parallel applications, that arrangement
should get around Pollack’s rule; doubling the area should double the
20
Patrick P. Gelsinger, 2001, Microprocessors for the new millennium: Challenges, op-
portunities, and new frontiers, IEEE International Solid-State Circuits Conference Digest
of Technical Papers, San Francisco, Cal., February 5-7, 2001, pp. 22-25. Available online at
http://ieeexplore.ieee.org/stamp/stamp.jsp?arnumber=912412&isnumber=19686.
Copyright © National Academy of Sciences. All rights reserved.
The Future of Computing Performance: Game Over or Next Level?
POWER IS NOW LIMITING GROWTH IN COMPUTING PERFORMANCE 91
expected performance. One might think that it should therefore be pos-
sible to continue to scale performance by doubling the number of proces-
sor cores. And, in fact, since the middle 1990s, some researchers have
argued that chip multiprocessors (CMPs) can exploit capabilities of CMOS
technology more effectively than single-processor chips.
21
However, dur-
ing the 1990s, the performance of single processors continued to scale at
the rate of more than 50 percent per year, and power dissipation was still
not a limiting factor, so those efforts did not receive wide attention. As
single-processor performance scaling slowed down and the air-cooling
power-dissipation limit became a major design constraint, researchers and
industry shifted toward CMPs or multicore microprocessors.
22
21
Kunle Olukotun, Basem A. Nayfeh, Lance Hammond, Ken Wilson, and Kunyung Chang,
1996, The case for a single-chip multiprocessor, Proceedings of 7th International Conference
on Architectural Support for Programming Languages and Operating Systems, Cambridge,
Mass., October 1-5, 1996, pp. 2-11.
22
Listed here are some of the references that document, describe, and analyze this shift:
Michael Bedford Taylor, Walter Lee, Jason Miller, David Wentzlaff, Ian Bratt, Ben Greenwald,
Henry Hoffmann, Paul Johnson, Jason Kim, James Psota, Arvind Saraf, Nathan Shnidman,
Volker Strumpen, Matt Frank, Saman Amarasinghe, and Anant Agarwal, 2004, Evaluation
of the raw microprocessor: An exposed-wire-delay architecture for ILP and streams, Pro-
ceedings of the 31st Annual International Symposium on Computer Architecture, Munich,
10
100
1,000
10,000
1985 1990 1995 2000 2005 2010
Year of Introduction
FIGURE 3.3 Microprocessor-clock frequency (MHz) over time (1985-2010).

Copyright © National Academy of Sciences. All rights reserved.
The Future of Computing Performance: Game Over or Next Level?
92 THE FUTURE OF COMPUTING PERFORMANCE
The key observation motivating a CMP design is that to increase
performance when the overall design is power-limited, each instruction
needs to be executed with less energy. The power consumed is the energy
per instruction times the performance (instructions per second). Examina-
tion of Intel microprocessor-design data from the i486 to the Pentium 4,
for example, showed that power dissipation scales as performance raised
to the 1.73 power after technology improvements are factored out. If the
energy per instruction were constant, the relationship should be linear.
Thus, the Intel Pentium 4 is about 6 times faster than the i486 in the same
Germany, June 19-23, 2004, pp. 2-13; Jung Ho Ahn, William J. Dally, Brucek Khailany, Ujval
J. Kapasi, and Abhishek Das, 2004, Evaluating the imagine stream architecture, Proceedings
of the 31st Annual International Symposium on Computer Architecture, Munich, Germany,
June 19-23, 2004, pp. 14-25; Brucek Khailany, Ted Williams, Jim Lin, Eileen Peters Long,
Mark Rygh, Deforest W. Tovey, and William Dally, 2008, A programmable 512 GOPS stream
processor for signal, image, and video processing, IEEE Journal of Solid-State Circuits
43(1): 202-213; Christoforos Kozyrakis and David Patterson, 2002, Vector vs superscalar and
VLIW architectures for embedded multimedia benchmarks, Proceedings of the 35th Annual
ACM/IEEE International Symposium on Microarchitecture, Istanbul, Turkey, November
18-22, 2002, pp. 283-293; Luiz André Barroso, Kourosh Gharachorloo, Robert McNamara,
Andreas Nowatzyk, Shaz Qadeer, Barton Sano, Scott Smith, Robert Stets, and Ben Verghese,
2000, Piranha: A scalable architecture based on single-chip multiprocessing, Proceedings
of the 27th Annual International Symposium on Computer Architecture, Vancouver, Brit-
ish Columbia, Canada, June 10-14, 2000, pp. 282-293; Poonacha Kongetira, Kathirgamar
Aingaran, and Kunle Olukotun, 2005, “Niagara: A 32-way multithreaded SPARC processor,
IEEE Micro 25(2): 21-29; Dac C. Pham, Shigehiro Asano, Mark D. Bolliger, Michael N. Day,
H. Peter Hofstee, Charles Johns, James A. Kahle, Atsushi Kameyama, John Keaty, Yoshio
Masubuchi, Mack W. Riley, David Shippy, Daniel Stasiak, Masakazu Suzuoki, Michael F.
Wang, James Warnock, Stephen Weitzel, Dieter F. Wendel, Takeshi Yamazaki, and Kazuaki
Yazawa, 2005, The design and implementation of a first-generation CELL processor, IEEE
International Solid-State Circuits Conference Digest of Technical Papers, San Francisco, Cal.,
February 10, 2005, pp. 184-185; R. Kalla, B. Sinharoy, and J.M. Tendler, 2004, IBM POWER5
chip: A dual-core multithreaded processor, IEEE Micro Magazine 24(2): 40-47; Toshinari
Takayanagi, Jinuk Luke Shin, Bruce Petrick, Jeffrey Su, and Ana Sonia Leon, 2004, A dual-
core 64b UltraSPARC microprocessor for dense server applications, IEEE International Solid-
State Circuits Conference Digest of Technical Papers, San Francisco, Cal., February 15-19,
2004, pp. 58-59; Nabeel Sakran, Marcelo Uffe, Moty Mehelel, Jack Dowweck, Ernest Knoll,
and Avi Kovacks, 2007, The implementation of the 65nm dual-core 64b Merom processor,
IEEE International Solid-State Circuits Conference Digest of Technical Papers, San Francisco,
Cal., February 11-15, 2007, pp. 106-107; Marc Tremblay and Shailender Chaudhry, 2008, A
third-generation 65nm 16-core 32-thread plus 32-count-thread CMT SPARC processor, IEEE
International Solid-State Circuits Conference Digest of Technical Papers, San Francisco,
Cal., February 3-7, 2008, p. 82-83; Larry Seiler, Doug Carmean, Eric Sprangle, Tom Forsyth,
Michael Abrash, Pradeep Dubey, Stephen Junkins, Adam Lake, Jeremy Sugerman, Robert
Cavin, Roger Espasa, Ed Grochowski, Toni Juan, and Pat Hanrahan, 2008, “Larrabee: A
many-core x86 architecture for visual computing, ACM Transactions on Graphics 27(3):
1-15; Doug Carmean, 2008, Larrabee: A many-core x86 architecture for visual computing,
Hot Chips 20: A Symposium on High Performance Chips, Stanford, Cal., August 24-26, 2008.

Copyright © National Academy of Sciences. All rights reserved.
The Future of Computing Performance: Game Over or Next Level?
POWER IS NOW LIMITING GROWTH IN COMPUTING PERFORMANCE 93
technology but consumes 23 times more power
23
and spends about 4
times more energy per instruction. That is another way of showing why
single-processor power requirements increased because of circuit and
architectural changes to improve performance. In achieving higher perfor-
mance, the designs’ energy efficiency was worsening: performance scaled
because of technology scaling and growing power budgets.
CMPs provide an alternative approach: using less aggressive pro-
cessor-core design to reduce energy dissipation per instruction and at
the same time using multiple-processor cores to scale overall chip per-
formance. That approach allows one to use the growing number of tran-
sistors per chip to scale performance while staying within the limit of
air-cooling. It increases chip parallelism, but only a specific type of coarse-
grain program parallelism can exploit this type of parallelism.
Switching to chip multiprocessors reduces the effect of wire delays
(the length of time it takes a signal—output from a gate—to travel along
a given length of wire), which is growing relative to the gate delay (the
length of time it takes to translate input to a logic gate to be transformed
into output from that gate).
24,25
Each processor in a CMP is small relative
to the total chip area, and wires within a processor are short compared
with the overall chip size. Interprocessor communication still requires
long wires, but the latency of interprocessor communication is less critical
for performance in a CMP system than is the latency between units within
a single processor. In addition, the long wires can be pipelined and thus
do not affect the clock-cycle time and performance of individual proces-
sors in a CMP.
Chip multiprocessors are a promising approach to scaling, but they
face challenges as well; problems with modern scaling are described in
the next section. Moreover, they cannot be programmed with the tech-
niques that have proved successful for single processors; to achieve the
potential performance of CMP, new software approaches and ultimately
parallel applications must be developed. This will be discussed in the
next chapter.
23
Ed Grochowski, Ronny Ronen, John Shen,and Hong Wang., 2004, Best of both latency
and throughput, Proceedings of the IEEE International Conference on Computer Design,
San Jose, Cal., October 11-13, 2004, pp. 236-243.
24
Mark Horowitz and William Dally, 2004, How scaling will change processor architecture,
IEEE International Solid States Circuits Conference Digest of Technical Papers, San Fran-
cisco, Cal., February 15-19, 2004, pp. 132-133
25
Kunle Olukotun, Basem A. Nayfeh, Lance Hammond, Ken Wilson, and Kunyung Chang,
1996, The case for a single-chip multiprocessor, Proceedings of 7th International Conference
on Architectural Support for Programming Languages and Operating Systems, Cambridge,
Mass., October 1-5, 1996, pp. 2-11.

Copyright © National Academy of Sciences. All rights reserved.
The Future of Computing Performance: Game Over or Next Level?
94 THE FUTURE OF COMPUTING PERFORMANCE
PROBLEMS IN SCALING NANOMETER DEVICES
If voltages could continue to be scaled with feature size (following
classic Dennard scaling), CMP performance could continue to be scaled
with technology. However, early in this decade scaling ran into some
fundamental limits that make it impossible to continue along that path,
26
and the improvements in both performance and power achieved with
technology scaling have slowed from their historical rates. The net result
is that even CMPs will run into power limitations. To understand those
issues and their ramifications, we need to revisit technology scaling and
look at one aspect of transistor performance that we ignored before: leak-
age current.
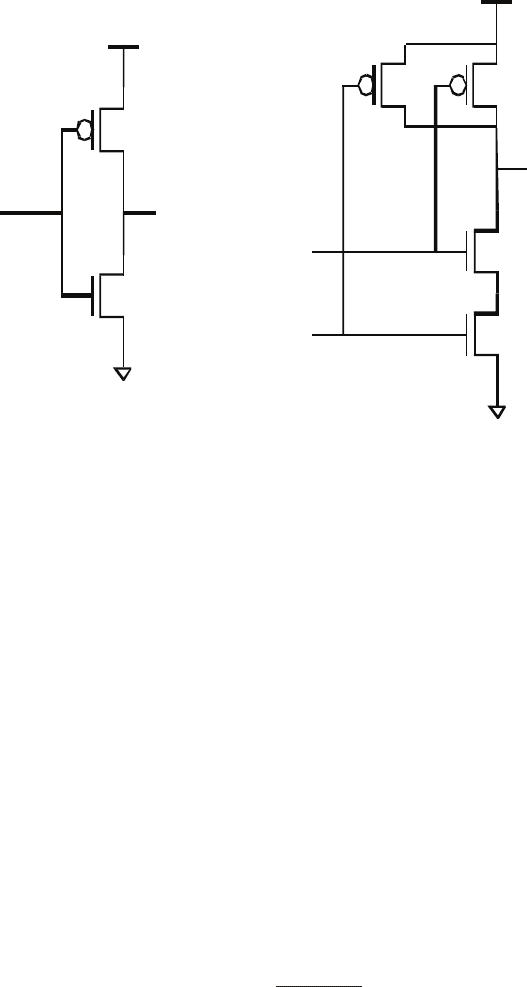
As described earlier, CMOS circuits have the important property
that they dissipate energy only when a node changes value. Consider
the simple but representative CMOS logic circuits in Figure 3.4. One type
of CMOS device, a pMOS transistor, is connected to the power supply
(V
supply
). When its input is low (V
gnd
), it turns on, connects V
supply
to
the output, and drives the output high to V
supply
. When the input to the
pMOS device is high (V
supply
), it disconnects the output from V
supply
. The
other type of CMOS device, an nMOS transistor, has the complementary
behavior: when its input is high (V
supply
), it connects the output to V
gnd
;
when its input is low (V
gnd
), it disconnects the output from V
gnd
. Because
of the construction of the CMOS logic, the pMOS and nMOS transistors
are never driving the output at the same time. Hence, the only current
that flows through the gate is that needed to charge or discharge the
capacitances associated with the gate, so the energy consumed is mostly
the energy needed to change the voltage on a capacitor with transistors,
which is C
load
multiplied by V
supply
2
. For that analysis to hold, it is impor-
tant that the off transistors not conduct any current in the off state: that
is, they should have low leakage.
However, the voltage scaling that the industry has been following has
indirectly been increasing leakage current. Transistors operate by chang-
ing the height of an energy barrier to modulate the number of carriers that
can flow across them. One might expect a fairly sharp current transition,
so that when the barrier is higher than the energy of the carriers, there
is no current, and when it is lowered, the carriers can “spill” over and
flow across the transistor. The actual situation is more complex. The basic
reason is related to thermodynamics. At any finite temperature, although
26
Sam Naffziger reviews the V
dd
limitations and describes various approaches (circuit,
architecture, and so on) to future processor design given the voltage scaling limitations in
the article High-performance processors in a power-limited world, Proceedings of the IEEE
Symposium on VLSI Circuits, Honolulu, Hawaii, June 15-17, 2006, pp. 93-97, available on-
line at http://ewh.ieee.org/r5/denver/sscs/Presentations/2006_11_Naffziger_paper.pdf.
Copyright © National Academy of Sciences. All rights reserved.
The Future of Computing Performance: Game Over or Next Level?
POWER IS NOW LIMITING GROWTH IN COMPUTING PERFORMANCE 95
there is a well-defined average energy for the carriers, the energy of each
individual carrier follows a probability distribution. The probability of
having an energy higher than the average falls off exponentially, with a
characteristic scale factor that is proportional to the temperature of the
transistors measured measured in kelvins. The hotter the device, the
wider the range of energies that the carriers can have.
That energy distribution is critical in the building of transistors. Even
with an energy barrier that is higher than the average energy of the car-
riers, some carriers will flow over the barrier and through the transistor;
the transistor will continue to conduct some current when we would like
it to be off. The energy scale is kT, where k is the Boltzmann constant and
T is the temperature in kelvins. We can convert it into voltage by divid-
ing energy by the charge on the particle, an electron in this case: q = 1.6
× 10
–19
coulombs. kT/q is around 26 mV at room temperature. Thus, the
current through an off transistor drops exponentially with the height of
the energy barrier, falling by slightly less than a factor of 3 for each 26-mV
increase in the barrier height. The height of the barrier is normally called
the threshold voltage (V
th
) of the transistor, and the leakage current can
be written as
I I e
q V V
kT
ds o
gs th
=
( – )
,
α
nMOS
pMOS
OutputInput
Input A
Input B
Output
V
gnd
V
supply
V
gnd
V
supply
FIGURE 3.4 Representative CMOS logic circuits.