Franc J-P. Fundamentals of Cavitation
Подождите немного. Документ загружается.

FUNDAMENTALS OF CAVITATION194
9.1
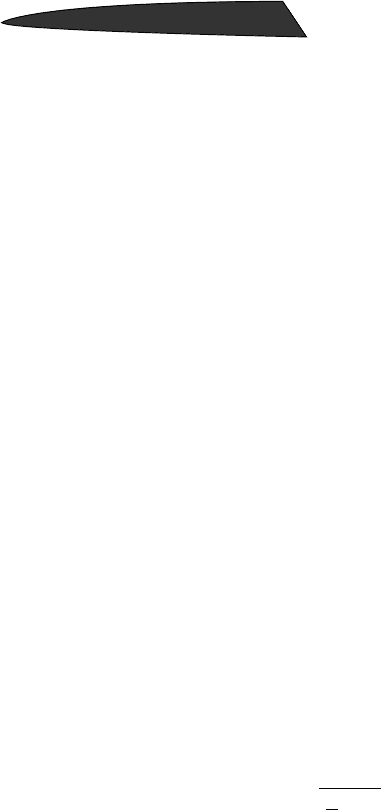
Typical shape of a truncated foil
with a ventilated base
Ventilation is operated artificially from
an air compressor on board. Air passes
through the legs of the boat or throug
h
the propeller hub and is injected at the
base of the foils or the propeller blades.
Thus, the base pressure is increased and
the drag is lowered.
When the angle of attack increases, air tends to invade the foil upper side, which
results in a decrease of the lift. Such a regime must be avoided, so that the operating
range of incidences is usually rather small [R
OWE 1979].
This kind of foil is suited to boat speeds in the range 40-80 knots, for which classical
non-cavitating foils are inoperative. For larger speeds, only supercavitating foils
with a non-wetted upper side can be used.
From an experimental viewpoint, it is essential that the hydrodynamic tunnel in
which ventilation tests are conducted is able to eliminate the injected air, so that
the water entering the test section is free of any traces of air after recirculation in
the tunnel loop. If the flow is unsteady, as is the case for pulsating cavities, the test
facility must ensure a good decoupling between the test section and the rest of the
loop in order to avoid any influence of the facility on the results.
In the case of three-dimensional foils of finite span, additional air cavities develop
in the tip vortices. They coexist with the two-dimensional air cavities whose
behavior is not significantly modified by them, except for very small values of
the wing aspect ratio [V
ERRON & MICHEL 1984].
9.1.2. THE MAIN PARAMETERS
The global features of ventilated flows such as cavity length, lift or drag, depend
on the relative cavity underpressure s
c
(see § 1.4.3):
s
r
c
rc
pp
V
=
-
1
2
2
(9.1)
p
r
is a reference pressure and p
c
the cavity pressure.
The pressure inside the cavity is the sum of the vapor pressure (as the cavity is
usually saturated with water vapor) and the pressure of the injected air:
ppp
c v air
=+
(9.2)
In the case of substantial cavity pressure fluctuations, p
air
is the mean value of
the air pressure inside the cavity. For ventilated flows, p
v
is generally negligible
compared to p
air
.

9 - VENTILATED SUPERCAVITIES 195
The air flowrate is normally imposed and the resulting air pressure inside the cavity
is a priori unknown. It depends upon the mode of evacuation of air at the rear of
the cavity, which, in turn, depends upon the global flow geometry, particularly the
cavity length and the circulation, so that all parameters are strongly coupled.
Analysis of the experimental results [M
ICHEL 1971, 1984] suggests that the relative
underpressure be split into two terms:
— the classical cavitation parameter s
v
, which characterizes the ambient reference
pressure p
r
:
s
r
v
rv
pp
V
=
-
1
2
2
(9.3)
— and the relative mean pressure of the air inside the cavity, which takes into
account its elastic behavior due to compressibility:
s
r
a
air
p
V
=
1
2
2
(9.4)
Thus, the relative cavity underpressure s
c
is given by:
sss
cva
=-
(9.5)
As s
c
is usually small, the two parameters s
v
and s
a
are close in value.
In the case of pulsating cavities, the regimes of pulsation are fairly well identified
via the ratio
ss
ca
/
, or equivalently
ss
cv
/
(see SILBERMAN &SONG, 1961, and
S
ONG, 1962, who first described the pulsation regimes).
As for the pulsation frequency f, the experimental results are satisfactorily correlated
by introducing the following non-dimensional frequency:
j
r
=
f
p
d
air
l
(9.6)
where l is the mean cavity length and d a fixed reference length, typically the chord
of the forebody.
As for the mass flowrate of air Q
m
, two non-dimensional flowrate coefficients can
be considered. These are:
— the mass flowrate coefficient:
C
Q
VS
Qm
m
=
r
(9.7)
— and the volumetric flowrate coefficient:
C
Q
VS
Qv
m
air
=
r
(9.8)

FUNDAMENTALS OF CAVITATION196
Here, S is a reference surface area. The mean air density r
air
can be determined
from the measurement of the cavity pressure p
c
combined with the BOYLE-MARIOTTE
law. In the last equation, the quantity
Q
m air
/r
represents the volumetric flowrate
of air.
If we introduce the mean velocity of the air inside the cavity V
air
and take an area
close to the cavity cross-section for S, we have approximately:
QVS
m air air
@r
(9.9)
so that the volumetric air flow coefficient C
Qv
gives the order of magnitude of the
ratio of the air velocity to the water velocity:
C
V
V
Qv
air
@
(9.10)
The values of C
Qv
typically lie in the range 0.05 to 0.5.
Among the other classical non-dimensional parameters to be considered, there is
the F
ROUDE number:
Fr
V
gd
=
(9.11)
which is often determined using the cavity length l in place of the reference length d.
9.1.3. CAVITY LENGTH
Experimental tests conducted on various configurations have shown that the
relative mean cavity length l /d, as well as the global lift and drag coefficients C
L
and C
D
, depend primarily on the relative cavity underpressure s
c
and, to a smaller
extent, on the F
ROUDE number, i.e.:
l
d
Fr
c
(,)s
(9.12)
In the case of a ventilated foil, the incidence a should be included.
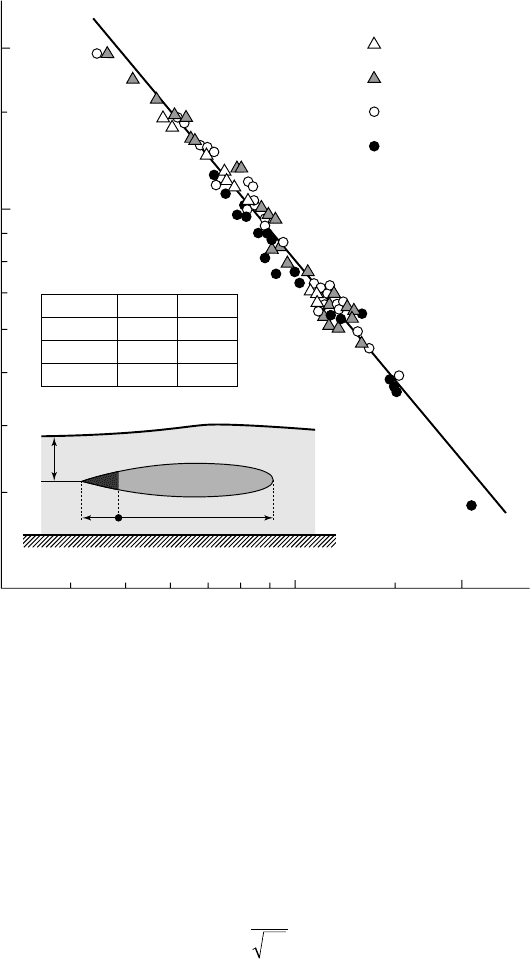
The influence of the relative cavity underpressure on cavity length is shown in
figure 9.2 in the case of ventilated cavities behind a wedge.
The experimental points correspond to various values of the cavitation number s
v
,
ranging from 0.4 to 10. Thus, the ambient pressure and consequently the different
air flow regimes (see § 9.1.5) do not significantly influence the mean cavity length.
The variation of l/c with s
c
suggests a power law (see chap. 6):
l
c
A
c
n
@
-
s
(9.13)
9 - VENTILATED SUPERCAVITIES 197
The table in figure 9.2 gives the values of A and n for three different submersion
depths. These values are close to those for vapor supercavities. The theoretical
asymptotic value of n for an infinite medium is 2 (see chap. 6), while n approaches
unity for small values of the submersion depth.
h [mm] A n
70 0.38 1.16
140 0.45 1.26
210 0.34 1.47
h
c
l
10 m/s
8 m/s
6 m/s
4 m/s
20
10
8
6
4
2
0.04 0.06 0.08 0.1 0.2
s
c
l
/c
9.2 - Variation of the non-dimensional mean cavity length versus the relative
underpressure ss
ss
c
for ventilated cavities behind a two-dimensional wedge
(chord 60.5 mm, base 17 mm) for four different values of the water velocity
The wedge is at mid-height of a free surface channel of 280 mm in depth. Values of
A and n for two other immersion depths are given in the table [from M
ICHEL, 1971].
In the range of velocities considered here, the F
ROUDE number has only negligible
influence on the cavity length, except for the smallest values of s
c
where a slight
deviation with respect to the power law becomes visible on figure 9.2. If the
F
ROUDE number is calculated using the cavity length, as suggested in section 6.2.2:
Fr
V
g
l
l
=
(9.14)
FUNDAMENTALS OF CAVITATION198
gravitational effects are expected to be negligible if Fr
l
is much larger than one.
For the smallest values of s
c
considered above, this condition is not fulfilled as the
F
ROUDE number is relatively small and close to one (typically
Fr
l
= 24.
for
l /c =18
,
l =109.m
and
Vms= 8/
), so that gravitational effects become more significant.
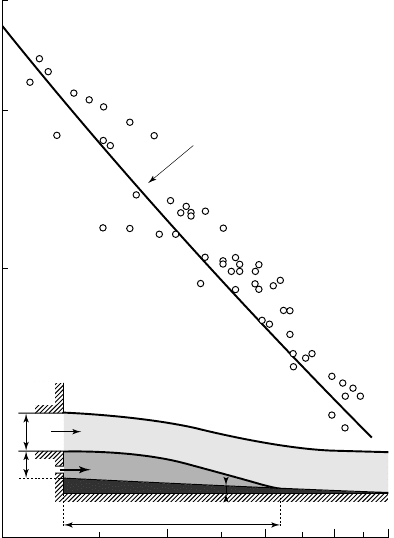
The dependence of the cavity length on the cavity underpressure s
c
in the half-
cavity configuration presented in figure 9.3 is qualitatively very similar to the case
of a wedge [L
AALI & MICHEL 1984]. This configuration is representative of the flow
in spillways aerators. It is simpler than the hydrofoil since the effects of incidence
and circulation are ruled out.
40
30
20
10
0.02 0.04 0.06 0.10.08
Relative cavity length l/h
Relative cavity underpressure s
c
l
b
air
p
0
h
H
v
Cavity
c
= –––– (1 + – sin b)
2Hh
l
2
l
h
9.3 - Cavity length versus ss
ss
c
in the case of the half-cavity
The cavity is formed between an initially horizontal plane water jet of height
Hmm= 138 9.
and a wall with a small slope
b
=∞31.
. The step height is
hmm= 30
.
The reference pressure p
r
used in the definition of
s
c
and
s
v
is the pressure p
0
on
the upper free surface of the jet. The different points correspond to various values
of
s
v
and of the velocity (between 4 and 12 m/s) [from LAALI & MICHEL, 1984].
9 - VENTILATED SUPERCAVITIES 199
9.1.4. AIR FLOWRATE AND CAVITY PRESSURE
The cavity pressure p
c
depends mainly upon the air flowrate and to a smaller extent
upon the ambient pressure. This dependency can be written non-dimensionally as
follows:
ss
cQvv
C(,)
(9.15)
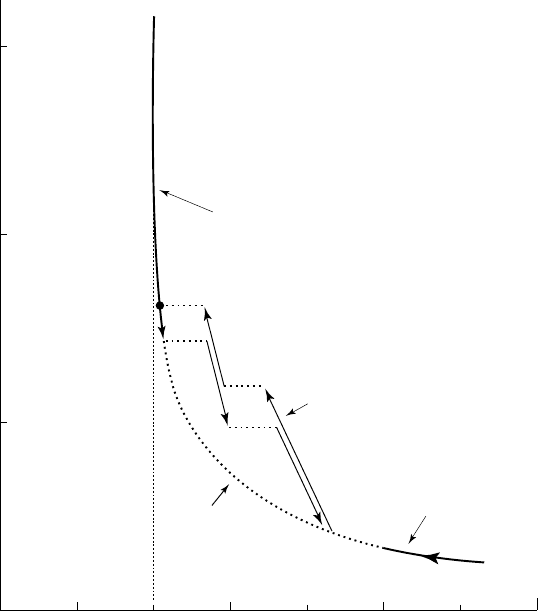
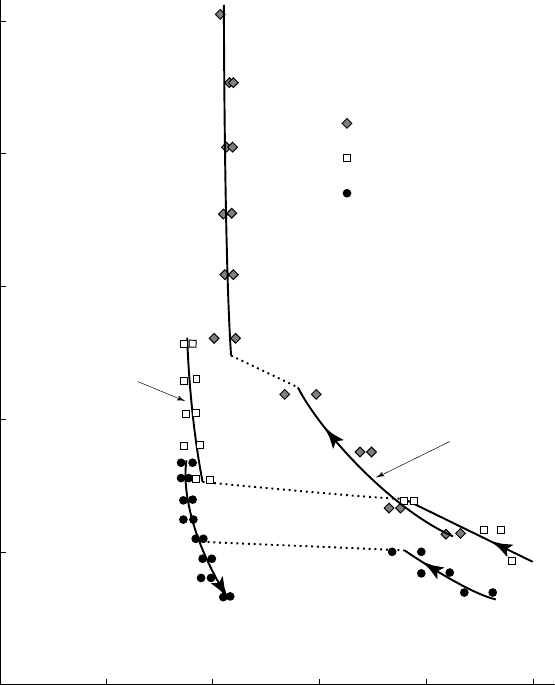
A schematic representation of the previous relationship is given on figure 9.4.
It shows the complex behavior of ventilated cavities with hysteresis effects. The
experimental procedure used to obtain the graph in figure 9.4 involves gradually
increasing the air flowrate up to high values before decreasing it.
Without pulsation
Without pulsation
R
k+1
R
k
2D flow
3D flow
R
k
,
R
k+1
= pulsating regimes
with k, k + 1 ... wavelengths
σ
m
0.3
0.2
0.1
0
0 0.01 0.03 0.05
Relative cavity underpressure σ
c
Volume airflow coefficient C
Qv
9.4 - Typical evolution of the relative cavity underpressure
for an increasing, then decreasing, air flowrate (
v
is constant)

FUNDAMENTALS OF CAVITATION200
The ambient pressure, and therefore the cavitation parameter s
v
, is large enough
so that no vapor cavity preexists before air injection. In fact, if such a vapor cavity
were present, the phenomena would practically be unchanged except for small
s
v
-values (lower than 0.2 typically) for which a very small rate of air injection
would result in a large increase in cavity length, disclosing a kind of global flow
instability.
Roughly speaking, the curve of figure 9.4 is L-shaped. For very small injection
rates, the air forms separate bubbles which are entrapped in the alternate B
ÉNARD-
K
ÁRMÁN vortices of the body wake. For larger air flowrates, a continuous cavity
appears and it becomes possible to measure the cavity pressure and to determine
the corresponding s
c
parameter. This condition corresponds to the starting point
on the right-hand side of the curve.
A subsequent small increase in the air flowrate produces a large increase in the air
pressure and in the cavity length. This is due to the difficulty for air to escape from
the cavity. On the contrary, on the vertical branch of the curve, air is evacuated via
big bubbles, which break from the cavity on its upper interface upstream of its
closure point due to gravity. This mode of air evacuation is very efficient, so that
the cavity pressure generally reaches a maximum. Hence, the parameter s
c
tends to
a minimum (s
m
) and the cavity length to a maximum.
The connecting region between the horizontal and the vertical branch of the curve
is characterized by periodic pulsations of the air cavity, which will be considered
more extensively in next section.
Examples of experimental curves
C
Qv c
()s
, corresponding to three water velocities
in the half-cavity configuration are shown in figure 9.5.
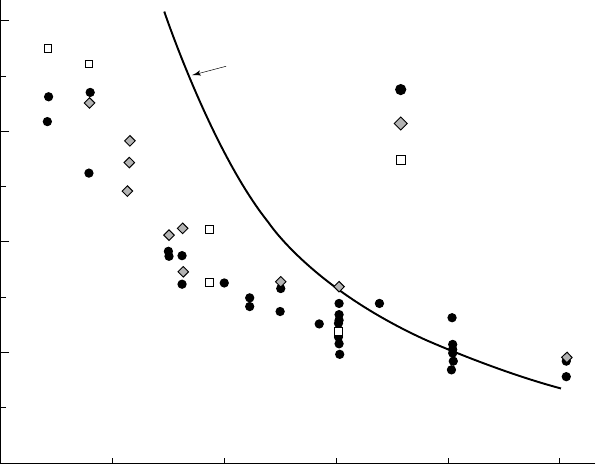
The minimum value s
m
of the relative cavity underpressure s
c
depends mainly
upon the F
ROUDE number
Fr V gH=
, as shown on figure 9.6. It decreases with the
F
ROUDE number, i.e. with the flow velocity for a given jet height. The parameter s
m
is also an increasing function of s
v
at constant FROUDE number, as seen in figure 9.6,
where several experimental points are indexed with the corresponding s
v
-values.
For reference purposes, figure 9.6 shows the curve
s
c
Fr= 2
2
/
corresponding to the
case of a jet with equal values of pressure on both sides. The pressure on the free
surface is assumed equal to the pressure inside the cavity and the jet is subject
only to gravity. When s
m
is smaller than 2/Fr
2
, which occurs for small values of
the F
ROUDE number, the pressure in the cavity is greater than the ambient pressure.
The water jet lies on a cushion of pressurized air and the transverse pressure
gradient promotes the rise of air bubbles. An increase in the air flow compels the
air to escape the cavity from its upper interface by separate bubbles, without any
increase in cavity length.
9 - VENTILATED SUPERCAVITIES 201
However, for larger values of the FROUDE number, the transverse pressure gradient
diminishes and tends to be reversed, which makes the rise of air bubbles more
difficult, so that a greater value of the cavity length, or a smaller value of s
m
, is
required for the appropriate air evacuation.
Pulsating
regime R
1
Non pulsating
regime
8 m/s
10 m/s
12 m/s
0.4
0.5
0.3
0.2
0.1
0
0.01 0.02 0.03 0.04 0.05
Relative cavity underpressure σ
c
Volume airflow coefficient C
Qv
9.5 - Evolution of the cavity pressure
c
with the air flowrate C
Qv
at constant ambient pressure
v
= 044.
in the case
of the half-cavity configuration
(
Hmm= 100 3.
,
hmm= 49 2.
)
The area S in the air flow coefficient is based on the height h and the width of the
test section (see fig. 9.3) [from L
AALI & MICHEL, 1984].
FUNDAMENTALS OF CAVITATION202
Regime R1
Regime R2
Non-pulsating regime
1.44
0.294
1.50
0.60
0.29
0.32
0.30
0.29
1.02
1.11
3.02
8.06
2
Fr
2
s
c
= –––
0.08
0.06
0.04
0.02
0
42681012
Minimum relative underpressure s
m
F
ROUDE
number Fr
9.6 - Variation of the minimum relative underpressure
m
with the FROUDE number for the half-cavity configuration
Several experimental points are indexed with the corresponding
s
v
-values.
[from L
AALI & MICHEL, 1984]
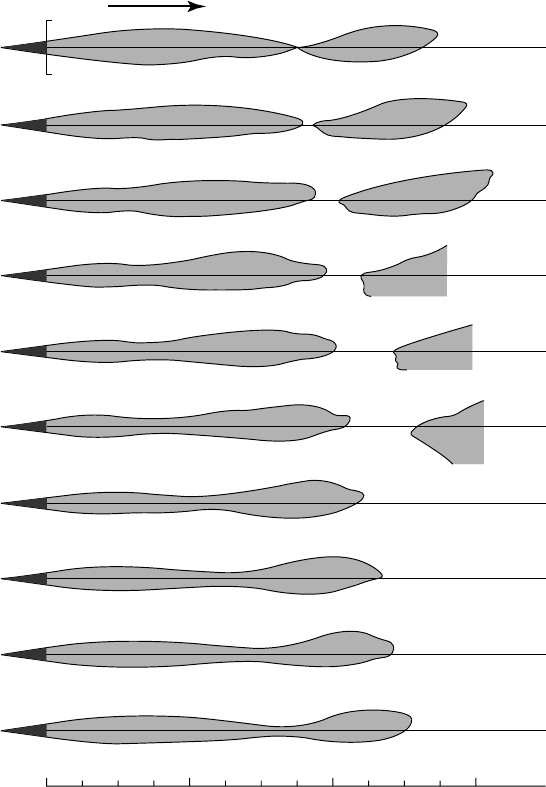
9.1.5. PULSATION REGIMES
The intermediate region in figure 9.4 is characterized by periodic pulsations of the
air cavity. In this case, undulations of increasing amplitude are convected on both
free frontiers of the ventilated cavity at a speed equal to the liquid velocity on the
interfaces. They join at the rear part of the cavity, allowing air to escape periodically
under the form of separate air pockets, as shown on figure 9.7.
The air pressure undergoes periodic and almost sinusoidal fluctuations in time.
The minimum pressure occurs when an air pocket leaves the cavity. At the same
time, undulations of the free surface arise at the two trailing edges of the wedge.
The cavity, as it reaches its minimum length, has the shape of one or several
spindles. The corresponding flow regimes are named R
1
, R
2
, ..., R
k
according to
the number k of spindles. Regime R
2
is presented in figure 9.12. In general, high
order regimes are obtained for large values of the ambient pressure or, more
precisely, for small values of the parameter
ss
ca
/
.
9 - VENTILATED SUPERCAVITIES 203
40 mm
– 40 mm
600
mm
4002000
0
0.1 T
0.2 T
0.3 T
0.4 T
0.5 T
0.6 T
0.7 T
0.8 T
0.9 T
9.7 - Evolution of a one-wave cavity during one period
of pulsation for V ==
==
4 m/s,
c
= 0.111,
c
/
a
= 0.137
The pulsation frequency is
fHz= 11 1.
for this R
1
regime. A slight gravitational effect
is visible [from M
ICHEL, 1971].
The passage from one regime R
k
to the next R
k+1
occurs for critical values of the
volumetric air flow coefficient. It is accompanied by a jump in both the cavity
pressure and the cavity length. The critical values of C
Qv
are different for increasing
or decreasing injection rates (see fig. 9.4), so that the curve
C
Qv c
()s
presents
hysteresis loops.