FIRE protection found. Пожарная безопасность театров
Подождите немного. Документ загружается.

Ove Arup & Partners Consulting Engineers PC
Fire Safety in Theaters – A New Design Approach
Part I Assessment of Fire Safety Measures in Proscenium Theater
s
F:\06 PROJECTS\CURRENT PROJECTS\076040-49 THEATER PROJECT
DTX\REPORT\076040-49_THEATRE_R_20090910.DOC
Page
13/36
Ove Arup & Partners Consulting Engineers PC
10 September 2009
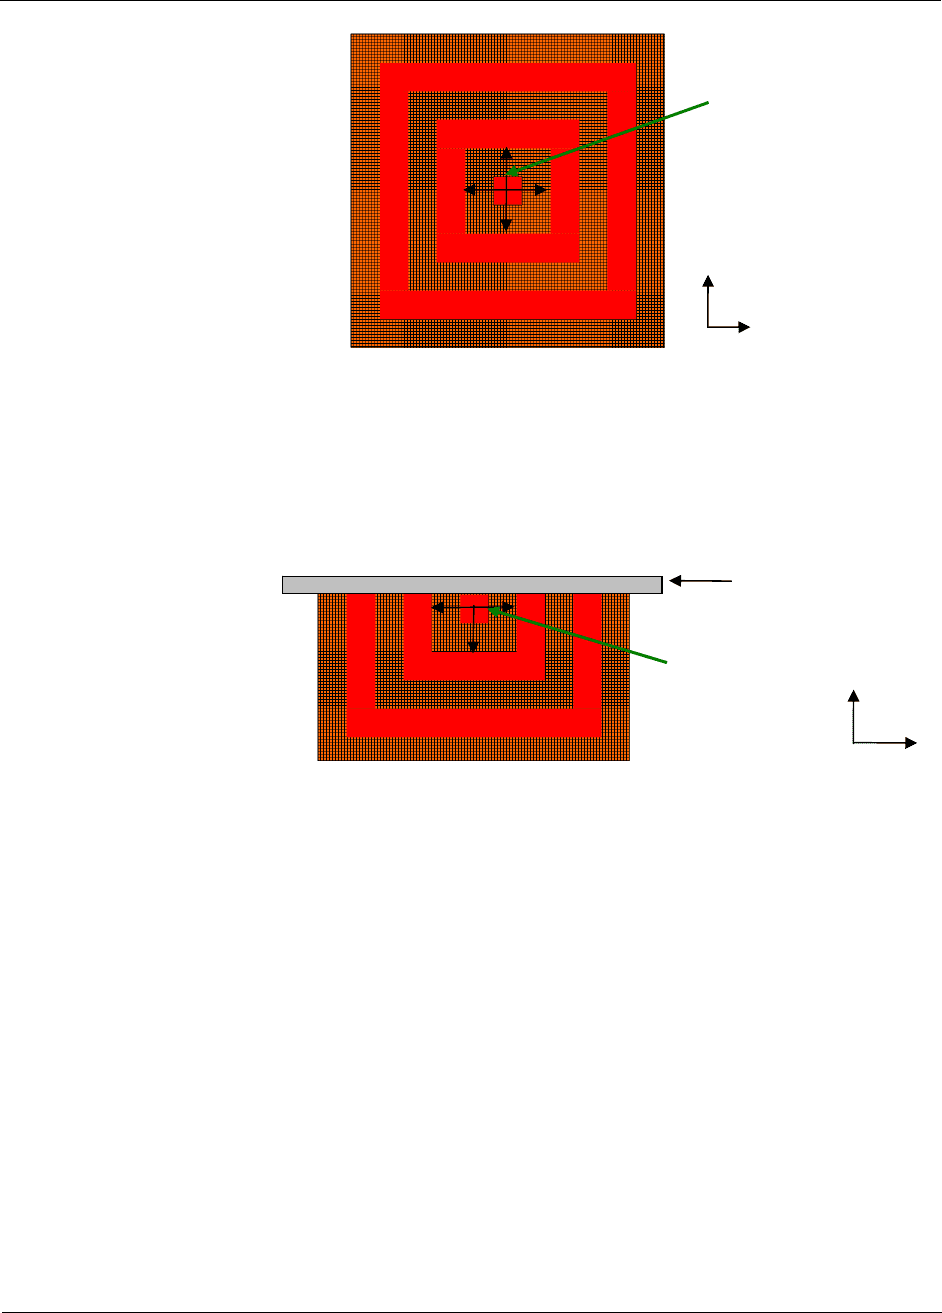
Figure 6 – Image illustrating lateral fire spread used in Fire Scenario 1
4.5.2 Fire Scenario 2
A fire occurring against the wing side wall “spreads” laterally in three directions at the same
rate while the heat release rate follows a fast t-squared growth curve, maintaining the heat
release rate density of 500 kW/m².
Figure 7 – Image illustrating lateral fire spread used in Fire Scenario 2.
4.5.3
Fire Scenario 3
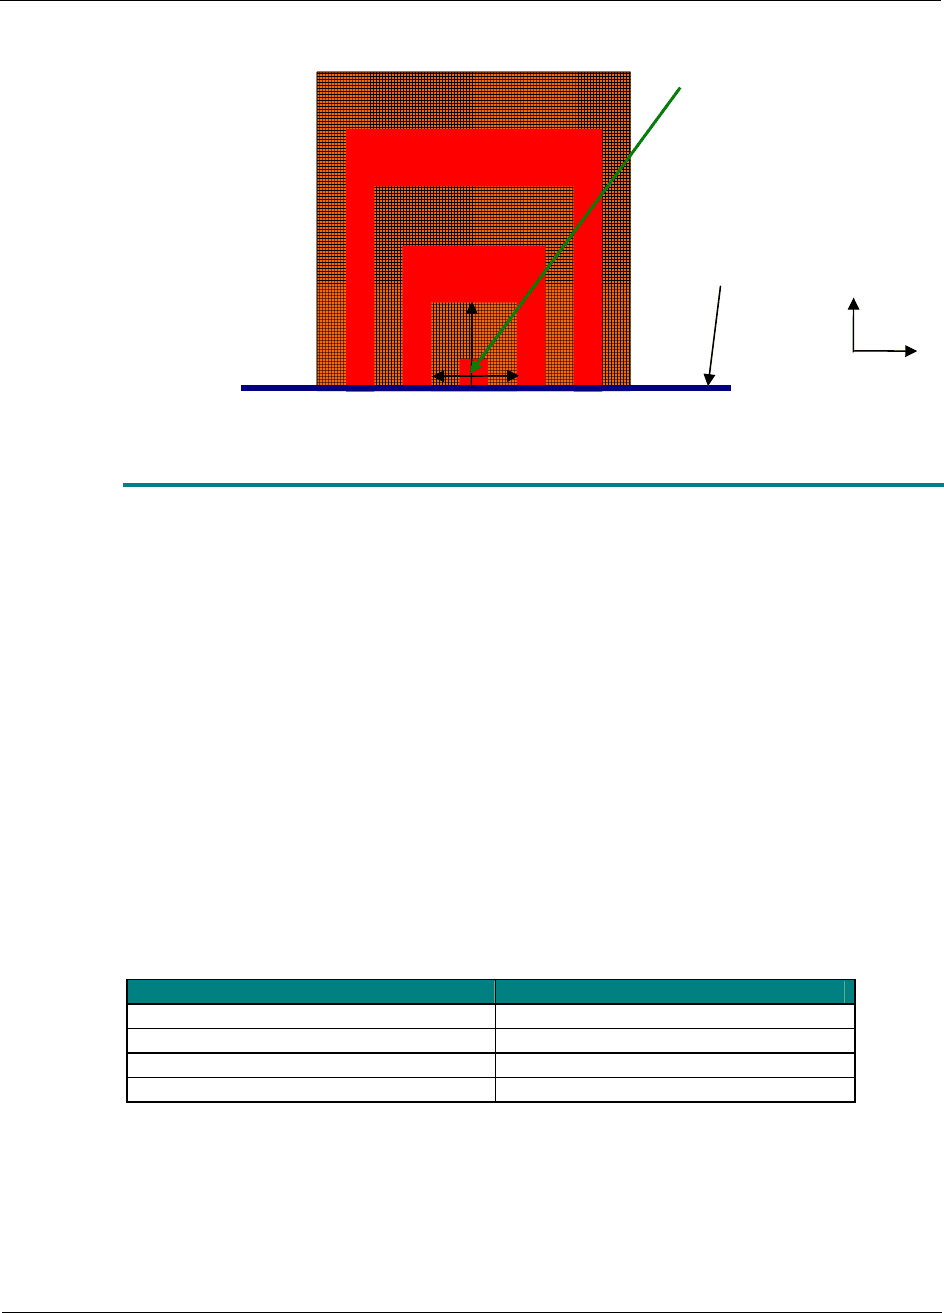
A fire is assumed to occur at the bottom of the rigging on the both sides of flown scenery
and “spreads” laterally and upwardly in three directions (See Figure 5 and Figure 8). The
following additional assumptions are used:
• No burn out of fuel is assumed.
• No fire spread to adjacent scenery is modeled.
• The upward flame spread rate is assumed to be twice as fast as the lateral one.
The heat release rate follows a fast t-squared growth curve and a nominal heat release rate
density of 500 kW/m² was maintained throughout the simulation.
X-axis
Y-axis
X-axis
Y-axis
Wall
Direction(s)
of “spread”
Direction(s)
of “spread”
Ove Arup & Partners Consulting Engineers PC
Fire Safety in Theaters – A New Design Approach
Part I Assessment of Fire Safety Measures in Proscenium Theater
s
F:\06 PROJECTS\CURRENT PROJECTS\076040-49 THEATER PROJECT
DTX\REPORT\076040-49_THEATRE_R_20090910.DOC
Page
14/36
Ove Arup & Partners Consulting Engineers PC
10 September 2009
Figure 8 – Image illustrating vertical fire spread used in Fire Scenario 3
4.6 Instrumentation
A myriad of “sensors” measuring gas temperatures and velocities were placed in the CFD
domain. This allows each measurement point to be analyzed as a fusible link, a heat
detector, or a sprinkler, thereby providing the following benefits:
• The response times with the various parameter values such as RTI, conductive loss
factor, and activation temperature can be obtained without inserting duplicate
sprinkler/heat detector devices at each location.
• Other device response times that are not incorporated in FDS (i.e.., rate-of-rise heat
detectors) can be estimated.
The methodology for estimating “device” activation is detailed in Appendix F.
4.6.1
Sprinklers
As suggested by Mak [17], a range of RTI values ranging from 50 m
½
s
½
to 250 m
½
s
½
were
utilized in the model post-processing (See Table 5). An activation temperature of 74°C has
been used throughout the study. Based on the findings from the grid resolution study, the
omission of a conductive loss factor may lead to early response times; thus a conductive
loss factor of 0.7 has employed throughout the analysis as reported in [9].
Table 5 – Classification of Sprinkler by RTI values [17]
Type RTI [m
½
s
½
(ft
½
·s
½
)]
Fast/Quick Response (3 mm) 50 (90)
Intermediate Response (4 mm) 80 (140)
Standard Response (5 mm) 135 (235)
Standard Response (8 mm) 250 (435)
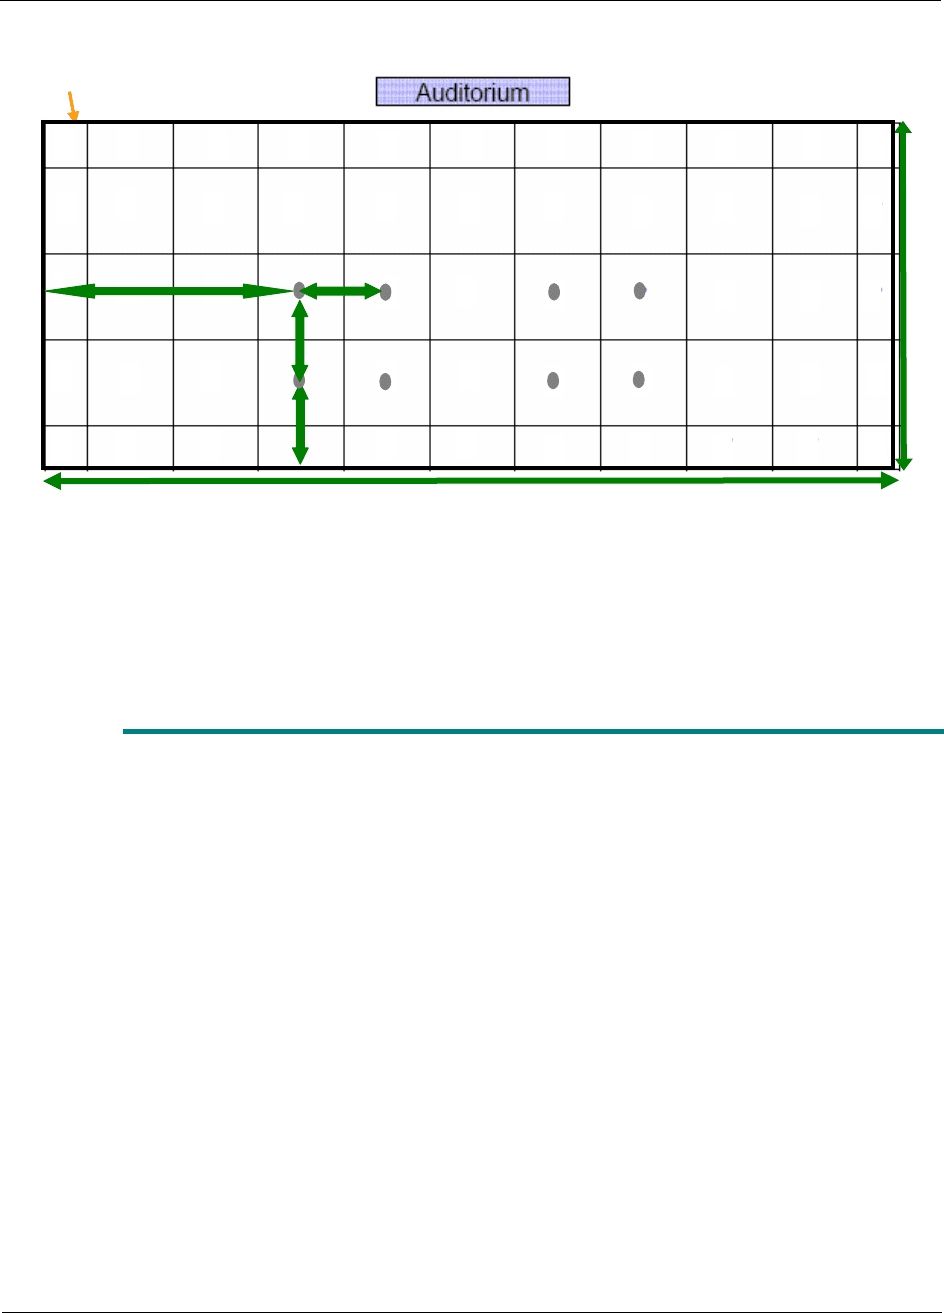
Based on an ordinary hazard classification shown in NFPA 13 [15], the “probes” were
placed to have an 11 ft x 11 ft spacing at 6” below the ceiling and at the elevation of the
gridiron (See Figure 9 through Figure 11).
X
-axis
Z-axis
Bottom of
flown
scenery
Direction(s)
of “spread”
Ove Arup & Partners Consulting Engineers PC
Fire Safety in Theaters – A New Design Approach
Part I Assessment of Fire Safety Measures in Proscenium Theater
s
F:\06 PROJECTS\CURRENT PROJECTS\076040-49 THEATER PROJECT
DTX\REPORT\076040-49_THEATRE_R_20090910.DOC
Page
15/36
Ove Arup & Partners Consulting Engineers PC
10 September 2009
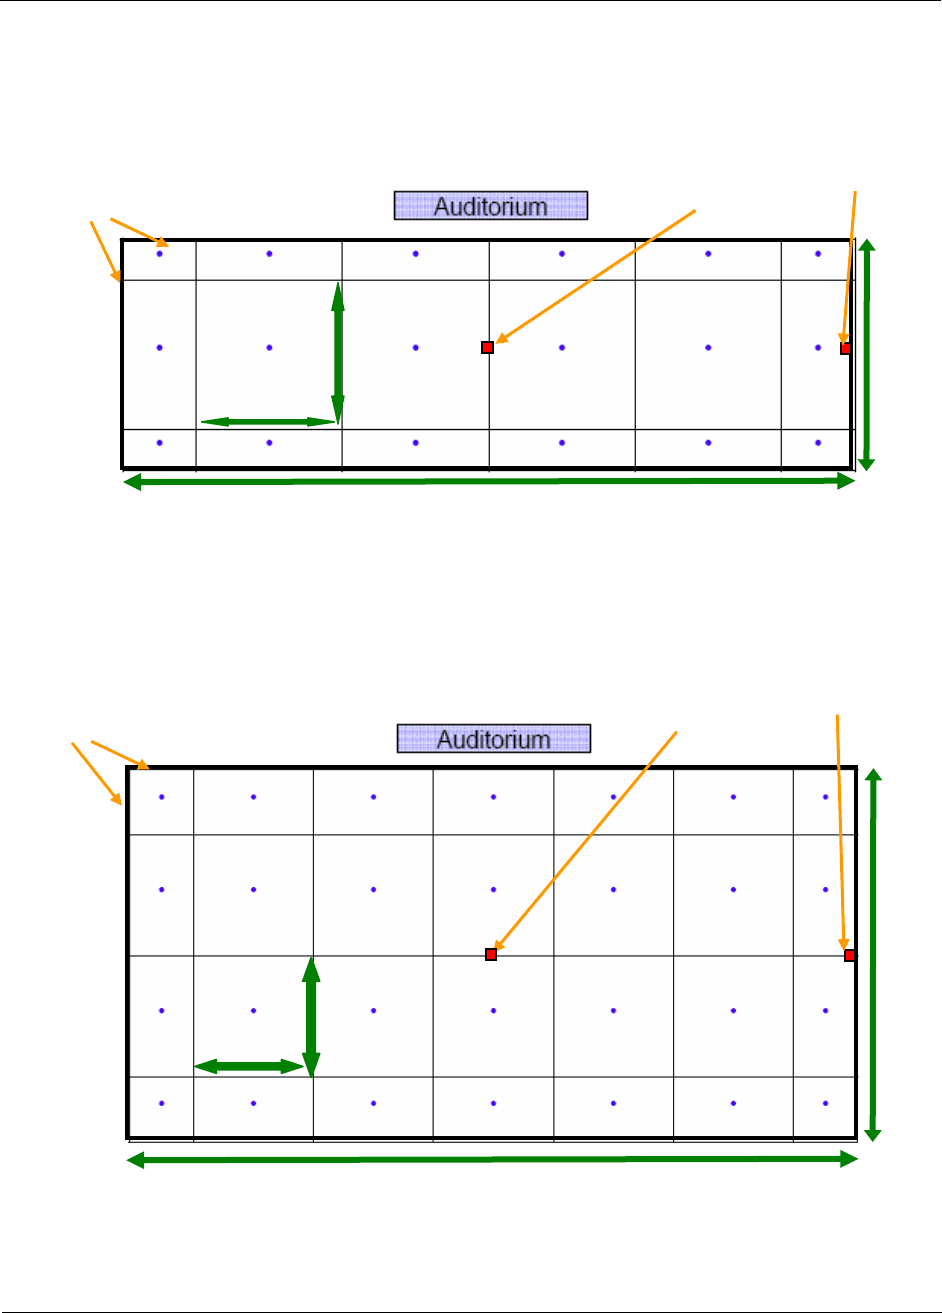
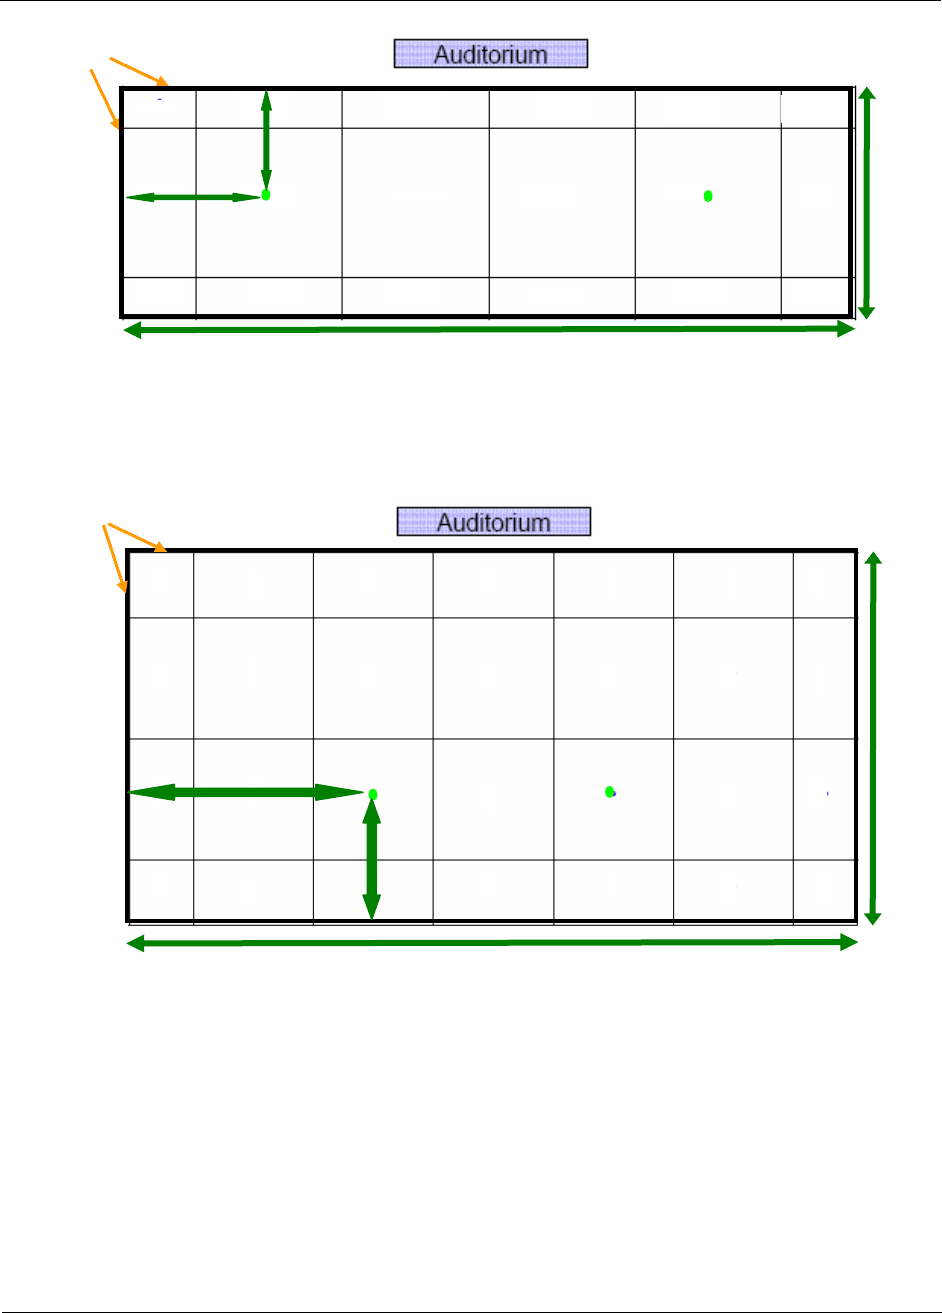
Figure 9 – Layout of sprinklers (blue dot) with the locations of fire in plan in the small-sized
theatre model
Figure 10 – Layout of sprinklers (blue dot) with the locations of fire in plan in the medium-sized
theatre model
28.5 ft
11 ft
68.1 ft
11 ft
39.1 ft
11 ft
63.4 ft
11 ft
Stage Walls
Fire center in
scenarios 1 and 3
Fire center in
scenario 2
Stage Walls
Fire center in
scenarios 1 and 3
Fire center in
scenario 2
Ove Arup & Partners Consulting Engineers PC
Fire Safety in Theaters – A New Design Approach
Part I Assessment of Fire Safety Measures in Proscenium Theater
s
F:\06 PROJECTS\CURRENT PROJECTS\076040-49 THEATER PROJECT
DTX\REPORT\076040-49_THEATRE_R_20090910.DOC
Page
16/36
Ove Arup & Partners Consulting Engineers PC
10 September 2009
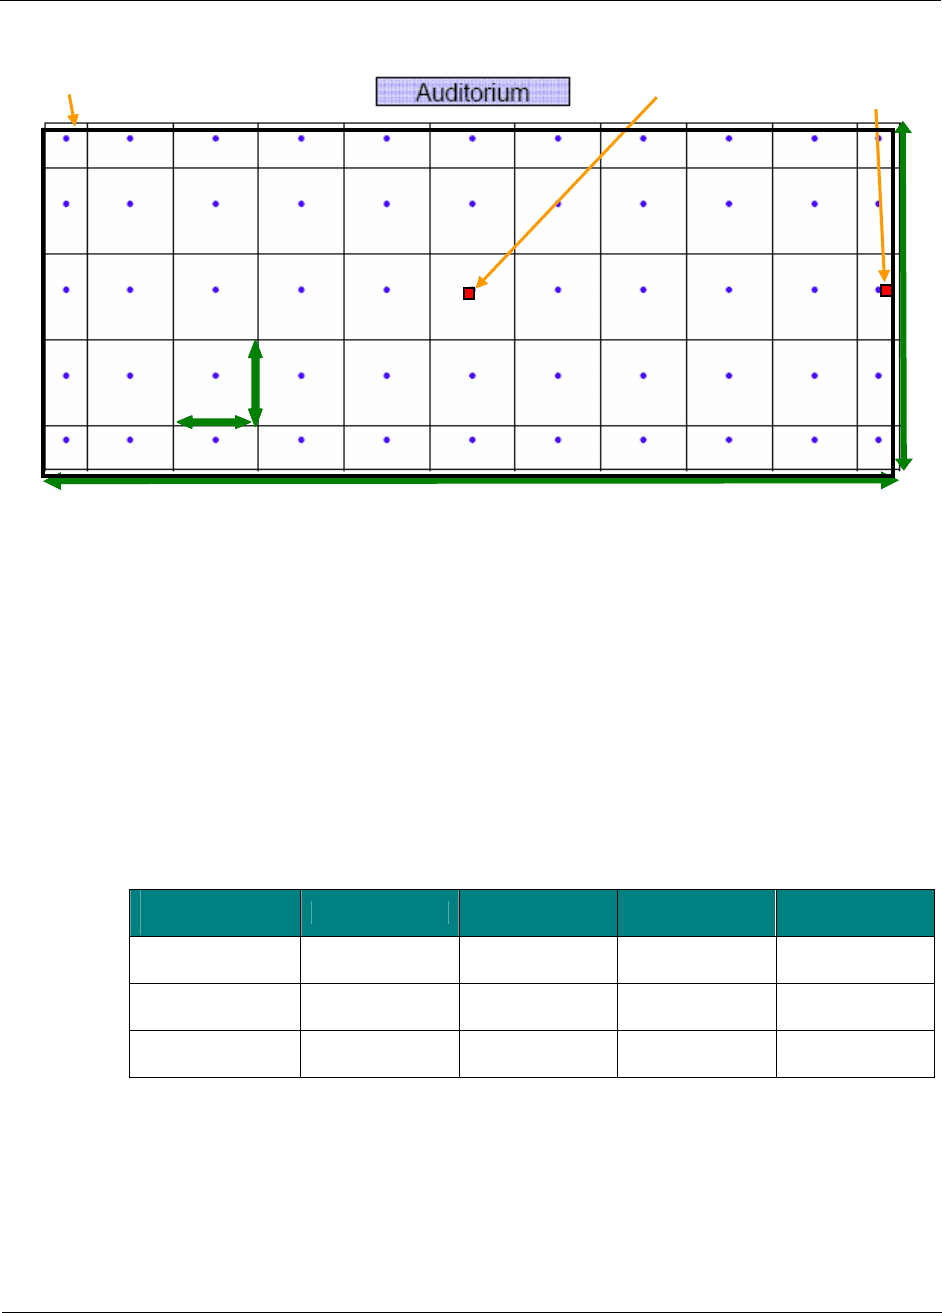
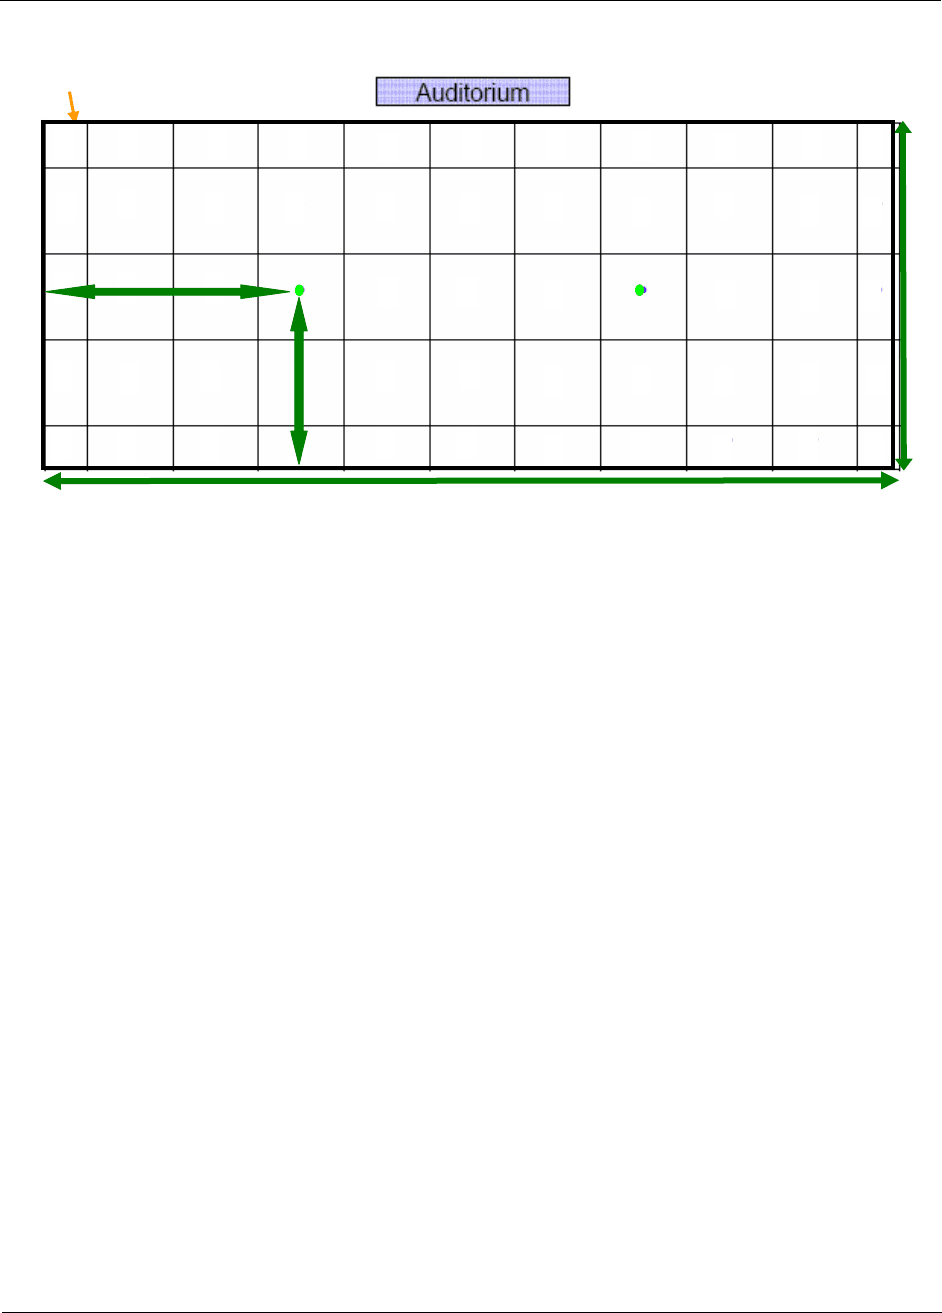
Figure 11 – Layout of sprinklers (blue dot) with the locations of fire in plan in the large- sized
theatre model
4.6.2 Rate-of-Rise Heat Detectors
FM 3210 [18] classifies rate-of-rise heat detectors into four different categories based on the
Plunge Tunnel tests conducted in FM Approvals (See Table 6).
A range of RTI values from 66 [ms]
1/2
to 330 [ms]
1/2
and a temperature rating of 57 °C were
utilized in this study. The threshold rate of rise temperature of 0.15°C/sec (9°C/min) is used
for estimating a detection time.
Table 6 – Classification of rate-of-rise heat detectors with determined threshold of rate-of-rise
temperature (9 °C/min (16 °F/min)) and RTI values
Temperature
Rating
Quick Fast Very Fast Ultra Fast
57 °C(135 °F)
<600 [fts]
1/2
<330 [ms]
1/2
<420 [fts]
1/2
<230 [ms]
1/2
<320 [fts]
1/2
<176 [ms]
1/2
<120 [fts]
1/2
<66 [ms]
1/2
71 °C(160 °F)
<950 [fts]
1/2
<520 [ms]
1/2
<650 [fts]
1/2
<360 [ms]
1/2
<500 [fts]
1/2
<275 [ms]
1/2
<220 [fts]
1/2
<120 [ms]
1/2
88 °C(190 °F)
<1400 [fts]
1/2
<770 [ms]
1/2
<1000 [fts]
1/2
<550 [ms]
1/2
<750 [fts]
1/2
<412 [ms]
1/2
<350 [fts]
1/2
<193 [ms]
1/2
There is no established guideline with respect to a placement of the rate-of-rise heat
detectors above the proscenium wall opening. The rate-of-rise heat detectors were
therefore placed against the proscenium wall (wall-mounted heat detectors) at 6” below a
ceiling at three points based on the current design practices. One is located above the
middle point of the proscenium opening and one each at either end of the opening as
illustrated in Figure 12. For comparison purposes, additional “devices” representing the
ceiling-mounted rate-of-rise heat detectors have been placed as shown in Figure 13 through
113.3 ft
11 ft
48.3 ft
11 ft
Stage Walls
Fire center in
scenarios 1 and 3
Fire center in
scenario 2
Ove Arup & Partners Consulting Engineers PC
Fire Safety in Theaters – A New Design Approach
Part I Assessment of Fire Safety Measures in Proscenium Theater
s
F:\06 PROJECTS\CURRENT PROJECTS\076040-49 THEATER PROJECT
DTX\REPORT\076040-49_THEATRE_R_20090910.DOC
Page
17/36
Ove Arup & Partners Consulting Engineers PC
10 September 2009
Figure 15. The intent of the additional instrumentation was to provide information regarding
“optimal” detector placement.
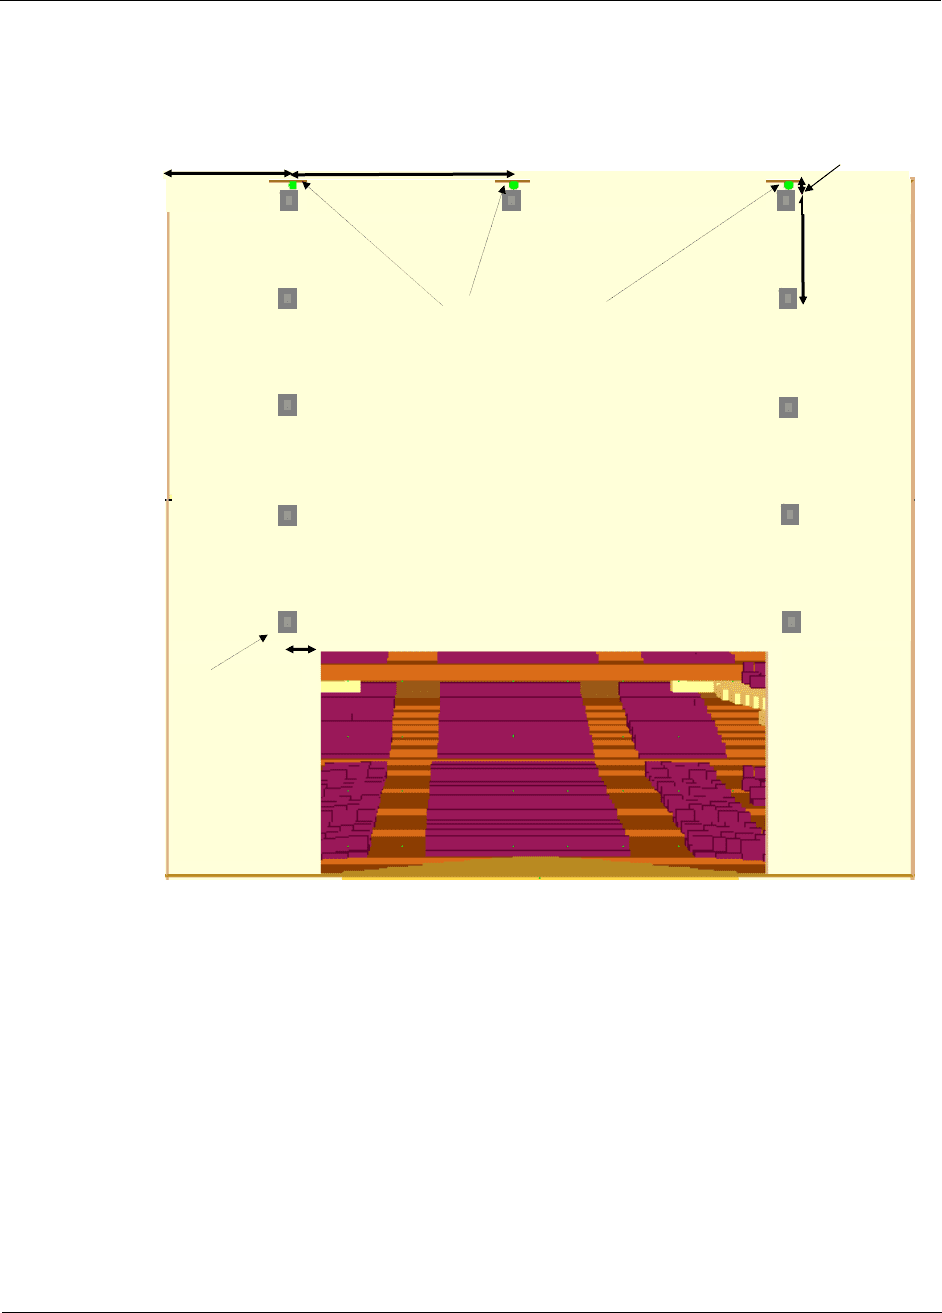
Figure 12 – Illustration of the layout of rate-of-rise heat detectors and fusible links looking
proscenium wall from stage side in the medium-sized theatre model
10 ft
fusible link
0.5 ft
~11.5 ft
~27.5 ft
RoR Heat Detectors
(green dots)
~2.3 ft
Ove Arup & Partners Consulting Engineers PC
Fire Safety in Theaters – A New Design Approach
Part I Assessment of Fire Safety Measures in Proscenium Theater
s
F:\06 PROJECTS\CURRENT PROJECTS\076040-49 THEATER PROJECT
DTX\REPORT\076040-49_THEATRE_R_20090910.DOC
Page
18/36
Ove Arup & Partners Consulting Engineers PC
10 September 2009
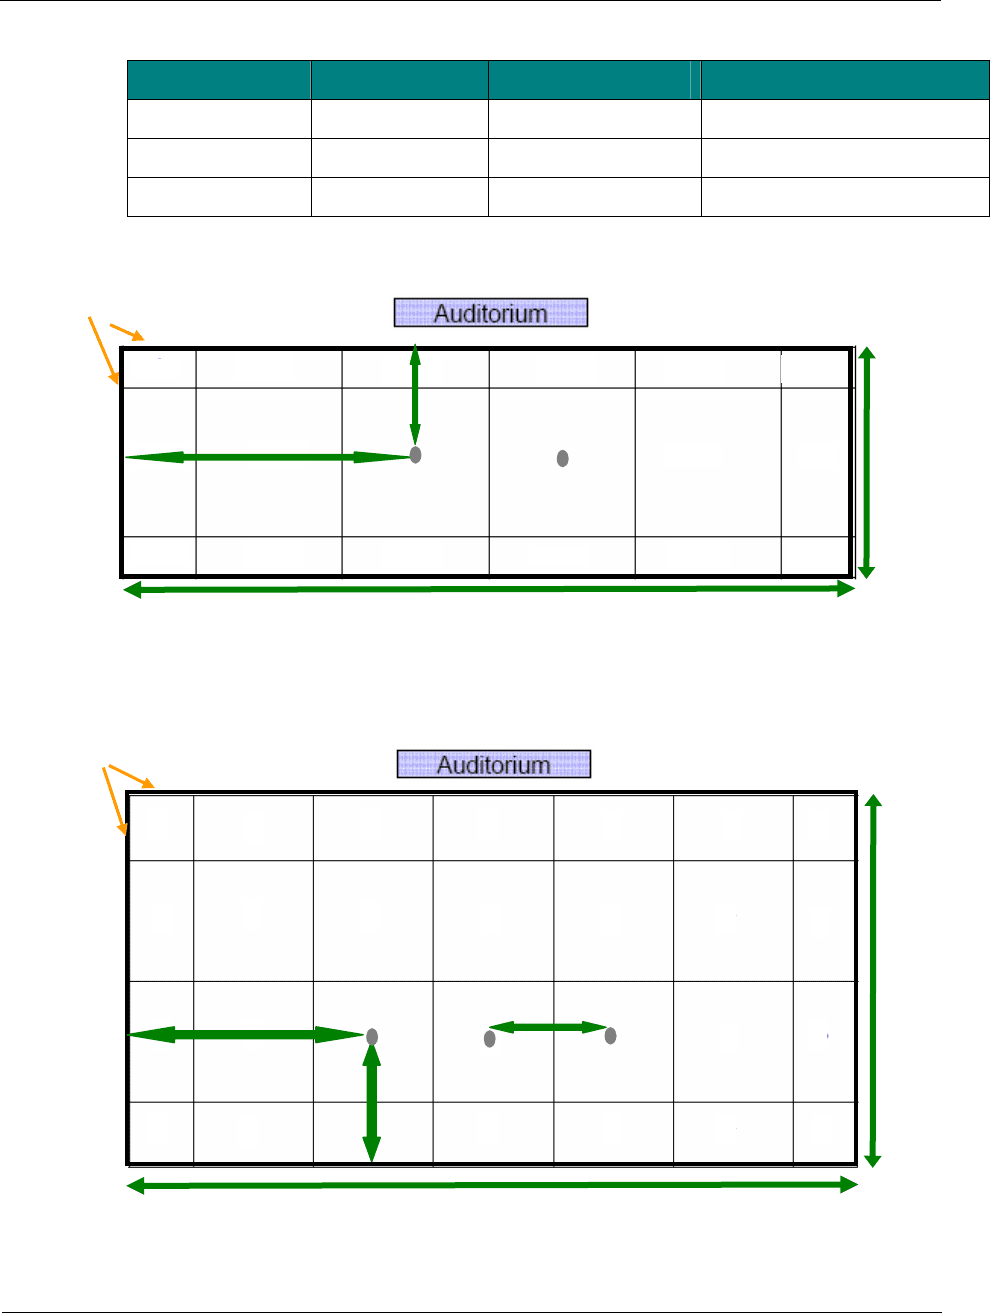
Figure 13 – Locations of ceiling mounted rate-of-rise heat detectors (green dot) in plan in the
small-sized model.
Figure 14 – Locations of ceiling mounted rate-of-rise heat detectors (red dot) in plan in the
medium-sized theater model.
28.5 ft
68.1 ft
23.1 ft
39.1 ft
14.1 ft
63.4 ft
15.2 ft
Stage Walls
Stage Walls
14.25 ft
Ove Arup & Partners Consulting Engineers PC
Fire Safety in Theaters – A New Design Approach
Part I Assessment of Fire Safety Measures in Proscenium Theater
s
F:\06 PROJECTS\CURRENT PROJECTS\076040-49 THEATER PROJECT
DTX\REPORT\076040-49_THEATRE_R_20090910.DOC
Page
19/36
Ove Arup & Partners Consulting Engineers PC
10 September 2009
Figure 15 – Locations of ceiling mounted rate-of-rise heat detectors (red dot) in plan in the
large-sized theater model.
4.6.3
Fusible Links
The fusible links along the fire safety curtain release line need to be spaced every 15 ft
based on Section 20 in NFPA 80 [19]. In the CFD models, as shown in Figure 12, the
“devices” are placed at an interval of 10 ft vertically and placed at the identical locations of
the rate-of-rise heat detector horizontally above the proscenium opening (i.e., one in the
middle point and one each at either end of the opening).
The locations of the fusible links of roof vents are shown in Figure 16 through Figure 18. As
no specific guideline regarding placement of the roof vents is available, it was determined
based on the following IBC requirements [2] and information:
• Two or more roof vents are required to be provided [2];
• Aggregate clear area of the openings is to be no less than 5% of the stage area [2] (See
Table 7);
• Vents are required to be located near the center and above the highest part of the stage
area [2];
• Available sizes of the roof vents in the market [20];
• Design input from a theatre design consultant;
113.3 ft
34.6 ft
48.3 ft
24.1 ft
Stage Walls
Ove Arup & Partners Consulting Engineers PC
Fire Safety in Theaters – A New Design Approach
Part I Assessment of Fire Safety Measures in Proscenium Theater
s
F:\06 PROJECTS\CURRENT PROJECTS\076040-49 THEATER PROJECT
DTX\REPORT\076040-49_THEATRE_R_20090910.DOC
Page
20/36
Ove Arup & Partners Consulting Engineers PC
10 September 2009
Table 7 – Required area of the roof vent openings and specifications of roof vents modeled.
Theatre Floor Area [ft²] 5 % of Floor Area [ft²] Roof vents modeled [20]
Small 1807 91 Two 60” x 120” vents
Medium 2663 134 Three 60” x 120” vents
Large 5473 274 Eight 60” x 96” vents
Figure 16 – Locations of fusible links of roof vents (gray dot) in plan in the small sized model.
Figure 17 – Locations of fusible links of roof vents (gray dot)) in plan in the medium-sized
model.
28.5 ft
68.1 ft
23.1 ft
39.1 ft
14.1 ft
63.4 ft
26.2 ft
Stage Walls
Stage Walls
14.25 ft
11 ft
Ove Arup & Partners Consulting Engineers PC
Fire Safety in Theaters – A New Design Approach
Part I Assessment of Fire Safety Measures in Proscenium Theater
s
F:\06 PROJECTS\CURRENT PROJECTS\076040-49 THEATER PROJECT
DTX\REPORT\076040-49_THEATRE_R_20090910.DOC
Page
21/36
Ove Arup & Partners Consulting Engineers PC
10 September 2009
Figure 18 – Locations of fusible links of roof vents (gray dot) in plan in the large-sized model.
Reported RTI values for fusible links ranged from 167 to 180 (ms)
1/2
[21]. The RTI value of
175 (ms)
1/2
was selected and used throughout this study.
4.7 Assumption and Limitations
The CFD studies are carried out based on the following assumptions and limitations:
• A fast growth fire has been assumed.
• The following are not explicitly modelled:
o Sprinkler water spray;
o Operation (e.g., deploying or opening) of a fire safety curtain and a roof vent;
o Radiation heat transfer.
• The fire is allowed to continue to grow after the initial sprinkler or device activation.
• The heat release rate density is assumed to be 500 kW/m² , representative of mixture of
wood and other combustible materials.
• All doors in the auditorium are open throughout the simulation to allow make-up air to
enter and to avoid pressurization due to thermal expansion.
• A flat ceiling is assumed.
• The gridiron is assumed 100 % open to airflow.
• All linesets are occupied with scenery with an exception of a fire originating in the
rigging. As for the case of a fire occurring in the rigging, the hangings adjacent to the
fire are not input in order to allow pathways to provide adequate air for combustion.
113.3 ft
34.6 ft
48.3 ft
13.1 ft
Stage Walls
11 ft
11 ft

Ove Arup & Partners Consulting Engineers PC
Fire Safety in Theaters – A New Design Approach
Part I Assessment of Fire Safety Measures in Proscenium Theater
s
F:\06 PROJECTS\CURRENT PROJECTS\076040-49 THEATER PROJECT
DTX\REPORT\076040-49_THEATRE_R_20090910.DOC
Page
22/36
Ove Arup & Partners Consulting Engineers PC
10 September 2009
• Fuel burn out is not accounted for.
• The ambient temperature is assumed to be 20 °C.
• Fire protection systems are not activated by manual operation means.
• The results presented herein are based on the fire scenarios and the locations of the
fire protection devices modelled.