Everitt B.S. The Cambridge Dictionary of Statistics
Подождите немного. Документ загружается.

Fishi ng expedition: Synonym for data dredging.
Fitted value: Usually used to refer to the value of the response variable as predicted by some
estimated model.
Five-number summary: A method of summarizing a set of observations using the minimum
value, the lower quartile, the median, upper quartile and maximum value. Forms the basis
of the
box-and-whisker plot
.[Exploratory Data Analysis, 1977, J. W. Tukey, Addison-
Wesley, Reading, MA.]
Fixed effects: The effects attributable to a finite set of levels of a factor that are of speci fic interest.
For example, the investigator may wish to compare the effects of three particular drugs
on a response variable.
Fixed effects models
are those that contain only factors with this
type of effect. See also multilevel models.
Fixed effects model: See fixed effects.
Fixed population: A group of individuals defined by a common fixed characteristic, such as all
men born in Essex in 1944. Membership of such a population does not change over time
by immigration or emigration. [Radiology, 1982, 143, 469–74.]
Fix^Neyman process: A stochastic model used to describe recovery, relapse, death and loss
of patients in medical follow-up studies of cancer patients. [Human Biology, 1951, 23,
205–41.]
Fleiss, Joseph (1937^2003): Born in Brooklyn, New York, Fleiss studied at Columbia College,
graduating in 1959. In 1961 he received an M.S. degree in Biostatistics from the Columbia
School of Public Health, and six years later completed his Ph.D. dissertation on ‘Analysis
of variance in assessing errors in interview data’. In 1975 Fleiss became Professor and
Head of the Division of Biostatistics at the School of Public Health in Columbia
University. He made influential contributions in the analysis of categorical data and
clinical trials
and wrote two classic biostatistical texts, Statistical Methods for Rates and
Proportions and The Design and Analysis of Clinical Experiments. Fleiss died on 12 June
2003, in Ridgewood, New Jersey.
Flingner ^ Policello test: A robust rank test for the
Behrens–Fisher problem
. [NSM Chapter 4.]
Fligner^Wolfe test: A
distribution free method
designed for the setting where one of the treat-
ments in a study corresponds to a control or baseline set of conditions and interest centres
on assessing which, if any, of the treatments are better than the control. The test statistic
arises from combining all N observations from the k groups and ordering them from least
to greatest. If r
ij
is the rank of the jth observation in the ith group the test statistic is given
specifically by
FW ¼
X
k
j¼2
X
n
j
i¼1
r
ij
the summations being over the non-control groups. Critical values of FW are available in
appropriate tables, and a large-sample approximation can also be found. [NSM
Chapter 6.]
Floor effect: See ceiling effect.
Flow-chart: A graphical display illustrating the interrelationships between the different components
of a system. It acts as a convenient bridge between the conceptualization of a model and the
construction of equations.
169

Folded log: A term sometimes used for half the
logistic transformation
of a proportion.
Folded normal distribution: The probability distribution of Z ¼jX j, where the random
variable, X, has a normal distribution with zero mean and variance σ
2
. Given specifically by
f ðzÞ¼
1
ffiffiffi
2
p
r
e
z
2
=2
2
[Handbook of the Normal Distribution, 2nd edition, 1996, J. K. Patel and C. B. Read,
Marcel Dekker, New York.]
Folded square root: A term sometimes used for the following transformation of a proportion p
ffiffiffiffiffi
2p
p
ffiffiffiffiffiffiffiffiffiffiffiffiffiffiffiffiffi
2ð1 pÞ
p
Foldover design: A design used to augment a
fractional factorial design
, which is obtained by
reversing the signs of all columns of the original
design matrix
. The original design runs are
combined with the mirror-image foldover design runs, and the combination can then be used
to estimate all the main effects clear of any two-factor interactions. [Statistics and
Probability Letters, 2003, 3, 245–250.]
Foldover frequency: Synonym for Nyquist frequency.
Flog: An unattractive synonym for folded log.
Focus groups: A research technique used to collect data through group interaction on a topic
determined by the researcher. The goal in such groups is to learn the opinions and values
of those involved with products and/or services from diverse points of view. [American
Journal of Sociology, 1996, 22, 129–52.]
Folk theorem of queuei ng behaviour: The queue you join moves the slowest.
Fol lmann’s test: A one-sided modified
Hotelling’s T
2
test for multivariate normally distributed
variables that combines ease of use, theoretically exact control of the significance level and
good power to detect a large spectrum of alternative hypotheses. [Journal of the American
Statistical Association, 1996, 91, 854–861.]
Fol lowback surveys: Surveys which use lists associated with vital statistics to sample individuals
for further information. For example, the 1988 National Mortality Followback Survey
sampled death certificates for 1986 decedents 25 years or older that were filed in the USA.
Information was then sought from the next of kin or some other person familiar with the
decedent, and from health care facilities used by the decedent in the last year of life.
Information was obtained by emailed questionnaire, or by telephone or personal interview.
Another example of such a survey is the 1988 National Maternal and Infant Health Survey,
the live birth component of which sampled birth certificates of live births in the USA.
Mothers corresponding to the sampled birth certificates were then mailed a questionnaire.
The sample designs of this type of survey are usually quite simple, involving a stratified
selection of individuals from a list frame. [American Journal of Industrial Medicine, 1995,
27, 195–205.]
Fol low-up: The process of locating research subjects or patients to determine whether or not some
outcome of interest has occurred. [SMR Chapter 13.]
Fol low-up plots: Plots for following up the frequency and patterns of
longitudinal data
. In one
version the vertical axis consists of the time units of the study. Each subject is represented
170
by a column, which is a vertical line proportional in length to the subject’s total time in
the system. [The American Statistician, 1995, 49, 139–44.]
Force of mortality: Synonym for hazard function.
Forecast: The specific projection that an investigator believes is most likely to provide an accurate
prediction of a future value of some process. Generally used in the context of the analysis of
time series
. Many different methods of forecasting are available, for example
autoregressive
integrated moving average models
.[Statistical Forecasting , 1976, W.G. Gilchrist, Wiley,
London.]
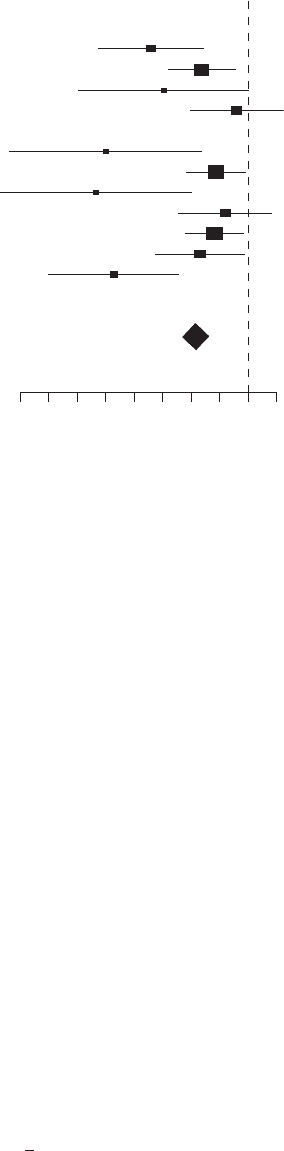
Forestplot: A name sometimes given to a type of diagram commonly used in
meta-analysis
, in which
point estimates and confidence intervals are displayed for all studies included in the analysis.
An example from a meta-analysis of clozapine v other drugs in the treatment of schizo-
phrenia is shown in Fig. 63. A drawback of such a plot is that the viewer’s eyes are often
drawn to the least significant studies, because these have the widest confidence intervals and
are graphically more imposing. [Methods in Meta-Analysis, 2000, A. J. Sutton, K. R.
Abrams, D. R. Jones, T. A. Sheldon, and F. Song, Wiley, Chichester, UK.]
Forward-looking study: An alternative term for
prospective study
.
Forward selection procedure: See selection methods in regression.
Fourfo ld table: Synonym for two-by-two contingency table.
Fourier coefficients: See Fourier series.
Fouri er series: A series used in the analysis of generally a periodic function into its constituent
sine waves of different frequencies and amplitudes. The series is
1
2
a
0
þ
X
ða
n
cos nx þ b
n
sin nxÞ
Odds ratio
0.03 0.06 0.16 0.40 1.00
Summary
George
Trazzera
Ramsay
Ciresi
Collins
Heard
Bach
(b)
Bach
(a)
Hannan
vanHeerden
Maki
Tennenberg
Study Reference
Fig. 63 Forest plot.
171

where the coefficients are chosen so that the series converges to the function of interest,
f; these coefficients (the Fourier coefficients) are given by
a
n
¼
1
p
Z
p
p
f ðxÞcos nx dx
b
n
¼
1
p
Z
p
p
f ðxÞsin nx dx
for n =1,2,3,.... See also fast Fourier transformation and wavelet analysis. [TMS
Chapter 7.]
Fou ri er tra nsfo rm: See fast Fourier transformation.
Fractal: A term used to describe a geometrical object that continues to exhibit detailed structure over
a large range of scales. Snowflakes and coastlines are frequently quoted examples. A
medical example is provided by electrocardiograms. [The Fractal Geometry of Nature,
1982, B. B. Mandelbrot, Freeman, San Francisco.]
Fractal dimension: A numerical measure of the degree of roughness of a
fractal
. Need not be a
whole number, for example, the value for a typical coastline is between 1.15 and 1.25. [The
Fractal Geometry of Nature, 1982, B.B. Mandelbrot, W.H. Freeman, San Francisco.]
Fractional factorial design: Designs in which information on main effects and low-order inter-
actions are obtained by running only a fraction of the complete factorial experiment and
assuming that particular high-order interactions are negligible. Among the most widely
used type of designs in industry. See also response surface methodology.[Experimental
Designs, 2nd edition, 1992, W. G. Cochran and G. M. Cox, Wiley, New York.]
Fractional polynomials: An extended family of curves which are often more useful than low- or
high-order polynomials for modelling the often curved relationship between a response
variable and one or more continuous covariates. Formally such a polynomial of degree m is
defined as
m
ðX : β; pÞ¼β
0
þ
X
m
j¼1
β
j
X
ðp
j
Þ
where p
0
¼½p
1
; ...; p
m
is a real-valued vector of powers with p
1
5
p
2
5
5
p
m
and β
0
¼½β
0
; ...; β
m
are real-valued coefficients. The round bracket notation signifies
the Box–Tidwell transformation
X
ðp
j
Þ
¼ X
p
j
if p
j
6¼ 0
¼ ln X if p
j
¼ 0
So, for example, a fractional polynomial of degree 3 with powers (1,2,0) is of the form
β
0
þ β
1
X þ β
2
X
2
þ β
3
logðX Þ
[International Journal of Epidemiology, 1999, 28, 964–974.]
Frailty: A term generally used for unobserved individual heterogeneity. Such variation is of major
concern in medical statistics particularly in the analysis of
survival times
where
hazard
functions
can be strongly influenced by selection effects operating in the population.
There are a number of possible sources of this heterogeneity, the most obvious of which
is that it reflects biological differences, so that, for example, some individuals are born
with a weaker heart, or a genetic disposition for cancer. A further possibility is that the
heterogeneity arises from the induced weaknesses that result from the stresses of life.
Failure to take account of this type of variation may often obscure comparisons between
172
groups, for example, by measures of
relative risk
. A simple model (frailty model) which
attempts to allow for the variation between individuals is
individual hazard function ¼ ZlðtÞ
where Z is a quantity specific to an individual, considered as a
random variable
over the
population of individuals, and λ(t ) is a basic rate. What is observed in a population for
which such a model holds is not the individual hazard rate but the net result for a number
of individuals with different values of Z.[Statistics in Medicine, 1988, 7, 819–42.]
Frailty model: See frailty.
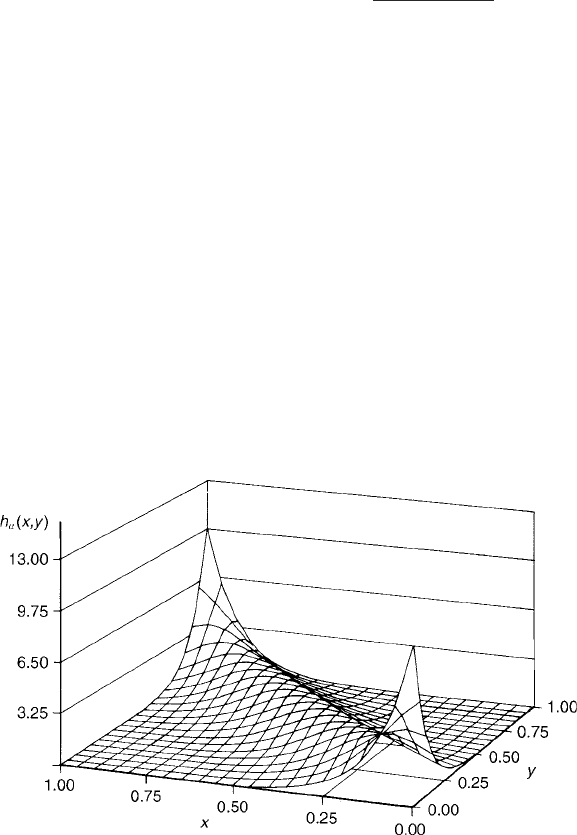
Frank’s fami ly of bivar iate distri butio ns: A class of
bivariate probability distributions
of
the form
PðX x; Y yÞ¼H
α
ðx; yÞ¼log
α
1 þ
ðα
x
1Þðα
y
1Þ
α 1
; α 6¼ 1
A perspective plot of such a distribution is shown in Fig. 64.
See also copulas.[Biometrika, 1987, 74, 549–55.]
F rechet bounds: Bounds for any
bivariate distribution
, H(x,y), and given by
max FðxÞþGðyÞ1; 0
fg
Hðx; yÞmin FðxÞ;GðyÞ
fg
where F(x) and G(y) are the
marginal distributions
. The bounds are important in the
development of
copulas
.[Scandinavian Actuarial Journal, 2000, 100,17–32.]
Freedman, David A. (1938^2008): Born in Montreal, Canada, Friedman received a first
degree from McGill University in 1958 and a Ph.D from Princeton University in
1960. In 1961 Freedman joined the statistics department at the University of
California, Berkeley where he remained for his entire career. Freedman made major
contributions to both theoretical statistics, for example, the
bootstrap
and martingale
inequalities and applied statistics, for example, the use of regression to analyse obser-
vational data. He also wrote about statistics for lawyers and judges. Freedman died in
Berkeley on the 17th October, 2008.
Fig. 64 An example of a bivariate distribution from Frank’s family.
173
Freeman^Tukeytest: A procedure for assessing the goodness-of-fit of some model for a set of data
involving counts. The test statistic is
T ¼
X
k
i¼1
ffiffiffiffi
O
p
i
þ
ffiffiffiffiffiffiffiffiffiffiffiffiffi
O
i
þ 1
p
ffiffiffiffiffiffiffiffiffiffiffiffiffiffiffi
4E
i
þ 1
p
2
where k is the number of categories, O
i
; i ¼ 1; 2; ...; k the observed counts and
E
i
; i ¼ 1; 2; ...; k, the expected frequencies under the assumed model. The statistic T has
asymptotically a
chi-squared distribution
with k − s − 1 degrees of freedom, where s is the
number of parameters in the model. See also chi-squared statistic, and likelihood ratio.
[Annals of Mathematical Statistics, 1950, 21, 607–11.]
F reeman ^Tukey tra nsfo rmati o n: A transformation of a random variable, X, having a
Poisson
distribution
, to the form
ffiffiffiffi
X
p
þ
ffiffiffiffiffiffiffiffiffiffiffiffi
X þ 1
p
in order to stabilize its variance. [Annals of
Mathematical Statistics, 1950, 21, 607–11.]
Frequency distribution: The division of a sample of observations into a number of classes,
together with the number of observations in each class. Acts as a useful summary of the
main features of the data such as location, shape and spread. Essentially the empirical
equivalent of the probability distribution. An example is as follows:
Hormone assay values(nmol/L)
Class limits Observed frequency
75–79 1
80–84 2
85–89 5
90–94 9
95–99 10
100–104 7
105–109 4
110–114 2
115 1
See also histogram. [SMR Chapter 2.]
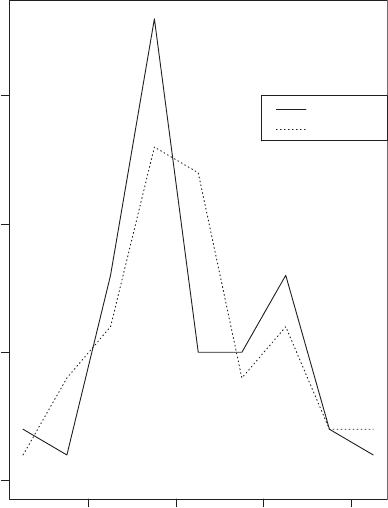
Frequency polygon: A diagram used to display graphically the values in a frequency distribution.
The frequencies are graphed as ordinate against the class mid-points as abscissae. The
points are then joined by a series of straight lines. Particularly useful in displaying a
number of frequency distributions on the same diagram. An example is given in Fig. 65.
[SMR Chapter 2.]
Frequentist inference: An approach to statistics based on a frequency view of probability in
which it is assumed that it is possible to consider an infinite sequence of independent
repetitions of the same statistical experiment. Significance tests, hypothesis tests and
like-
lihood
are the main tools associated with this form of inference. See also Bayesian
inference. [KA2 Chapter 31.]
Friedman’s two-way ana lysis of var iance: A
distribution free method
that is the analogue
of the
analysis of variance
for a design with two factors. Can be applied to data sets that
do not meet the assumptions of the parametric approach, namely normality and homogeneity
of variance. Uses only the ranks of the observations. [SMR Chapter 12.]
Friedman’surnmodel: A possible alternative to random allocation of patients to treatments in
a
clinical trial
with K treatments, that avoids the possible problem of imbalance when
174
the number of available subjects is small. The model considers an urn containing balls of K
different colours, and begins with w balls of colour k, k ¼ 1; ...; K. A draw consists of the
following operations
*
select a ball at random from the urn,
*
notice its colour k
0
and return the ball to the urn;
*
add to the urn α more balls of colour k
0
and β more balls of each other colour k where
k 6¼ k
0
.
Each time a subject is waiting to be assigned to a treatment, a ball is drawn at random
from the urn; if its colour is k
0
then treatment k
0
is assigned. The values of w, α and β
can be any reasonable nonnegative numbers. If β is large with respect to α then the
scheme forces the trial to be balanced. The value of w determines the first few stages of
the trial. If w is large, more randomness is introduced into the trial; otherwise more
balance is enforced. [Encyclopedia of Statistical Sciences, 2006, eds. S. Kotz, C. B. Read,
N. Balakrishnan and B. Vidakovic, Wiley, New York.]
Frindall, William Howard (1939^20 0 9): Born in Epsom, Surrey, United Kingdom, Frindall
attended Reigate Grammar School in Surrey and studied architecture at the Kingston
School of Art. After National Service in the Royal Air Force, Frindall became scorer and
statistician on the BBC radio program, Test Match Special in 1966 and continued in this
role until his death, watching all 246 test matches held in England from 1966 to 2008.
He introduced a scoring system for cricket matches, that was named after him and he
was meticulously accurate. Frindall wrote a large number of books on cricket statistics.
In 1998 Frindall was awarded the honorary degree of Doctor of Technology by
Staffordshire University for his contributions to statistics and in 2004 he was awarded
Haemo
g
lobin concentration
Frequency
14 15 16 17
0 5 10 15
Group 1
Group 2
Fig. 65 Frequency polygon
of haemoglobin concentration
for two groups of men.
175
an MBE for services to cricket and broadcasting. ‘Bill’ Frindall, cricket scorer, statistician
and broadcaster died in Swindon, UK on the 30th January, 2009.
Frisch, RagnarAnton Killi (1895^1973): Born in 1895 in Oslo, Norway as the only son of a
silversmith Frisch was expected to follow his father’s trade and took steps in that
direction including an apprenticeship. He studied economics at the University of Oslo
because it was “the shortest and easiest study” available at the university, but remained
involved in his father’s business. After a couple of years studying in Paris and England,
Frisch returned to lecture at Oslo in 1924 before leaving for the United States in 1930
visiting Yale and Minnesota. In 1931 Frisch became a full professor at the University of
Oslo and founded the Rockefeller-funded Institute of Economics in 1932. Ragnar Frisch
was a founding father of econometrics and editor of Econometrica for more than
20 years. He was awarded the first Nobel Memorial Prize in Economics in 1969 with
Jan Tinbergen. Ragnar Frisch died in Oslo in 1973.
Froot: An unattractive synonym for folded square root.
F-test: A test for the equality of the variances of two populations having normal distributions,
based on the ratio of the variances of a sample of observations taken from each. Most
often encountered in the
analysis of variance
, where testing whether particular variances
are the same also tests for the equality of a set of means. [SMR Chapter 9.]
F-to-enter: See selection methods in regression.
F-t o-remove: See selection methods in regression.
Ful l model: Synonym for saturated model.
Functional data analysis: The analysis of data that are functions observed continuously, for
example, functions of time. Essentially a collection of statistical techniques for answering
questions like ‘in what way do the curves in the sample differ?’, using information on the
curves such as slopes and curvature. [Applied Statistics, 1995, 44,12–30.]
Functional principal components analysis: A version of
principal components analysis
for
data that may be considered as curves rather than the vectors of classical
multivariate
analysis
. Denoting the observations X
1
ðtÞ; X
2
ðtÞ; ...; X
n
ðtÞ, where X
i
(t) is essentially a
time series
for individual i, the model assumed is that
X ðtÞ¼ð tÞþ
X
γ
U
ðt Þ
where the principal component scores, γ
are uncorrelated variables with mean zero, and
the principal component functions, U
(t) are scaled to satisfy
R
U
2
¼ 1; these functions
often have interesting physical meanings which aid in the interpretation of the data.
[Computational Statistics and Data Analysis, 1997, 24, 255–70.]
Functional relationship: The relationship between the ‘true’ values of variables, i.e. the values
assuming that the variables were measured without error. See also latent variables and
structural equation models.
Funnel plot: An informal method of assessing the effect of
publication bias
, usually in the context
of a
meta-analysis
. The effect measures from each reported study are plotted on the x-axis
against the corresponding sample sizes on the y-axis. Because of the nature of sampling
variability this plot should, in the absence of publication bias, have the shape of a pyramid
with a tapering ‘funnel-like’ peak. Publication bias will tend to skew the pyramid by
selectively excluding studies with small or no significant effects. Such studies
176
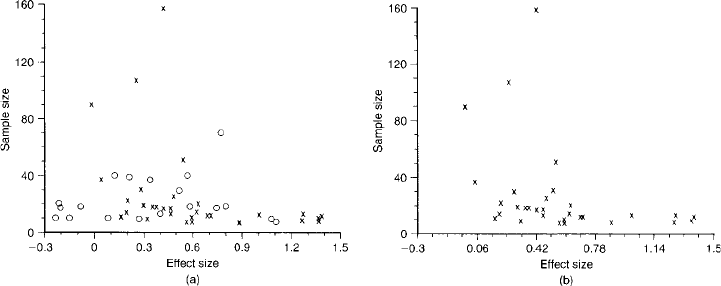
predominate when the sample sizes are small but are increasingly less common as the
sample sizes increase. Therefore their absence removes part of the lower left-hand corner
of the pyramid. This effect is illustrated in Fig. 66.[Reproductive Health, 2007, 4,
1742–1748.]
FU-plots: Abbreviation for follow-up plots.
Future years of life lost: An alternative way of presenting data on mortality in a population, by
using the difference between age at death and
life expectancy
.[An Introduction to
Epidemiology, 1983, M. A. Alderson, Macmillan, London.]
Fuzzy set theory: A radically different approach to dealing with uncertainty than the traditional
probabilistic and statistical methods. The essential feature of a fuzzy set is a membership
function that assigns a grade of membership between 0 and 1 to each member of the
set. Mathematically a membership function of a fuzzy set A is a mapping from a space χ to
the unit interval m
A
: !½0; 1. Because memberships take their values in the unit
interval, it is tempting to think of them as probabilities; however, memberships do not
follow the laws of probability and it is possible to allow an object to simultaneously hold
nonzero degrees of membership in sets traditionally considered mutually exclusive.
Methods derived from the theory have been proposed as alternatives to traditional
statistical methods in areas such as quality control, linear regression and forecasting,
although they have not met with universal acceptance and a number of statisticians
have commented that they have found no solution using such an approach that could
not have been achieved as least as effectively using probability and statistics. See also
grade of membership model.[Theory of Fuzzy Subsets, 1975, M. Kaufman, Academic
Press, New York.]
Fig. 66 Funnel plot of studies of psychoeducational progress for surgical patients: (a) all studies;
(b) published studies only.
177

G
G
2
: Symbol for the
goodness-of-fit test statistic
based on the
likelihood ratio
, often used when using
log-
linear models
. Specifically given by
G
2
¼ 2
X
O lnðO=EÞ
where O and E denote observed and expected frequencies. Also used more generally to
denote
deviance
.
Gabor regression: An approach to the modelling of time–frequency surfaces that consists of a
Bayesian regularization scheme in which
prior distributions
over the time–frequency coef-
ficients are constructed to favour both smoothness of the estimated function and sparseness
of the coefficient representation. [Journal of the Royal Statistical Society, Series B, 2004, 66,
575–89.]
Gai n: Synonym for power transfer function.
Galbraith plot: A graphical method for identifying
outliers
in a
meta-analysis
. The standardized
effect size is plotted against precision (the reciprocal of the standard error). If the studies are
homogeneous, they should be distributed within ±2 standard errors of the regression line
through the origin. [Research Methodology, 1999, edited by H. J. Ader and G. J.
Mellenbergh, Sage, London.]
Galton, Si r F rancis ( 1 822^1911): Born in Birmingham, Galton studied medicine at London
and Cambridge, but achieved no great distinction. Upon receiving his inheritance he
eventually abandoned his studies to travel in North and South Africa in the period
1850-1852 and was given the gold medal of the Royal Geographical Society in 1853 in
recognition of his achievements in exploring the then unknown area of Central South
West Africa and establishing the existence of anticyclones. In the early 1860s he turned
to meteorology where the first signs of his statistical interests and abilities emerged. His
later interests ranged over psychology, anthropology, sociology, education and finger-
prints but he remains best known for his studies of heredity and intelligence which
eventually led to the controversial field he referred to as eugenics, the evolutionary
doctrine that the condition of the human species could most effectively be improved
through a scientifically directed process of controlled breeding. His first major work was
Heriditary Genius published in 1869, in which he argued that mental characteristics are
inherited in the same way as physical characteristics. This line of thought lead, in 1876,
to the very first behavioural study of twins in an endeavour to distinguish between
genetic and environmental influences. Galton applied somewhat naive regression meth-
ods to the heights of brothers in his book Natural Inheritance and in 1888 proposed the
index of co-relation, later elaborated by his student
Karl Pearson
into the correlation
coefficient. Galton was a cousin of Charles Darwin and was knighted in 1909. He died
on 17 January 1911 in Surrey.
178