Damodaran A. Applied corporate finance
Подождите немного. Документ загружается.

3
3
!
Mean =
µ
X
= X
j
j=1
j= n
"
• The median, which is the mid-point of the series; half the data in the series is higher
than the median and half is lower
• The variance, which is a measure of the spread in the distribution around the mean,
and is calculated by first summing up the squared deviations from the mean, and then
dividing by either the number of observations (if the data represents the entire
population) or by this number, reduced by one (if the data represents a sample)
!
Variance =
"
X
2
= (X
j
#
µ
)
2
j=1
j= n
$
The standard deviation is the square root of the variance.
The mean and the standard deviation are the called the first two moments of any data
distribution. A normal distribution can be entirely described by just these two moments;
in other words, the mean and the standard deviation of a normal distribution suffice to
completely characterize it. If a distribution is not symmetric, it is considered to be skewed
and the skewness is the moment that describes both the direction and the magnitude of
the skewness.
Looking for Relationships in the Data
When there are two series of data, there are a number of statistical measures that
can be used to capture how the two series move together over time.
Correlations and Covariances
The two most widely used measures of how two variables move together (or do
not) are the correlation and the covariance. For two data series, X (X
1
, X
2
,.) and Y(Y,Y...
), the covariance provides a non-standardized measure of the degree to which they move
together, and is estimated by taking the product of the deviations from the mean for each
variable in each period.
!
Covariance =
"
XY
= (X
j
#
µ
X
) (Y
j
#
µ
Y
)
j=1
j= n
$
4
4
The sign on the covariance indicates the type of relationship that the two variables have.
A positive sign indicates that they move together and a negative that they move in
opposite directions. While the covariance increases with the strength of the relationship,
it is still relatively difficult to draw judgments on the strength of the relationship between
two variables by looking at the covariance, since it is not standardized.
The correlation is the standardized measure of the relationship between two
variables. It can be computed from the covariance –
!
Correlation =
"
XY
=
#
XY
/
#
X
#
Y
=
(X
j
$
µ
X
) (Y
j
$
µ
Y
)
j=1
j= n
%
(X
j
$
µ
X
)
2
j=1
j=n
%
j=1
j=n
%
(Y
j
$
µ
Y
)
2
The correlation can never be greater than 1 or less than minus 1. A correlation close to
zero indicates that the two variables are unrelated. A positive correlation indicates that
the two variables move together, and the relationship is stronger the closer the correlation
gets to one. A negative correlation indicates the two variables move in opposite
directions, and that relationship also gets stronger the closer the correlation gets to minus
1. Two variables that are perfectly positvely correlated (r=1) essentially move in perfect
proportion in the same direction, while two assets which are perfectly negatively
correlated move in perfect proportion in opposite directions.
Regressions
A simple regression is an extension of the correlation/covariance concept. It
attempts to explain one variable, which is called the dependent variable, using the other
variable, called the independent variable.
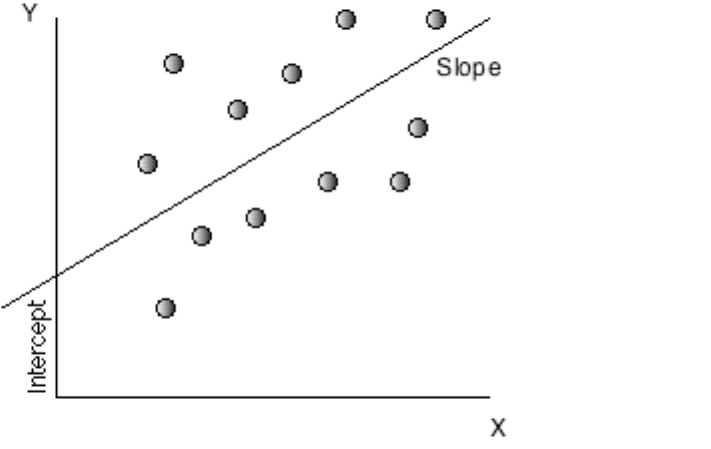
Scatter Plots and Regression Lines
Keeping with statistical tradition, let Y be the dependent variable and X be the
independent variable. If the two variables are plotted against each other, with each pair of
observations representing a point on the graph, you have a scatter plot, with Y on the
vertical axis and X on the horizontal axis.
5
5
In a regression, we attempt to fit a line through the points that best fits the . In its
simplest form, this is accomplished by finding a line that minimizes the sum of the
squared deviations of the points from the line. Consequently, it is called ordinary least
squares (OLS) regression. When such a line is fit, two parameters emerge – one is the
point at which the line cuts through the Y-axis, called the intercept of the regression, and
the other is the slope of the regression line.
Y = a + b X
The slope (b) of the regression measures both the direction and the magnitude of the
relationship between the dependent variable (Y) and the independent variable (X). When
the two variables are positively correlated, the slope will also be positive, whereas when
the two variables are negatively correlated, the slope will be negative. The magnitude of
the slope of the regression can be read as follows - for every unit increase in the
dependent variable (X), the independent variable will change by b (slope).
Estimating Regression Parameters
While there are statistical packages that allow us to input data and get the
regression parameters as output, it is worth looking at how they are estimated in the first
place. The slope of the regression line is a logical extension of the covariance concept
introduced in the last section. In fact, the close linkage between the slope of the
regression and the correlation/covariance should not be surprising since the slope is
estimated using the covariance –

6
6
!
Slope of the Regression = b =
Covariance
YX
Variance of X
=
"
YX
"
X
2
The intercept (a) of the regression can be read in a number of ways. One interpretation is
that it is the value that Y will have when X is zero. Another is more straightforward, and
is based upon how it is calculated. It is the difference between the average value of Y,
and the slope adjusted value of X.
!
Intercept of the Regression = a =
µ
Y
- b * (
µ
X
)
Regression parameters are always estimated with some error or statistical noise, partly
because the relationship between the variables is not perfect and partly because we
estimate them from samples of data. This noise is captured in a couple of statistics. One is
the R-squared of the regression, which measures the proportion of the variability in the
independent variable (Y) that is explained by the dependent variable (X). It is a direct
function of the correlation between the variables –
!
R - squared of the Regression = Correlation
YX
2
=
"
YX
2
=
b
2
#
X
2
#
Y
2
An R-squared value closer to one indicates a strong relationship between the two
variables, though the relationship may be either positive or negative. Another measure of
noise in a regression is the standard error, which measures the "spread' around each of the
two parameters estimated- the intercept and the slope. Each parameter has an associated
standard error, which is calculated from the data –
Standard Error of Intercept = SE
a
=
!
( X
j
2
) (Y
j
" bX
j
)
2
j=1
j= n
#
$
%
&
&
'
(
)
)
j=1
j=n
#
(n "1) (X
j
"
µ
X
)
2
j=1
j= n
#
!
Standard Error of Slope = SE
b
=
(Y
j
" bX
j
)
2
j=1
j= n
#
$
%
&
&
'
(
)
)
(n "1) (X
j
"
µ
X
)
2
j=1
j= n
#
If we make the additional assumption that the intercept and slope estimates are normally
distributed, the parameter estimate and the standard error can be combined to get a "t
statistic" that measures whether the relationship is statistically significant.

7
7
T statistic for intercept = a/SE
a
T statistic from slope = b/SE
b
For samples with more than 120 observations, a t statistic greater than 1.66 indicates that
the variable is significantly different from zero with 95% certainty, while a statistic
greater than 2.36 indicates the same with 99% certainty. For smaller samples, the t
statistic has to be larger to have statistical significance.
1
Using Regressions
While regressions mirror correlation coefficients and covariances in showing the
strength of the relationship between two variables, they also serve another useful purpose.
The regression equation described in the last section can be used to estimate predicted
values for the dependent variable, based upon assumed or actual values for the
independent variable. In other words, for any given Y, we can estimate what X should be:
X = a + B (Y)
How good are these predictions? That will depend entirely upon the strength of the
relationship measured in
From Simple to Multiple Regressions
The regression that measures the relationship between two variables becomes a
multiple regression when it is extended to include more than one independent variables
(X1,X2,X3,X4..) in trying to explain the dependent variable Y. While the graphical
presentation becomes more difficult, the multiple regression yields output that is an
extension of the simple regression.
Y = a + b X1 + c X2 + dX3 + eX4
The R-squared still measures the strength of the relationship, but an additional R-squared
statistic called the adjusted R squared is computed to counter the bias that will induce the
R-squared to keep increasing as more independent variables are added to the regression.
If there are k independent variables in the regression, the adjusted R squared is computed
as follows –
1
The actual values that t statistics need to take on can be found in a table for the t distribution, which is
reproduced at the end of this book as an appendix.

8
8
!
R squared =
(Y
j
" bX
j
)
2
j=1
j= n
#
$
%
&
&
'
(
)
)
n - 1
!
Adjusted R squared =
(Y
j
" bX
j
)
2
j=1
j= n
#
$
%
&
&
'
(
)
)
n - k
Multiple regressions are powerful weapons that allow us to examine the determinants of
any variable.
Regression Assumptions and Constraints
Both the simple and multiple regressions that we have described in this section
also assume linear relationships between the dependent and independent variables. If the
relationship is not linear, we have two choices. One is to transform the variables, by
taking the square, square root or natural log (for example) of the values and hope that the
relationship between the transformed variables is more linear. The other is run non-linear
regressions that attempt to fit a curve through the data.
There are implicit statistical assumptions behind every multiple regression that we
ignore at our own peril. For the coefficients on the individual independent variables to
make sense, the independent variable needs to be uncorrelated with each other, a
condition that is often very difficult to meet. When independent variables are correlated
with each other, the statistical hazard that is created is called multicollinearity. In its
presence, the coefficients on independent variables can take on unexpected signs
(positive instead of negative, for instance) and unpredictable values.
There are simple diagnostic statistics that allow us to measure how far the data
that we are using in a regression may be deviating from our ideal. If these statistics send
out warning signals, we ignore them at our own peril.
Conclusion
In the course of trying to make sense of large amounts of contradictory data, there
are useful statistical tools that we can draw on. While we have looked at the only most
basic ones in this chapter, there are far more sophisticated and powerful tools that we can
draw on.
9
9

1
1
APPENDIX 2
FINANCIAL STATEMENTS
Financial statements provide the fundamental information that we use to analyze
and answer valuation questions. It is important, therefore, that we understand the
principles governing these statements by looking at four questions:
• How valuable are the assets of a firm? The assets of a firm can come in several forms
– assets with long lives such as land and buildings, assets with shorter lives such
inventory, and intangible assets that still produce revenues for the firm such as patents
and trademarks.
• How did the firm raise the funds to finance these assets? In acquiring these assets,
firms can use the funds of the owners (equity) or borrowed money (debt), and the mix
is likely to change as the assets age.
• How profitable are these assets? A good investment, we argued, is one that makes a
return greater than the hurdle rate. To evaluate whether the investments that a firm
has already made are good investments, we need to estimate what returns we are
making on these investments.
We will look at the way accountants would answer these questions, and why the answers
might be different when doing valuation. Some of these differences can be traced to the
differences in objectives – accountants try to measure the current standing and immediate
past performance of a firm, whereas valuation is much more forward looking.
The Basic Accounting Statements
There are three basic accounting statements that summarize information about a
firm. The first is the balance sheet, shown in Figure 3.1, which summarizes the assets
owned by a firm, the value of these assets and the mix of financing, debt and equity, used
to finance these assets at a point in time.

2
2
Assets
Liabilities
Fixed Assets
Debt
Equity
Short-term liabilities of the firm
Intangible Assets
Long Lived Real Assets
Assets which are not physical,
like patents & trademarks
Current Assets
Financial Investments
Investments in securities &
assets of other firms
Short-lived Assets
Equity investment in firm
Debt obligations of firm
Current
Liabilties
Other
Liabilities
Other long-term obligations
Figure 1: The Balance Sheet
The next is the income statement, shown in Figure 3.2, which provides information on
the revenues and expenses of the firm, and the resulting income made by the firm, during
a period. The period can be a quarter (if it is a quarterly income statement) or a year (if it
is an annual report).
Figure 2: Income Statement
Revenues
Gross revenues from sale
of products or services
- Operating Expenses
Expenses associates with
generating revenues
= Operating Income
Operating income for the
period
- Financial Expenses
Expenses associated with
borrowing and other financing
- Taxes
Taxes due on taxable income
= Net Income before extraordinary items
Earnings to Common &
Preferred Equity for
Current Period
- (+) Extraordinary Losses (Profits)
Profits and Losses not
associated with operations
- Income Changes Associated with Accounting Changes
Profits or losses associated
with changes in accounting
rules
- Preferred Dividends
Dividends paid to preferred
stockholders
= Net Income to Common Stockholders

3
3
Finally, there is the statement of cash flows, shown in figure 3.3, which specifies the
sources and uses of cash of the firm from operating, investing and financing activities,
during a period.
Cash Flows From Operations
+ Cash Flows From Investing
+ Cash Flows from Financing
Net cash flow from operations,
after taxes and interest expenses
Includes divestiture and acquisition
of real assets (capital expenditures)
and disposal and purchase of
financial assets. Also include
acquisition of other firms.
Net cash flow from the issue and
repurchase of equity, from the
issue and repayment of debt and after
dividend payments
= Net Change in Cash Balance
Figure 3: Statement of Cash Flows
The statement of cash flows can be viewed as an attempt to explain how much the cash
flows during a period were, and why the cash balance changed during the period.
Asset Measurement and Valuation
When analyzing any firm, we would like to know the types of assets that it owns,
the values of these assets and the degree of uncertainty about these values. Accounting
statements do a reasonably good job of categorizing the assets owned by a firm, a partial
job of assessing the values of these assets and a poor job of reporting uncertainty about
asset values. In this section, we will begin by looking at the accounting principles
underlying asset categorization and measurement, and the limitations of financial
statements in providing relevant information about assets.
Accounting Principles Underlying Asset Measurement
An asset is any resource that has the potential to either generate future cash
inflows or reduce future cash outflows. While that is a general definition broad enough to
cover almost any kind of asset, accountants add a caveat that for a resource to be an asset.