Damodaran A. Applied corporate finance
Подождите немного. Документ загружается.


18
correlation across markets has resulted in a portion of country risk becoming non-
diversifiable or market risk..
There is a data set on the website that contains the updated ratings for countries
and the risk premiums associated with each.
3. Implied Equity Premiums
There is an alternative to estimating risk premiums that does not require historical
data or corrections for country risk, but does assume that the overall stock market is
correctly priced. Consider, for instance, a very simple valuation model for stocks.
Value =
!
Expected Dividends Next Period
(Required Return on Equity - Expected Growth Rate in Dividends)
This is essentially the present value of dividends growing at a constant rate. Three of the
four variables in this model can be obtained externally – the current level of the market
(i.e., value), the expected dividends next period and the expected growth rate in earnings
and dividends in the long term. The only “unknown” is then the required return on equity;
when we solve for it, we get an implied expected return on stocks. Subtracting out the
riskfree rate will yield an implied equity risk premium.
To illustrate, assume that the current level of the S&P 500 Index is 900, the
expected dividend yield on the index for the next period is 2% and the expected growth
rate in earnings and dividends in the long term is 7%. Solving for the required return on
equity yields the following:
( )
0.07-
02.0900
900
r
=
Solving for r,
02.007.0 =!r
%909.0 ==r
If the current riskfree rate is 6%, this will yield a premium of 3%.

19
This approach can be generalized to allow for high growth for a period and
extended to cover cash flow based, rather than dividend based, models. To illustrate this,
consider the S&P 500 Index on January 1, 2004. The index was at 1111.91 and the
dividend yield on the index in 2003 was roughly 2.81%.
17
In addition, the consensus
estimate
18
of growth in earnings for companies in the index was approximately 9.5% for
the next 5 years and the 10-year treasury bond rate on that day was 4.25%. Since a
growth rate of 9.5% cannot be sustained forever, we employ a two-stage valuation model,
where we allow dividends to grow at 9.5% for 5 years and then lower the growth rate to
the treasury bond rate of 4.25% after the 5 year period.
19
Table 4.3 summarizes the
expected cash flows for the next 5 years of high growth and the first year of stable growth
thereafter.
Table 4.3: Expected Cashflows on S&P 500
Year
Cash Flow on Index
1
34.26
2
37.52
3
41.08
4
44.98
5
49.26
6
51.35
a
Cash flow in the first year = 2.81% of 1111.91 (1.095)
If we assume that these are reasonable estimates of the cash flows and that the index is
correctly priced, then
Index level =
!
1111.91 =
34.26
(1+ r)
+
37.52
(1+ r)
2
+
41.08
(1+ r)
3
+
44.98
(1+ r)
4
+
49.26
(1+ r)
5
+
49.26(1.0425)
(r " .0425)(1+ r)
5
Note that the last term of the equation is the terminal value of the index, based upon the
stable growth rate of 4.25%, discounted back to the present. Solving for r in this equation
yields us the required return on equity of 7.94%. Subtracting out the treasury bond rate of
4.25% yields an implied equity premium of 3.69%.
The advantage of this approach is that it is market-driven and current and it does
not require any historical data. Thus, it can be used to estimate implied equity premiums
17
Stock buybacks during the year were added to the dividends to obtain a consolidated yield.
18
We used the average of the analyst estimates for individual firms (bottom-up). Alternatively, we could
have used the top-down estimate for the S&P 500 earnings.

20
in any market. It is, however, bounded by whether the model used for the valuation is the
right one and the availability and reliability of the inputs to that model. For instance, the
equity risk premium for the Brazilian market in January 2004 was estimated from the
following inputs. The index (Bovespa) was at 21050 and the current dividend yield on the
index was 4%. Earnings in companies in the index are expected to grow 14% (in US
dollar terms) over the next 5 years and 4.5% thereafter. These inputs yield a required
return on equity of 10.70%, which when compared to the treasury bond rate of 4% on that
day results in an implied equity premium of 6.70%. For simplicity, we have used nominal
dollar expected growth rates
20
and treasury bond rates, but this analysis could have been
done entirely in the local currency.
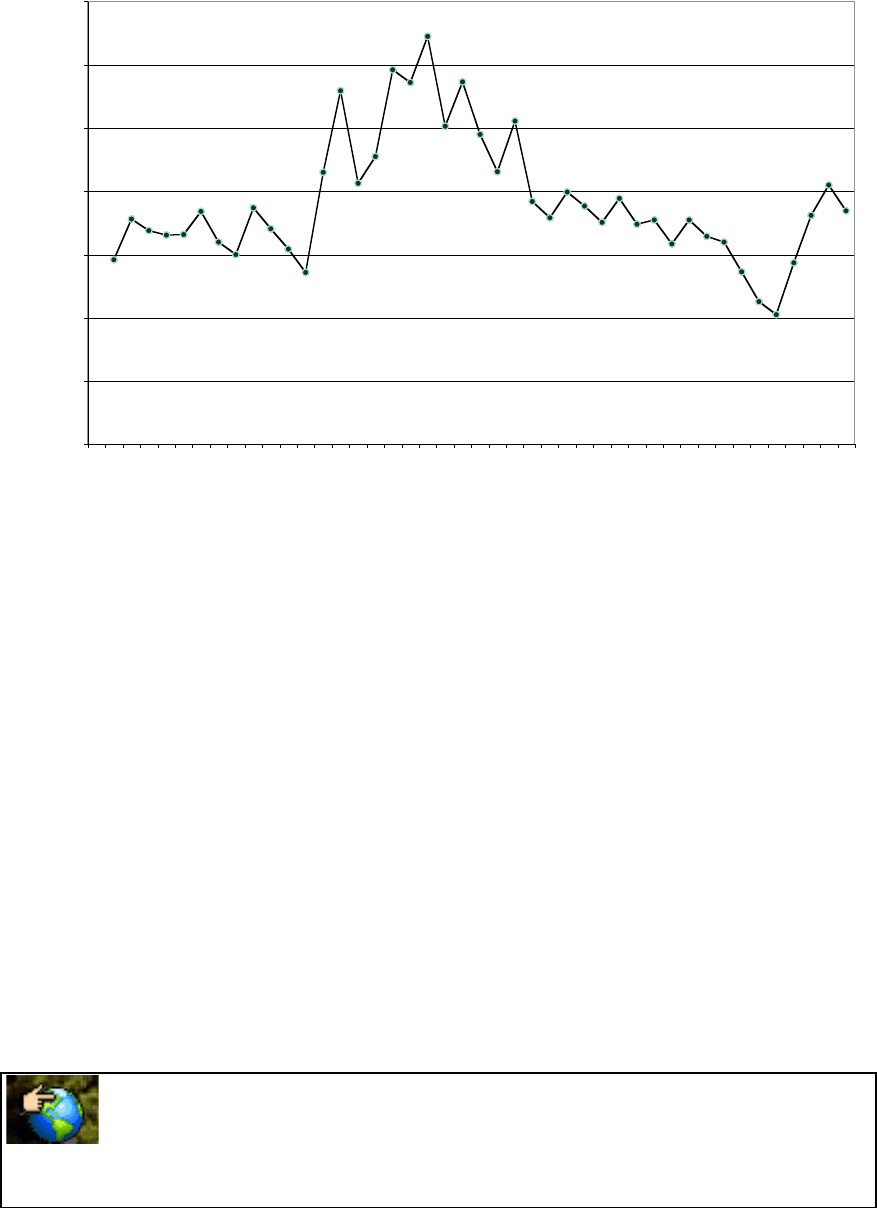
The implied equity premiums change over time much more than historical risk
premiums. In fact, the contrast between these premiums and the historical premiums is
best illustrated by graphing out the implied premiums in the S&P 500 going back to 1960
in Figure 4.2.
19
The treasury bond rate is the sum of expected inflation and the expected real rate. If we assume that real
growth is equal to the real rate, the long term stable growth rate should be equal to the treasury bond rate.
20
The input that is most difficult to estimate for emerging markets is a long term expected growth rate. For
Brazilian stocks, I used the average consensus estimate of growth in earnings for the largest Brazilian
companies which have listed ADRs . This estimate may be biased, as a consequence.
21
Figure 4.2: Implied Premium for US Equity Market
0.00%
1.00%
2.00%
3.00%
4.00%
5.00%
6.00%
7.00%
1960
1962
1964
1966
1968
1970
1972
1974
1976
1978
1980
1982
1984
1986
1988
1990
1992
1994
1996
1998
2000
2002
Year
Implied Premium
In terms of mechanics, we used smoothed historical growth rates in earnings and
dividends as our projected growth rates and a two-stage dividend discount model.
Looking at these numbers, we would draw the following conclusions.
• The implied equity premium has seldom been as high as the historical risk premium.
Even in 1978, when the implied equity premium peaked, the estimate of 6.50% is
well below what many practitioners use as the risk premium in their risk and return
models. In fact, the average implied equity risk premium has been between about 4%
over the last 40 years.
• The implied equity premium did increase during the seventies, as inflation increased.
This does have interesting implications for risk premium estimation. Instead of
assuming that the risk premium is a constant and unaffected by the level of inflation
and interest rates, which is what we do with historical risk premiums, it may be more
realistic to increase the risk premium as expected inflation and interest rates increase.
histimpl.xls: This data set on the web shows the inputs used to calculate the
premium in each year for the U.S. market.

22
implprem.xls: This spreadsheet allows you to estimate the implied equity premium
in a market.
☞ 4.4: Implied and Historical Premiums
Assume that the implied premium in the market is 3%, and that you are using a historical
premium of 7.5%. If you valued stocks using this historical premium, you are likely
a. to find more under valued stocks than over valued ones
b. to find more over valued stocks than under valued ones
c. to find about as many undervalued as overvalued stocks
III. Risk Parameters
The final set of inputs we need to put risk and return models into practice are the
risk parameters for individual assets and projects. In the CAPM, the beta of the asset has
to be estimated relative to the market portfolio. In the APM and Multi-factor model, the
betas of the asset relative to each factor have to be measured. There are three approaches
available for estimating these parameters; one is to use historical data on market prices
for individual assets; the second is to estimate the betas from fundamentals and the third
is to use accounting data. We will use all three approaches in this section.
A. Historical Market Betas
This is the conventional approach for estimating betas used by most services and
analysts. For firms that have been publicly traded for a length of time, it is relatively
straightforward to estimate returns that a investor would have made on the assets in
intervals (such as a week or a month) over that period. These returns can then be related
to a proxy for the market portfolio to get a beta in the capital asset pricing model, or to
multiple macro economic factors to get betas in the multi factor models, or put through a
factor analysis to yield betas for the arbitrage pricing model.

23
Standard Procedures for Estimating CAPM Parameters - Betas and Alphas
The standard procedure for estimating betas is to regress
21
stock returns (R
j
)
against market returns (R
m
) -
R
j
= a + b R
m
where
a = Intercept from the regression
b = Slope of the regression = Covariance (R
j
, R
m
) / σ
2
m
The slope of the regression corresponds to the
beta of the stock and measures the riskiness of
the stock.
The intercept of the regression provides
a simple measure of performance during the
period of the regression, relative to the capital asset pricing model.
R
j
= R
f
+ β (R
m
- R
f
)
= R
f
(1-β) + β R
m
........... Capital Asset Pricing Model
R
j
= a + b R
m
........... Regression Equation
Thus, a comparison of the intercept (a) to R
f
(1-β) should provide a measure of the
stock's performance, at least relative to the capital asset pricing model.
22
If a > R
f
(1-β) .... Stock did better than expected during regression period
a = R
f
(1-β) .... Stock did as well as expected during regression period
a < R
f
(1-β) .... Stock did worse than expected during regression period
The difference between a and R
f
(1-β) is called Jensen’s alpha, and provides a measure of
whether the asset in question under or out performed the market, after adjusting for risk,
during the period of the regression.
The third statistic that emerges from the
regression is the R squared (R
2
) of the regression.
21
The appendix to this chapter provides a brief overview of ordinary least squares regressions.
22
The regression can be run using returns in excess of the risk-free rate, for both the stock and the market.
In that case, the intercept of the regression should be zero if the actual returns equal the expected returns
from the CAPM, greater than zero if the stock does better than expected and less than zero if it does worse
than expected.
Jensen’s Alpha: This is the difference between
the actual returns on an asset and the return you
would have expected it to make during a past
period, given what the market did, and the
asset’s beta.
R Squared: The R squared measures the
proportion of the variability of a dependent
variable that is explained by an independent
variable or variables.

24
While the statistical explanation of the R squared is that it provides a measure of the
goodness of fit of the regression, the financial rationale for the R squared is that it
provides an estimate of the proportion of the risk (variance) of a firm that can be
attributed to market risk; the balance (1 - R
2
) can then be attributed to firm-specific risk.
The final statistic worth noting is the standard error of the beta estimate. The
slope of the regression, like any statistical estimate, is made with noise, and the standard
error reveals just how noisy the estimate is. The standard error can also be used to arrive
at confidence intervals for the “true” beta value from the slope estimate.
Estimation Issues
There are three decisions the analyst must make in setting up the regression
described above. The first concerns the length of the estimation period. The trade-off is
simple: A longer estimation period provides more data, but the firm itself might have
changed in its risk characteristics over the time period. Disney and Deutsche Bank have
changed substantially in terms of both business mix and financial leverage over the last
few years and any regression that we run using historical data will be affected by these
changes.
The second estimation issue relates to the return interval. Returns on stocks are
available on an annual, monthly, weekly, daily and even on an intra-day basis. Using
daily or intra-day returns will increase the number of observations in the regression, but it
exposes the estimation process to a significant bias in beta estimates related to non-
trading.
23
For instance, the betas estimated for small firms, which are more likely to
suffer from non-trading, are biased downwards when daily returns are used. Using
weekly or monthly returns can reduce the non-trading bias significantly.
24
The third estimation issue relates to the choice of a market index to be used in the
regression. The standard practice used by most beta estimation services is to estimate the
betas of a company relative to the index of the market in which its stock trades. Thus, the
betas of German stocks are estimated relative to the Frankfurt DAX, British stocks
23
The non-trading bias arises because the returns in non-trading periods is zero (even though the market
may have moved up or down significantly in those periods). Using these non-trading period returns in the
regression will reduce the correlation between stock returns and market returns and the beta of the stock.
24
The bias can also be reduced using statistical techniques suggested by Dimson and Scholes-Williams.

25
relative to the FTSE, Japanese stocks relative to the Nikkei, and U.S. stocks relative to
the S&P 500. While this practice may yield an estimate that is a reasonable measure of
risk for the parochial investor, it may not be the best approach for an international or
cross-border investor, who would be better served with a beta estimated relative to an
international index.
Illustration 4.1: Estimating CAPM risk parameters for Disney
In assessing risk parameters for Disney, the returns on the stock and the market
index are computed as follows –
(1) The returns to a stockholder in Dsiney are computed month by month from January
1999 to December 2003. These returns include both dividends and price appreciation and
are defined as follows –
Stock Return
intel, j
=( Price
Intel, j
- Price
Intel, j-1
+Dividends
j
) / Price
Intel,j-1
where Stock Return
Intel,j
= Returns to a stockholder in Disney in month j
Price
Intel, j
= Price of Disney stock at the end of month j
Dividends
j
= Dividends on Disney stock in month j
Dividends are added to the returns of the month in which the stock went ex-dividend.
25
If
there was a stock split
26
during the month, the returns have to take into account the split
factor, since stock prices will be affected.
27
(2) The returns on the S&P 500 market index are computed for each month of the period,
using the level of the index at the end of each month, and the monthly dividend yield on
stocks in the index. –
Market Return
intel, j
=( Index
j
- Index
j-1
+ Dividends
t
) / Index
j-1
25
The ex-dividend day is the day by which the stock has to be bought for an investor to be entitled to the
dividends on the stock.
26
A split changes the number of shares outstanding in a company without affecting any of its
fundamentals. Thus, in a three-for-two split, there will be 50% more shares outstanding after the split.
Since the overall value of equity has not changed, the stock price will drop by an equivalent amount (1 -
100/150 = 33.33%)
27
While there were no stock splits in the time period of the regression, Disney did have a 3 for 1 stock split
in July 1998. The stock price dropped significantly, and if not factored in will result in very negative
returns in that month. Splits can be accounted for as follows –
Return
intel, j
=( Factor
j
* Price
Intel, j
- Price
Intel, j-1
+ Factor * Dividends
j
) / Price
Intel,j-1
The factor would be set to 3 for July 1998 and the ending price would be multiplied by 3, as would the
dividends per share, if they were paid after the split.
26
where Index
j
is the level of the index at the end of month j and Dividend
j
is the dividends
paid on the index in month j. While the S&P 500 and the NYSE Composite are the most
widely used indices for U.S. stocks, they are, at best, imperfect proxies for the market
portfolio in the CAPM, which is supposed to include all assets.
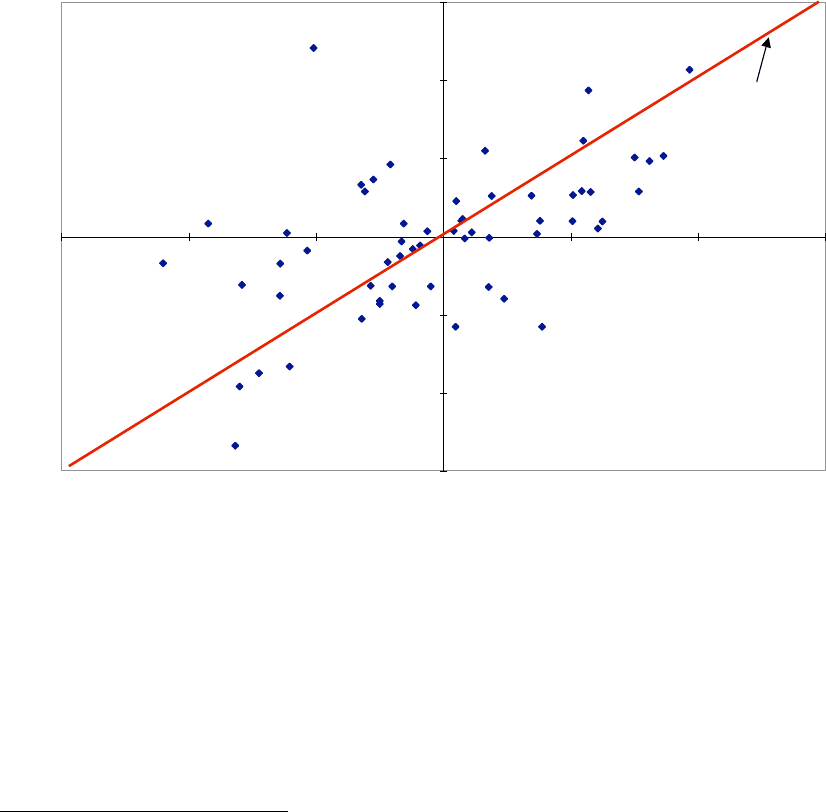
Figure 4.3 graphs monthly returns on Disney against returns on the S&P 500
index from January 1999 to December 2003.
Figure 4.3: Disney versus S&P 500: 1999 - 2003
-30.00%
-20.00%
-10.00%
0.00%
10.00%
20.00%
30.00%
-15.00% -10.00% -5.00% 0.00% 5.00% 10.00% 15.00%
S&P 500
Disney
Regression line
The regression statistics for Disney are as follows:
28
(a) Slope of the regression = 1.01. This is Disney's beta, based on returns from 1999 to
2003. Using a different time period for the regression or different return intervals (weekly
or daily) for the same period can result in a different beta.
(b) Intercept of the regression = 0.0467%. This is a measure of Disney's performance,
when it is compared with R
f
(1-β).
29
The monthly risk-free rate (since the returns used in
28
The regression statistics are computed in the conventional way. The appendix explains the process in
more detail.
29
In practice, the intercept of the regression is often called the alpha and compared to zero. Thus, a positive
intercept is viewed as a sign that the stock did better than expected and a negative intercept as a sign that
the stock did worse than expected. In truth, this can be done only if the regression is run in terms of excess
returns, i.e., returns over and above the riskfree rate in each month for both the stock and the market index.
27
the regression are monthly returns) between 1999 and 2003 averaged 0.313%, resulting in
the following estimate for the performance:
R
f
(1-β) = 0.313% (1-1.01) = -.0032%
Intercept - R
f
(1-β) = 0.0467% - (-0.0032%) = 0.05%
This analysis suggests that Disney’s stock performed 0.05% better than expected, when
expectations are based on the CAPM, on a monthly basis between January 1999 and
December 2003. This results in an annualized excess return of approximately 0.60%.
Annualized Excess Return = (1 + Monthly Excess Return)
12
- 1
= (1+0.0005)
12
-1 =.0060 or 0.60%
By this measure of performance, Disney did slightly better than expected during the
period of the regression, given its beta and the market’s performance over the period.
Note, however, that this does not imply that Disney would be a good investment looking
forward. It also does not provide a breakdown of how much of this excess return can be
attributed to ‘industry-wide’ effects, and how much is specific to the firm. To make that
breakdown, the excess returns would have to be computed over the same period for other
firms in the entertainment industry and compared with Disney’s excess return. The
difference would be then attributable to firm-specific actions. In this case, for instance,
the average annualized excess return on other entertainment firms between 1999 and
2003 was 1.33%. This would imply that Disney stock underperformed it’s peer group by
0.73% between 1999 and 2003, after adjusting for risk. (Firm-specific Jensen’s alpha =
0.60% - 1.33% = - 0.73%)
(c) R squared of the regression = 29%. This statistic suggests that 29% of the risk
(variance) in Disney comes from market sources (interest rate risk, inflation risk etc.),
and that the balance of 71% of the risk comes from firm-specific components. The latter
risk should be diversifiable, and therefore unrewarded. Disney’s R squared is slightly
higher than the median R squared of companies listed on the New York Stock Exchange,
which was approximately 21% in 2003.
(d) Standard Error of Beta Estimate = 0.20. This statistic implies that the true beta for
Disney could range from 0.81 to 1.21 (subtracting adding one standard error to beta
estimate of 1.01) with 67% confidence and from 0.61 to 1.41 (subtracting adding two
standard error to beta estimate of 1.01) with 95% confidence. While these ranges may