Chiodi M. An innovative 3D-CFD-Approach towards Virtual Development of Internal Combustion Engines
Подождите немного. Документ загружается.

206 11 A Way towards Virtual Engine Development
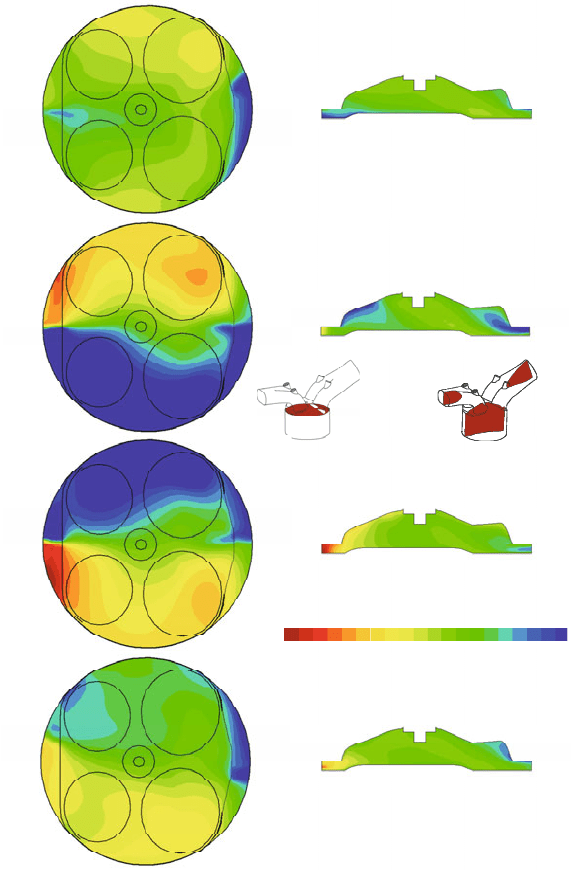
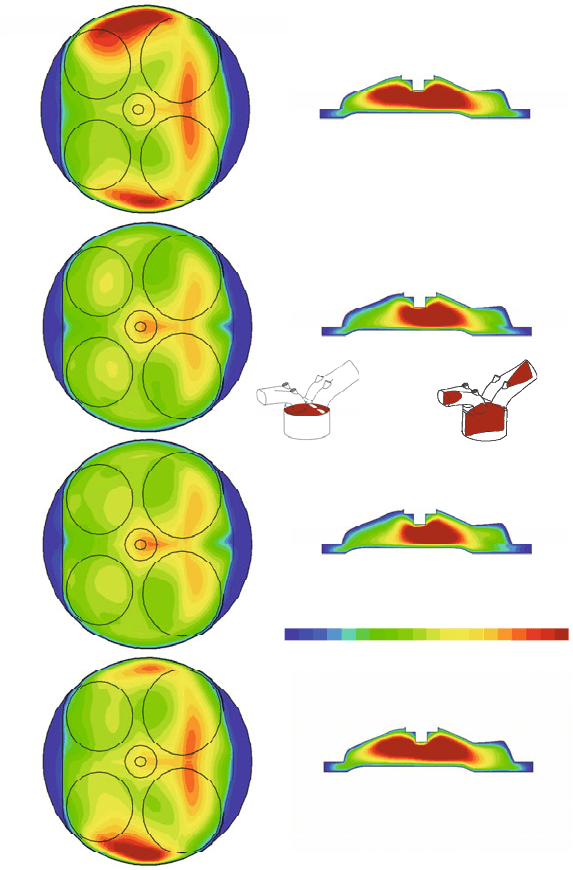
Figure 11.35: Lambda distribution at the ignition point of each cylinder
- IP=25 deg before FTDC (cylinder relative) - 5500 rpm - WOT (full engine mesh – 5
th
cycle).
EV1
EV2
Cylinder 1
EV
IV
Cylinder 3
Cylinder 2
Cylinder 4
IV1
IV2
Ignition Point: 25 deg b. FTDC
RPM 5500 - WOT
0.8
, -
1.2
1.0
11.7 3D-CFD-Simulation of the Full Engine 207
11.7.1.2 Residual Gas Distribution
Figures 11.36 and 11.37 show the profile of the residual gas mass fraction as averages
over the cylinder and locally at the spark plug. The amount of residual gas after
IVC is practically the same among the cylinders. As wished for race engines the
concentration of the residual gas at WOT is quite low (
#M
IPEGR
w
3%). This
value is in accordance to a turbo-charged race engine with a small valve “overlap”.
Obviously the valve overlap towards an additional reduction of the residual gas
concentration can be increased, but this is not a recommendable approach for CNG-
engines.
Also the more sensitive concentrations of residual gas at the spark plug show very small
differences among the cylinders and the final values at the ignition point are similar to the
cylinder-averaged value. The profile
SPEGR
w
,
is common in all engines. First a rapid
“scavenging” of the spark plug with the fresh charge mass-flow through the valves takes place
during the intake phase and then successively due to the tumble motion of the charge and the
related mixing processes the final value of concentration is reached.
Figure 11.36: Cylinder EGR mass fraction
EGR
w (kg/kg ) - 5500 rpm WOT –
Full engine - 5
th
cycle.
Figure 11.37: EGR mass fraction at the spark
plug
SPEGR
w
,
(kg/kg ) - 5500 rpm WOT –
Full engine - 5
th
cycle.
The homogenization degree of the residual gas among the cylinders is very high (see
Figure 11.38), that indicates a very effective scavenging process (this point is often critical in
race engines). In comparison to the simulations without airbox (see Chapter 11.5) the
concentration of residual gas is here lower (more accurate simulation of the intake phase – see
Chapter 11.9).
Cyl. 1
Cyl. 4
Cyl. 3
Cyl. 2
5500 rpm
R
es. mass
f
r
ac
t
i
on w
EGR
,
k
g
/
k
g
0
0.2
0.4
0.6
0.8
1.0
Crank an
g
le
M
, de
g
TDC
Cyl. 1
Cyl. 4
Cyl. 3
Cyl. 2
5500 rpm
Res. w
EGR
at the spark plug, kg/kg
0
0.02
0.04
0.06
0.08
0.10
Crank an
g
l
e
M
, de
g
TDC
208 11 A Way towards Virtual Engine Development
Figure 11.38: Residual gas mass fraction at the ignition point of each cylinder
- IP=25 deg before FTDC (cylinder relative) - 5500 rpm - WOT (full engine mesh – 5
th
cycle).
EV1
EV2
Cylinder 1
EV
IV
Cylinder 3
Cylinder 2
Cylinder 4
IV1
IV2
0.00
Residual gas mass fraction, kg/kg
0.05
0.025
Ignition Point: 25 deg b. FTDC
RPM 5500 - WOT
11.7 3D-CFD-Simulation of the Full Engine 209
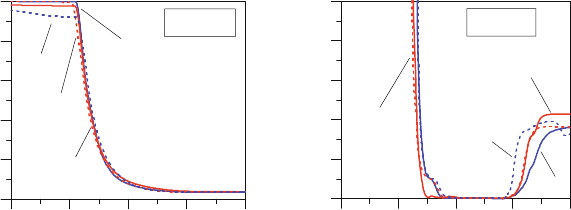
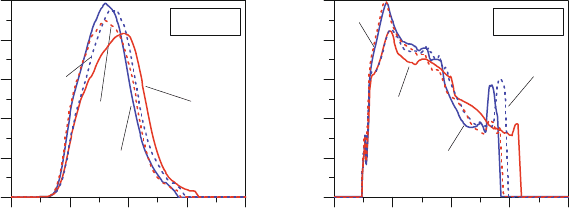
11.7.1.3 Turbulence
The profiles of the turbulence as averages in the cylinder and local at the spark plug (see Figure
11.39 and 11.40) follow the trends shown by both the intake mass flow and the tumble ratio (see
Chapter 11.7.1.1). Here the focus is mainly on the turbulence profile during the combustion.
Figure 11.39: (TKE) – Cylinder turbulence -
5500 rpm WOT – Full engine - 5
th
cycle.
Figure 11.40: Turbulence at the spark plug -
5500 rpm WOT – Full engine - 5
th
cycle.
The external cylinders (blue lines), as expected, have a remarkably higher turbulence level
during the intake stroke generated directly by the velocity gradients of the intake mass flow as
soon as it has reached the combustion chamber (deceleration of the charge). Depending on the
shape of the combustion chamber, due to the momentum conservation law, the charge starts
rotating on the tumble axis up to its break down at the end of the compression stroke. This effect
that generates a considerable dissipation of kinetic energy into turbulence can be seen in
particular for the external cylinders in Figure 11.39 (
#M
700 deg – i.e. approximately at the
ignition point). The internal cylinders show a “smoother” and earlier tumble break down during
the compression stroke with very moderate turbulence increasing near FTDC. During the
combustion, in contrast to the turbulence during the intake stroke, the differences among the
cylinders and also locally at the spark plugs are smaller (see Figure 11.41). As visible in the
pictures of the turbulence distribution within the combustion chamber, the external cylinders still
have a moderate higher turbulence level (highly symmetric result between external cylinders).
In comparison to the simulations without airbox, that are drastically influenced by the location of
the intake boundary condition (see Chapter 11.5), it is here evident how the presence of the
airbox in the 3D-CFD-domain reduces the level of turbulence to more reliable results in both
simulations: one cylinder with airbox (see Figure 11.23) or full engine (see Figure 11.41).
5500 rpm
Cyl. 1
Cyl. 3
Cyl. 4
Cyl. 2
Turbulent kinetik energy, m
2
/s
2
0
200
400
600
800
Crank an
g
le M, de
g
TDC 450 BDC 630 FTDC 810
5500 rpm
Cyl. 1
Cyl. 4
Cyl. 4
Cyl. 2
TKE at the spark plug, m
2
/s
2
0
200
400
600
800
Crank an
g
le M, de
g
TDC 450 BDC 630 FTDC 810
210 11 A Way towards Virtual Engine Development
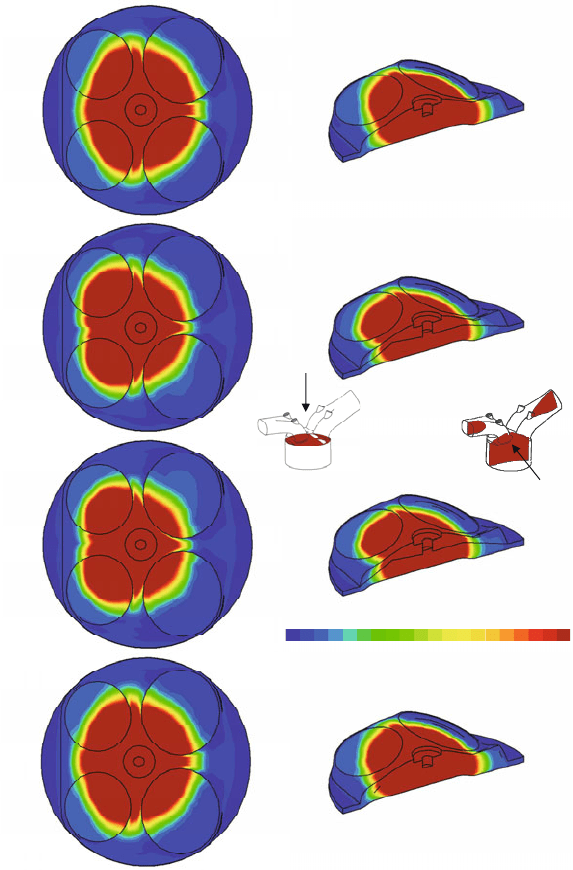
Figure 11.41: (TKE) Turbulent kinetic energy distribution at the ignition point of each cylinder
- IP=25 deg before FTDC (cylinder relative) - 5500 rpm - WOT (full engine mesh – 5
th
cycle).
Cylinder 1
Cylinder 3
Cylinder 2
0
Turbulent kinetic energy, m
2
/s
2
260
130
EV1
EV2
EV
IV
Cylinder 4
IV1
IV2
Ignition Point: 25 deg b. FTDC
RPM 5500 - WOT
11.7 3D-CFD-Simulation of the Full Engine 211
11.7.1.4 Combustion
As an outlook for combustion investigations, the analysis of the results reported in the previous
paragraphs shows that the external cylinders have a better mixture homogenization and a higher
turbulence level at the ignition point. In contrast the internal cylinders have a higher volumetric
efficiency. Since experimental measurements have detected a quite “irregular” operation of
cylinder 3 characterized by much higher cycle-to-cycle variations in comparison to the other
cylinders, here a short analysis of the combustion process aims to conclusively find an
explanation for this behavior.
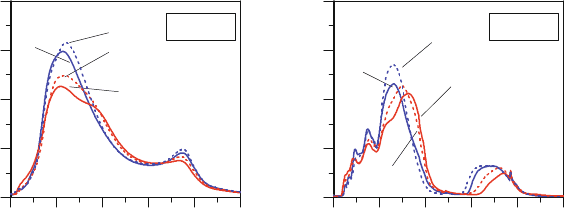
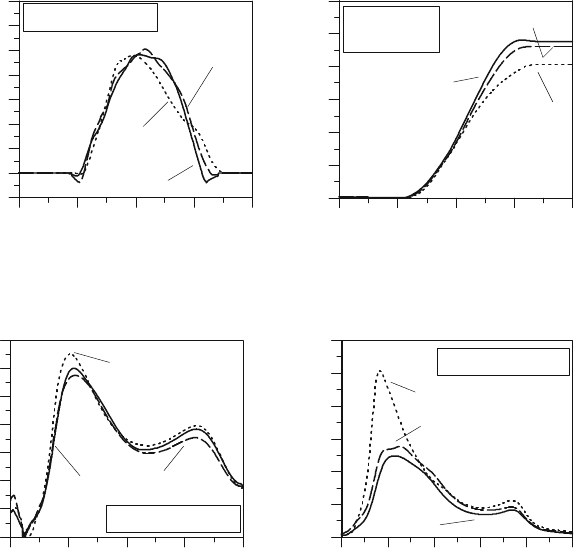
Figure 11.42: Cylinder burn rate (%/deg) -
5500 rpm WOT – Full engine - 5
th
cycle.
Figure 11.43: Abs. flame speed (m/s) -
5500 rpm WOT – Full engine - 5
th
cycle.
Figures 11.42 and 11.43 show the burn rate profile and for a deeper insight also the
absolute flame propagation
f
u
(both normalized) during the whole combustion
process. Cylinder 3 is surprisingly characterized by a very high flame speed up to its
peak of burn rate. But despite the initial high flame speed the peak of burn rate is, as
expected due to a worse homogeneous mixture (like in cylinder 2), lower than in the external
cylinders. Here an answer can be found in the analysis of the turbulence profile of cylinder 3,
that shows, in comparison to cylinder 2, higher gradients during the combustion period (see
Figures 11.39 and 11.40).
From my experience in 3D-CFD-simulations the combination of a modest homogenization and
high turbulence gradients are principally responsible for a very sensitive combustion process that
amplifies (in terms of imep) the already present and remarkable cycle-to cycle amplitude
variations concerning the charge (see Chapter 11.8). These effects are particularly intense in
cylinder 3 followed by cylinder 2 and much more moderate in the external cylinders.
5500 rpm
Cyl. 1
Cyl. 3
Cyl. 4
Cyl. 2
Burn ra
t
e dw
B
/d
M
, Norma
l
i
zed
0.0
0.2
0.4
0.6
0.8
1.0
C
r
ank an
g
l
e M, de
g
FTDC
5500 rpm
Cyl. 1
Cyl. 3
Cyl. 4
Cyl. 2
F
l
ame spee
d
,
N
orma
l
i
ze
d
0.0
0.2
0.4
0.6
0.8
1.0
C
r
ank an
g
le M, de
g
FTDC
212 11 A Way towards Virtual Engine Development
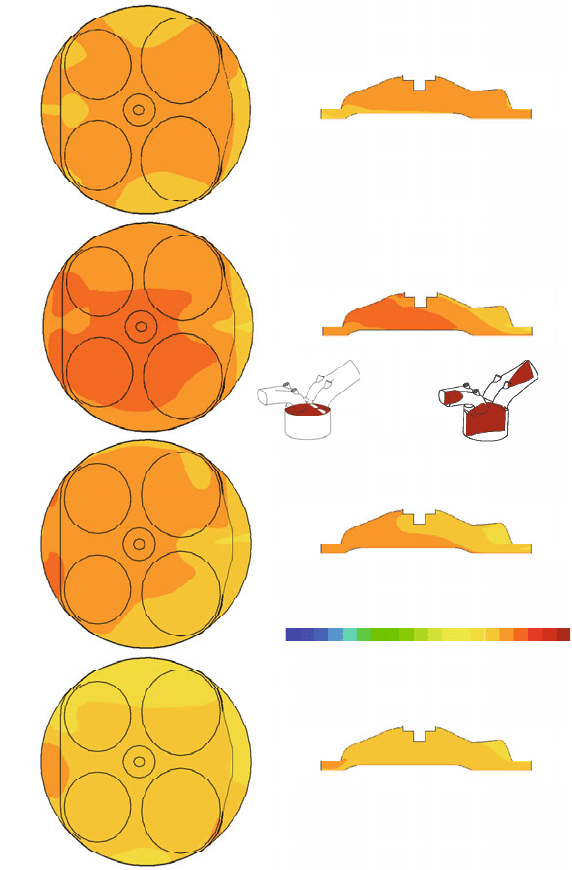
Figure 11.44: Temperature distribution during combustion of each cylinder
- 10 deg after FTDC (cylinder relative) - 5500 rpm - WOT (full engine mesh – 5
th
cycle).
Cylinder 1
Cylinder 3
Cylinder 2
EV1
EV2
EV
IV
Cylinder 4
IV1
IV2
10 deg after FTDC
RPM 5500 - WOT
800
Temperature, K
2000
1400
11.7 3D-CFD-Simulation of the Full Engine 213
The temperature distributions in Figure 11.44 show the flame positions at CA=10 deg after
FTDC (burned mass fraction ca. 35%). The flames in the external cylinders remain in the central
position of the combustion chamber and still have a circular shape. In contrast the centers of the
burned zones in the internal cylinders have moved near the exhaust valves and have a less
circular shape (indication of a more sensitive combustion). In comparison the temperature
distribution in Figure 11.17 (simulation of the cylinder alone with injectors) is not able to
recognize this trend.
11.7.1.5 Convergence of the Results
The required CPU-time for the simulation of an operating condition (see Table 11.2) is only 30%
longer than in case of the simulation of one cylinder with airbox (ca. 24 hours/cycle).
Considering the dimension of the 3D-CFD-domain (450,000 vs. 190,000 cells) this is a very
moderate CPU-time increasing. The reason of this result has to be found in a much more stable
calculation (principally due to 1D-CFD-boundary conditions located in less sensitive regions,
where velocity gradients are much lower) that permits to run the simulation with less iterations
(time step
deg5.0#'t ) and less convergence corrector-steps within each time step. Depending
on the setting of the initial conditions (in particular the initial pressure and temperature of the
airbox) the number of cycles required for reaching the convergence can vary remarkably.
Usually at WOT and in case of a small airbox (like in this engine configuration), five cycles are
sufficient for a good convergence of the results. That means a full-engine simulation requires
less simulation cycles to converge then the case with one cylinder with airbox (here a few cycles
required for the convergence of the integrated 0D- and 1D-model for the simulation of the
missing cylinder are skipped – see Chapter 11.6.1.1), so that at the end the total CPU-time is not
longer then in the previous case.
11.7.2 Result Comparison among different Operating Conditions
On the next pages some results of the full-engine simulations at three different engine speeds
(5500, 6000 and 6500 rpm WOT) are shown. The results refer to cylinder 3 and due to secrecy
often the variables are normalized to the maximum value of the case at 5500 rpm.
The maximal intake mass flow of the engine is limited by both an air-restrictor and a pressure
regulation in the airbox (see Chapter 11.2), i.e. as shown in Figure 11.46 the maximal amount of
trapped air in the cylinder is reached between 5500 and 6000 rpm. At 6500 rpm, due to these
limitations, the volumetric efficiency remarkably decreases. The profiles of the intake mass flow
through the valves (see Figure 11.45) show moderate oscillations in all the investigated cases,
214 11 A Way towards Virtual Engine Development
which, as expected, slightly rise with increasing the engine speed. The mass flow peak is
approximately the same and a small backflow at IVC is present only at 5500 rpm. From the mass
flow diagram it can be seen that the intake valve timing has been optimized for a target engine
speed at about 6000 rpm. The tumble ratio does not change remarkably, i.e. the rotation speed of
the charge varies quite linearly with the engine speed (see Figure 11.47). At 6500 rpm the tumble
ratio takes principally profit from an earlier cylinder filling (the mass flow profile is oriented
towards the valve opening phase) that lets rise its value during the whole compression stroke.
The turbulence in the cylinder, as usual, rises with increasing the engine speed (see Figure
11.48).
Figure 11.45: Mass flow through IVs (mg/s)
- Full engine (3. Cyl.) – 5
th
cycle –
5500/6000/6500 rpm WOT.
Figure 11.46: Trapped air in cylinder (mg)
- Full engine (3. Cyl.) – 5
th
cycle –
5500/6000/6500 rpm WOT.
Figure 11.47: Tumble ratio (-)
- Full engine (3. Cyl.) – 5
th
cycle –
5500/6000/6500 rpm WOT.
Figure 11.48: (TKE) turbulence in cyl. (m
2
/s
2
)
- Full engine (3. Cyl.) – 5
th
cycle –
5500/6000/6500 rpm WOT.
Full Engine - 3.Cyl.
6,500 rpm
5,500 rpm
6,000 rpm
Mass f
l
ow at IVs, Norma
l
i
zed
-0.2
0.0
0.2
0.4
0.6
0.8
1.0
1.2
1.4
C
r
ank an
g
le M, de
g
TDC
Full Engine -
3.Cyl.
6,500 rpm
5,500 rpm
6,000 rpm
T
r
apped a
i
r
i
n cy
l
., No
r
ma
l
i
zed
0.0
0.2
0.4
0.6
0.8
1.0
1.2
Crank an
g
l
e
M
, de
g
TDC
Full Engine - 3.Cyl.
6,500 rpm
6,000 rpm
5,500 rpm
Tumb
l
e No., Norma
l
i
zed
-0.2
0.0
0.2
0.4
0.6
0.8
1.0
1.2
C
r
ank an
g
le M, de
g
TDC 450 BDC 630 FTDC
Full Engine - 3.Cyl.
6,500 rpm
5,500 rpm
6,000 rpm
Turbu
l
en
t
k
i
ne
t
i
k energy, m
2
/s
2
0
200
400
600
800
1000
1200
Crank an
g
le M, de
g
TDC 450 BDC 630 FTDC 810
11.8 The Simulation of successive Operating Cycles 215
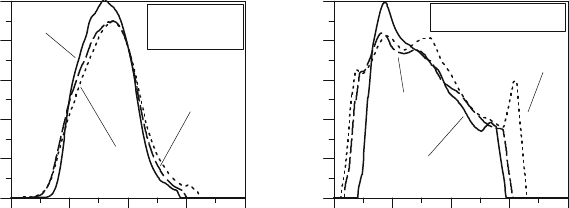
Figure 11.49: Burn rate (%/deg)
- Full engine (3. Cyl.) – 5
th
cycle –
5500/6000/6500 rpm WOT.
Figure 11.50: Abs. flame speed (m/s)
- Full engine (3. Cyl.) – 5
th
cycle –
5500/6000/6500 rpm WOT.
The burn rate has a “steeply” profile at 5500 rpm and becomes smoother with increasing the
engine speed (see Figure 11.49). Up to FTDC the flame speed is higher at 5500 rpm while in the
second part of the combustion it is higher at 6500 rpm (see Figure 11.50). At the end, as usual,
the combustion duration (expressed in degrees) rises with increasing the engine speed.
11.8 The Simulation of successive Operating Cycles
The results of a 3D-CFD-simulation can only be reliable if the flow motion within the 3D-CFD-
domain reproduces the results within a certain convergence criteria over many simulated cycles.
As introduced in Chapter 7.2.1, the simulation of only one cycle is not representative for the
engine operation. Considering different extensions of the 3D-CFD-domain (see Chapters 11.5-
11.7) and taking the tumble ratio (normalized) as a reference variable for these investigations, it
can be seen that in no case the results of the first cycle have reached an acceptable convergence
level (see Figures 11.51-11.54). All the simulations have been started using the same initial
conditions and it was not possible to identify a clear trend for predicting the variations between
the results of the first cycle and the successive one. Here, e.g. the simulation with the smallest
extension of the domain (cylinder alone without injectors) shows a bigger difference from cycle
1 to cycle 2 then the simulation with the most extended domain (full-engine). The simulations
without airbox reach the convergence at the third cycle while the simulation of the full engine
has to run up to approximately the fifth cycle.
Full Engine -
3.Cyl.
6,500 rpm
5,500 rpm
6,000 rpm
Burn ra
t
e dw
B
/d
M
, Norma
l
i
zed
0.0
0.2
0.4
0.6
0.8
1.0
C
r
ank an
g
le M, de
g
FTDC
5,500 rpm
6,500 rpm
Full Engine - 3.Cyl.
6,000 rpm
F
l
ame spee
d
,
N
orma
l
i
ze
d
0.0
0.2
0.4
0.6
0.8
1.0
C
r
ank an
g
le M, de
g
FTDC