Chiodi M. An innovative 3D-CFD-Approach towards Virtual Development of Internal Combustion Engines
Подождите немного. Документ загружается.

156 10 3D-CFD-Modeling of the Wall Heat-Transfer
In order to ensure the same “thermodynamic conditions” during the comparison (see Figure
10.5), the necessary average values of the variables in the real working-process analysis have
been automatically provided by the evaluation tool implemented in
QuickSim (see Chapter 7.4).
In this work, the heat-transfer models chosen in the real working-process analysis are:
x
Bargende’s correlation during the compression and expansion stroke (working cycle).
x
Hohenberg’s correlation during the intake and exhaust stroke (gas exchange period).
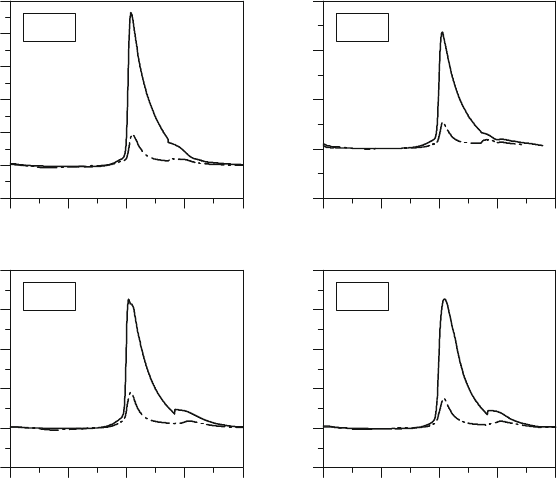
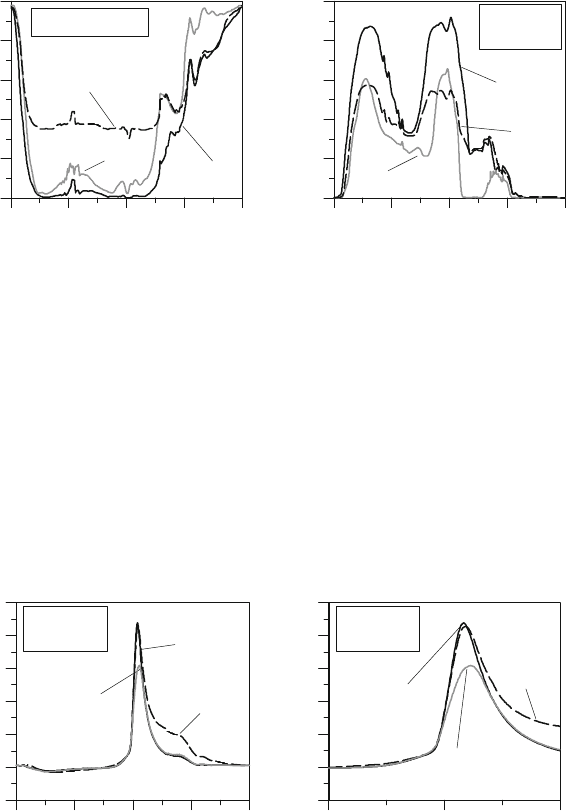
Figure 10.6: Comparison between the 3D-CFD-heat-transfer (WF: wall-function model) and
the real working-process analysis (WP) under the same “thermodynamic conditions”.
Here a representative selection of numerous comparisons is reported. In cases 1 und 2 (see Table
10.1) two operating conditions of an old mass production engine are reported. Case 3 and 4 refer
to test engines with very simple combustion chamber geometries, so that it is possible to
implement a 3D-CFD-mesh with a high structure quality (low warpage angle, optimal internal
Case 1
WP
WF
Hea
t
t
r
ans
f
e
r
r
a
t
e
d
Q
W
/
d
M, J
/
d
eg
-1.0
0.0
1.0
2.0
3.0
4.0
5.0
Crank an
g
le
M
, de
g
TDC BDC FTDC BDC TDC
Case 2
WP
WF
Hea
t
t
r
ans
f
e
r
r
a
t
e
d
Q
W
/
d
M, J
/
d
eg
-1.0
0.0
1.0
2.0
3.0
Crank an
g
le
M
, de
g
TDC BDC FTDC BDC TDC
WP
WF
Case 3
Hea
t
t
r
ans
f
e
r
r
a
t
e
d
Q
W
/
d
M, J
/
d
eg
-1.0
0.0
1.0
2.0
3.0
4.0
Crank an
g
le
M
, de
g
TDC BDC FTDC BDC TDC
Hea
t
t
r
ans
f
e
r
r
a
t
e
d
Q
W
/
d
M, J
/
d
eg
-1.0
0.0
1.0
2.0
3.0
4.0
Crank an
g
le
M
, de
g
TDC BDC FTDC BDC TDC
Case 4
WP
WF

10.2 State-of the-Art of Engine Heat-Transfer Calculation in the 3D-CFD-Simualtion 157
face angle, optimal aspect ratio and a better fulfilling of the
y
-condition [56]) at any piston
position.
Table 10.1: Comparison: 3D-CFD wall heat-transfer calculation
with wall function models (WF) vs. real working-process analysis (WP).
Specifications: Case 1 Case 2 Case 3 Case 4
Engine MB M102-E23 MB M102-E23 Test-Engine Test-Engine
No. of valves/cyl.- 2 2 2 4
Cyl. displacement, cm
3
575 575 480 480
Combustion chamber
shape
Bowl +
squish area
Bowl +
squish area
Pent-roof Flat
rpm,- 3,000 1,500 4,000 3,000
Load, - WOT Low WOT WOT
imep, bar 10.8 3.4 10.5 9.5
3D-CFD-Mesh,
Cells
N
15,000 15,000 45,000 50,000
Cell type, - Hexahedral Hexahedral Hexahedral Hexahedral
Simulated fuel, - C
8
H
18
C
8
H
18
C
3
H
8
C
8
H
18
WF WP WF WP WF WP WF WP
Heat release
B
Q
, J/cycle
1684 1727 621 619 1455 1455 1324 1311
Heat transfer
W
Q
,
J/cycle
62.3 352.4 61.5 202.4 77.1 286.6 66.2 308.1
Ratio
BW
QQ , %
3.7 20.4 9.9 32.7 5.3 19.7 5.0 23.5
The four cases show that the heat-transfer prediction using the wall function is in any case not
plausible. Due to the high mesh-structure quality, even in cases 3 and 4 no remarkable
improvements have been achieved. These results confirm the analyses of other authors [11]. The
158 10 3D-CFD-Modeling of the Wall Heat-Transfer
reason of this inaccuracy, as explained at the beginning of this chapter, lays in an inadequate
physical formulation and numerical implementation. In particular the turbulence in the near-wall
region cannot be predicted correctly. Since the turbulence variables are the most predominant
inputs in the heat-transfer formulation based on the wall function, it becomes evident that even
an improved formulation will not be able to achieve a general validation until its inputs are
reliable.
10.2.4.1 Sensitivity Analysis of the 3D-CFD-Heat-Transfer calculated with a
Wall-Function Model
A sensitivity analysis of the 3D-CFD-heat-transfer calculation with a traditional wall-function
model (WF) using as test object a HYDRA-research-engine from Ricardo with four different
mesh structures or refinement degrees has been performed (see Figure 10.7).
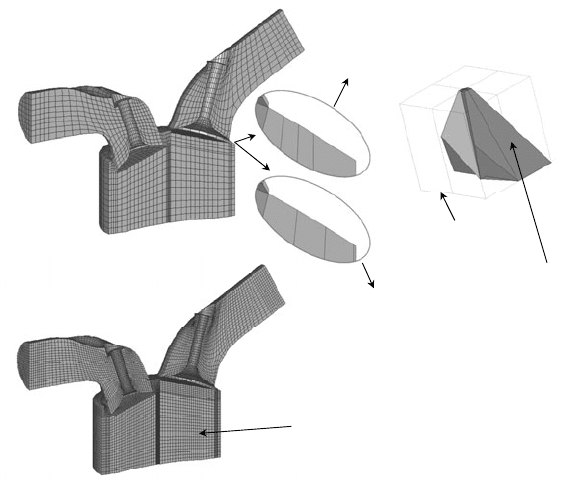
Figure 10.7: Sensitivity analysis with four different mesh structures or refinement degrees
(HYDRA research-engine – 2 valves).
Standard mesh (coarse)
Fine mesh (Sim. 4)
Standard
spark plug
Deformed
spark plug
(Sim. 3)
Thin cell
layer (0.1 mm)
(Sim. 2)
Normal cell layer
(Sim. 1)
Half discretization length
than coarse mesh
10.2 State-of the-Art of Engine Heat-Transfer Calculation in the 3D-CFD-Simualtion 159
The simulated engine has a simple combustion chamber shape with a very high mesh quality so
that a modification of the mesh can be well targeted and accurate investigations of their effects
on the simulation results can be performed. The four meshes of the two-valve research engine
differ as follows:
x
(Sim. 1 – “Standard”) – Standard coarse mesh with ca. 15,000 cells in the combustion
chamber.
x
(Sim. 2 – “Thin Layer”) – Standard coarse mesh with a thin cell layer of 0.1 mm at the
cylinder liner.
x
(Sim. 3 – “Bad SP”) – Standard coarse mesh with a deformed spark plug (“bad” spark
plug with locally high aspect ratios and warpage-angles of the cells).
x
(Sim. 4 – “Fine”) – Fine mesh with half discretization length compared to the standard
coarse one (
~120,000 cells in the combustion chamber).
The simulated operating condition reported here is 2,000 rpm at WOT with the same boundary
conditions. The turbulence is modeled by a
H
~
~
k
standard model.
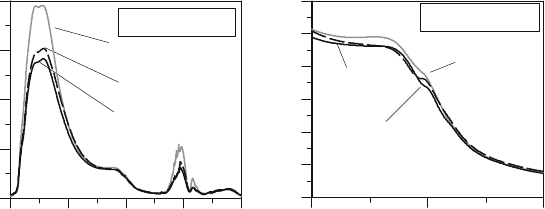
As expected, during the exchange period the average cylinder turbulence TKE
Mk
, due to high
local velocity gradients, shows remarkable differences only with the simulation of the fine mesh
(see Figure 10.8). In contrast the profile of
Mk
during the working period, in all cases, shows
much smaller discrepancies. Since the influence of the turbulence on the heat-transfer and
consequently on the engine energy-balance is moderate during the exchange period, the overall
variable
Mk
can be assumed as a reliable input for heat-transfer modeling.
Figure 10.8: Turbulence TKE in the cylinder during the whole cycle
and the working period.
2000 rpm - WOT
Thin layer
Fine
Standard &
Bad SP
Cyl. turb. kinetik energy, m
2
/s
2
0
40
80
120
160
Crank an
g
l
e
M
, de
g
TDC BDC FTDC BDC TDC
2000 rpm - WOT
Thin
layer
Fine
Standard &
Bad SP
Cy
l
.
t
urb. k
i
ne
t
i
k energy, m
2
/s
2
0
5
10
15
20
25
30
Crank an
g
le M, de
g
630 FTDC 810
160 10 3D-CFD-Modeling of the Wall Heat-Transfer
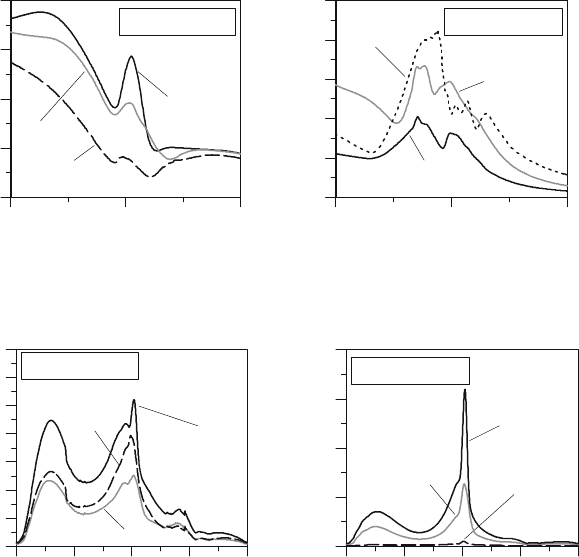
Looking now at the local values of the turbulence within the cells at the wall where the wall
function is applied (boundary layer cells), the differences become more considerable (see Figures
10.9 and 10.10). Focusing on the working period, the influences of dimension, orientation and
structure quality of the wall-cells on the turbulence becomes evident. In a moving complex
geometry there is no possibility to control any cell and eventually isolate “perturbations” on the
local turbulence calculation. Therefore the simulation of the local heat-transfer with a wall-
function approach is very often practically “out of control” since one of its most important input
variables is not reliable.
Figure 10.9: Average TKE at the
cylinder-liner wall-cells.
Figure 10.10: Average TKE at the
spark-plug wall-cells.
Figure 10.11: Average y
+
-value of the cylinder
wall-cells.
Figure 10.12: Average y
+
-value of the
cylinder-liner wall-cells.
2000 rpm - WOT
Thin
layer
Fine
Standard &
Bad SP
Cy
l
.
l
i
ner T
K
E, m
2
/s
2
0
1
2
3
4
Crank an
g
le M, de
g
630 FTDC 810
2000 rpm - WOT
Bad SP
Fine
Standard &
Thin Layer
T
K
E a
t
t
he spark p
l
ug, m
2
/s
2
0
3
6
9
12
15
Crank an
g
le M, de
g
630 FTDC 810
Standard &
Bad SP
Fine
Thin
layer
2000 rpm - WOT
Cyl. wall cells y
+
, -
0
50
100
150
200
250
300
350
Crank an
g
le M, de
g
TDC BDC FTDC BDC TDC
2000 rpm - WOT
Thin
layer
Fine
Standard &
Bad SP
Cy
l
.
l
i
ner wa
l
l
ce
l
l
s y
+
, -
0
250
500
750
1000
Crank an
g
le M, de
g
TDC BDC FTDC BDC TDC
10.2 State-of the-Art of Engine Heat-Transfer Calculation in the 3D-CFD-Simualtion 161
Figure 10.13: Percentage of
cylinder wall-cells with
y
<30.
Figure 10.14: Percentage of
cylinder wall-cells with
y
>100.
The optimal dimension for the wall-function approach is when the dimensionless wall-distance
y
assumes values between 30 and 100 units (see Chapter 10.2.1). Here the analysis of
y
for
the four simulations points out the differences to this assumption and the mesh sensitivity on the
results (see Figures 10.11-10.14). The
y
-value depends not only on the local mesh structure
but also on the flow motion whose transient state varies locally and temporally with high
gradients. Nevertheless the flow motion in general depends on the engine operating condition.
Therefore if it were possible to tune the mesh structure and the mesh motion for fulfilling the
y
-conditions at any location and time step, this process would be definitely compromised at a
different operating condition. For the above mentioned reasons the wall function approach in
internal combustion engines cannot rely on optimal
y
-conditions.
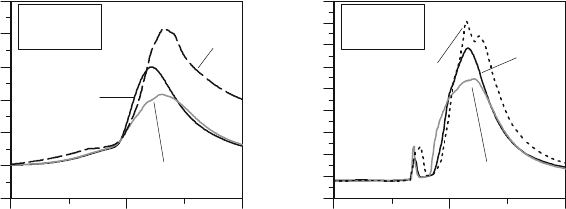
Figure 10.15: Average heat-transfer flux through the cylinder walls during the whole cycle
and the working period.
Standard &
Bad SP
Fine
Thin
layer
2000 rpm - WOT
Cyl. wall cells y
+
<30, %
0
20
40
60
80
100
Crank an
g
le M, de
g
TDC BDC FTDC BDC TDC
Standard &
Bad SP
Fine
Thin
layer
2000 rpm -
WOT
Cyl. wall cells y
+
>100, %
0
20
40
60
80
100
Crank an
g
le M, de
g
TDC BDC FTDC BDC TDC
2000 rpm -
WOT
Thin layer
Fine
Standard &
Bad SP
Cy
l
. hea
t
t
r
ansfe
r
f
l
ux, MW/m
2
-0.2
0.0
0.2
0.4
0.6
0.8
1.0
Crank an
g
l
e
M
, de
g
TDC BDC FTDC BDC TDC
2000 rpm -
WOT
Thin
layer
Fine
Standard &
Bad SP
Cy
l
. hea
t
t
r
ansfe
r
f
l
ux, M
W
/m
2
-0.2
0.0
0.2
0.4
0.6
0.8
1.0
Crank an
g
le
M
, de
g
630 FTDC 810
162 10 3D-CFD-Modeling of the Wall Heat-Transfer
Figure 10.16: Average heat-transfer flux
through the cylinder-liner walls.
Figure 10.17: Average heat-transfer flux
through the spark plug walls.
Concluding the analysis of the heat-transfer flux using the wall-function approach (see Figures
10.11-10.12) reports the extreme high sensitivity of the heat-transfer flux with the mesh. The
results of the different simulations show variations of about 500% in the prediction of the local
heat-flux (in certain cases even more) and up to 100% in the prediction of the overall heat-
transfer energy
W
Q
(J/cycle). The resulting predictability in the calculation of the heat-transfer
and the energy balance is obviously not acceptable for a reliable engine analysis.
10.2.5 QuickSim’s Approach: A new Phenomenological Heat-
Transfer Model in the 3D-CFD-Simulation
In this work a three-dimensional phenomenological heat-transfer coefficient
MD ,x
&
, which is
based on the before described Re-Nu-correlations (see Chapters 10.2.3.3 and 10.2.3.4), is
proposed for both the working cycle
MD ,
1
x
&
and the charge changing period
MD ,
2
x
&
. This
model is implemented locally, like the wall function, in only a single wall-cells layer, so that
computing overheads are not caused. The classic wall function is still used for assuring the no-
slip velocity condition and the temperature condition at the wall.
The modeling of the heat-transfer coefficients chosen for the 3D-CFD-simulation, similarly to
the real working-process analysis, is based on the following correlations [21,22]:
x
Bargende’s correlation during the compression and expansion stroke (working cycle).
x
Hohenberg’s correlation during the intake and exhaust stroke (gas exchange period).
2000 rpm -
WOT
Thin
layer
Fine
Standard &
Bad SP
Cy
l
.
l
i
ne
r
HT f
l
ux, M
W
/m
2
-0.2
0.0
0.2
0.4
0.6
0.8
1.0
Crank an
g
le
M
, de
g
630 FTDC 810
2000 rpm -
WOT
Standard &
Thin layer
Fine
Bad SP
Cy
l
. spa
r
k p
l
ug HT f
l
ux, M
W
/m
2
-0.2
0.0
0.2
0.4
0.6
0.8
1.0
1.2
1.4
1.6
Crank an
g
le
M
, de
g
630 FTDC 810

10.2 State-of the-Art of Engine Heat-Transfer Calculation in the 3D-CFD-Simualtion 163
10.2.5.1 The Heat-Transfer during the Working Cycle
The effects of the heat transfer on the working cycle behavior are remarkable because, e.g. the
ratio of the heat losses to the total heat transfer usually amounts to more than 80% and it is still
more than 45% during the combustion period only.
The aim of this work is to develop a three-dimensional heat transfer model
MD ,
1
x
&
, which,
first of all, ensures a high accuracy in predicting the overall heat transfer rate
CFD
W
ddQ M
at every time step. This condition is a prerequisite for a thorough
prediction of the engine energy balance. In this manner, the overall heat transfer rate
calculated from the real working-process analysis (WP)
WP
W
ddQ M
is taken
as the representative value.
Target
WP
W
CFD
W
d
dQ
d
dQ
¸
¸
¹
·
¨
¨
©
§
M
¸
¸
¹
·
¨
¨
©
§
M
(10.18)
with
>@
¦
M
MMD
¸
¸
¹
·
¨
¨
©
§
M
j
jjWjCj
CFD
W
d
dt
AxTxTx
d
dQ
&&&
,,
1
(10.19)
where
M
,
jC
xT
&
is the temperature at the center node of a cell
j
adjacent to the wall with the
surface
j
A
and a constant temperature
jW
xT
&
over the time.
Starting from the known formulation of Bargende:
' MD
,,,,,),(
78.0477.078.0073.0
1
wTpVafx
j
&
(10.20)
where
a is a corrector factor for the local implementation and having the detailed results of the
flow field in the 3D-CFD-simulation at disposal, it is now necessary to find out how to set
appropriately the variables for each wall-cell
j
in this formulation.
This is a critical choice which requires not only to identify the phenomenon-relevant value for
each variable but also to avoid unreliable variables (e.g. local values of
k and H of wall-cells –
see Chapter 10.2.4.1). Many trial-and-error adjustments in setting the variables in
M
D ,
1
j
x
&
have been tested in order to reach the best compromise between overall and local heat transfer
rate prediction, high accuracy on different engines, high accuracy at different engine operating
conditions and low influence of the mesh structure on the results.
164 10 3D-CFD-Modeling of the Wall Heat-Transfer
Model Development Step
The development tests of
M
D ,
1
j
x
&
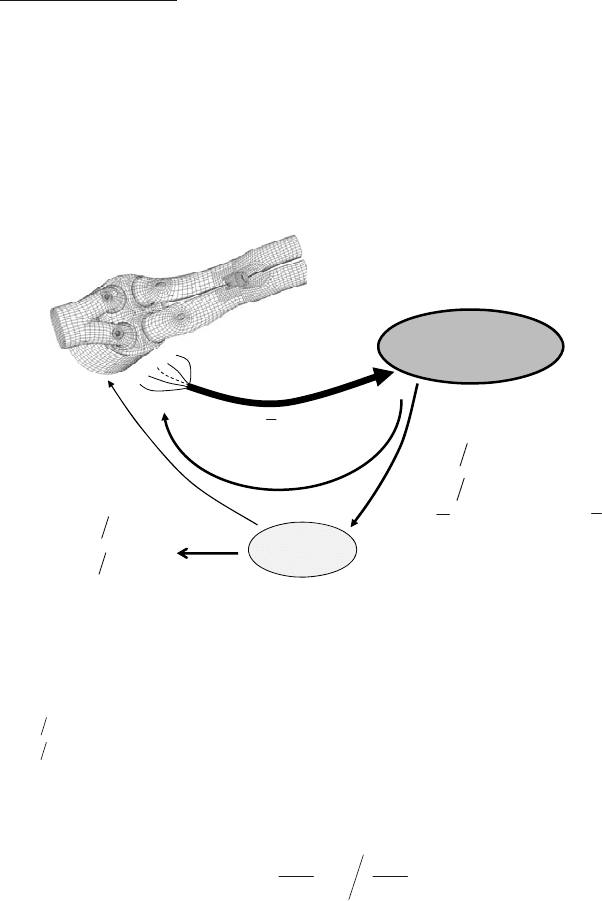
have been performed by using both the evaluation tool and
the real working-process analysis program (WP) implemented in
QuickSim via user-subroutines
(see Chapter 7). This becomes an "internal 3D-CFD-WP coupling" (see Figure 10.18) as the next
feasible step of the result comparison shown in Figure 10.5. This approach ensures not only the
same “thermodynamic conditions” between 3D-CFD and WP, but also provides, at every time
step, the necessary average values of the variables used in the real working-process analysis to
the three-dimensional simulation.
Figure 10.18: The decisive step: the “internal coupling” between a 3D-CFD-code and
the real working-process analysis.
Choosing a variant of
M
D ,
1
j
x
&
, which is mostly a combination of global (averaged overall
variables) and local variables, respectively, the heat-transfer rate of the CFD-simulation
CFD
W
ddQ M
has been calculated and compared to that of the working-process analysis
WP
W
ddQ M
. If they differed, at every time step, an overall correction variable
M
HT
c (see
Eq. 10.21) is determined and set in the 3D-CFD-simulation (see Eq. 10.22), in order to correct
the wall heat flux (see Eq. 10.23). In this manner at least, during the model developing phase, a
representative overall heat transfer rate has been imposed as a boundary condition.
WP
W
CFD
W
HT
d
dQ
d
dQ
c
¸
¸
¹
·
¨
¨
©
§
M
¸
¸
¹
·
¨
¨
©
§
M
M
(10.21)
Evaluation
Tool
WP
,
,
WP
B
WP
W
ddQ
ddQ
M
M
&
&&&
,,
,,,,
M
MM
ji
jj
xw
xvxT
,,,,,,,
,
,
kwVVTTp
ddQ
ddQ
BBUG
CFD
B
CFD
W
M
M
3D-CFD-
Simulation
M
HT
c
...,,
,,
MM
MM
fP
uS
kV

10.2 State-of the-Art of Engine Heat-Transfer Calculation in the 3D-CFD-Simualtion 165
With the calculation of
M
HT
c
the heat-transfer coefficient has to be corrected:
M
D
M
M
D ,,
11 jHT
corr
j
xcx
&
&
(10.22)
so that:
.
, WP
W
CFD
W
HT
corrCFD
W
d
dQ
d
dQ
c
d
dQ
¸
¸
¹
·
¨
¨
©
§
M
¸
¸
¹
·
¨
¨
©
§
M
M
¸
¸
¹
·
¨
¨
©
§
M
(10.23)
The phenomenological model was not validated until the heat-transfer correction variable
M
HT
c
became approximately a constant
HT
c
, so that this value can be included in the constant
a
of Eq.10.20, leading to:
' MD
,,,,,),(
78.0477.078.0073.0
1
wTpVafx
j
&
(10.24)
where:
HT
caa
(10.25)
In addition to the above mentioned approach that uses the validated model with a constant value
of
HT
c
, the user of QuickSim has also the possibility to run a simulation with an automatic
adjustment of
M
HT
c
. In this case the profile of the calculated 3D-CFD-heat-transfer (actual
value) will always equal that one of the real working-process analysis (set value).
Final Formulation
In this section the numerical implementation procedure of each variable in the phenomenological
model is described for the final version of
M
D ,
1
j
x
&
:
Volume
The instantaneous cylinder volume
MV
is taken as the characteristic geometrical entity in
which the heat-transfer process takes place.
Pressure
The pressure in the combustion chamber of an internal combustion engine can be assumed as
uniform. The local value of the pressure in the wall-cell
Mp
is taken as the relevant value.