Carranza E. Geochemical anomaly and mineral prospectivity mapping in GIS
Подождите немного. Документ загружается.

254 Chapter 8
mineral prospectivity is usually subjective. The following discussions explain and
demonstrate analytical tools that can aid in the objective selection of a suitable square
unit cell size for GIS-based data-driven modeling of mineral prospectivity.
The choice of a suitable unit cell size must be based on the spatial configuration or
pattern of locations of a-priori samples, i.e., the known locations of mineral deposits of
the type sought. In sampling theory, this strategy is referred to as
retrospective sampling,
which is applied to previously sampled areas, as opposed to
prospective sampling, which
is applied to unsampled areas. Because known locations of mineral deposits are usually
depicted as points in data-driven modeling of mineral prospectivity, especially in
regional- to district-scales of mapping, algorithms of point pattern analysis for measures
of dispersion (Boots and Getis, 1988; Rowlingson and Diggle, 1993), which are
independent of the size of a study area, can be used to determine distances from every
deposit-type location and the corresponding probabilities associated with these distances
that there is one neighbour deposit-type location situated next to another deposit-type
location. The range of distances in which there is zero probability of one neighbour
deposit-type location situated next to another deposit-type location is a set of choices for
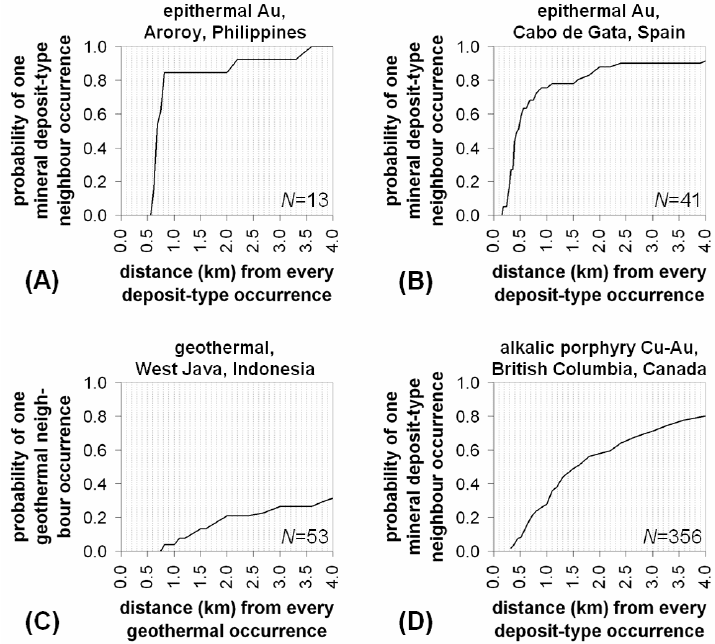
a suitable unit cell size. Fig. 8-1 shows the results of the application of measures of
dispersion via point pattern analysis to different types of mineral deposits and to
geothermal prospects in four different areas. For each area, the results suggest different
ranges of suitable unit cell sizes for data-driven modeling of prospectivity for the types
of Earth resources under examination. For data-driven modeling of prospectivity for
epithermal Au deposits in the Aroroy district (Philippines), a suitable unit cell size is at
most 560 m. For data-driven modeling of prospectivity for epithermal Au deposits in the
Cabo de Gata area (Spain), a suitable unit cell size is at most 160 m. For data-driven
modeling of geothermal prospectivity in West Java (Indonesia), a suitable unit cell size
is at most 750 m. For data-driven modeling of prospectivity for alkalic porphyry Cu-Au
deposits in British Columbia, a suitable cell size is at most 330 m. The results of the
application of measures of dispersion via point pattern analysis (e.g., Fig. 8-1) are
considered further in a graphical analysis, which is described below, to aid the objective
selection of a suitable unit cell size for GIS-based data-driven modeling of mineral
prospectivity.
Based on a unit cell size [denoted hereafter as
N(•)], a study area T has N(T) total
number of unit cells, has
N(D) number of unit cells each containing just one D deposit-
type location and has
N(T)–N(D) number of unit cells not containing D. An a-priori
estimate of prospectivity (i.e., in the absence of spatial evidence) of mineral deposits of
the type sought in a study area is the ratio [
N(D)] : [N(T)–N(D)]. This ratio represents the
spatial contrast between mineralised cells and barren cells. Empirically, the ratio [
N(D)] :
[
N(T)–N(D)] must be a very small value because mineralisation is a relatively rare
geological phenomenon, meaning that
N(•) must be suitably fine. All possible N(•)
within the range of distances with zero probability of one neighbour
D situated next to
another
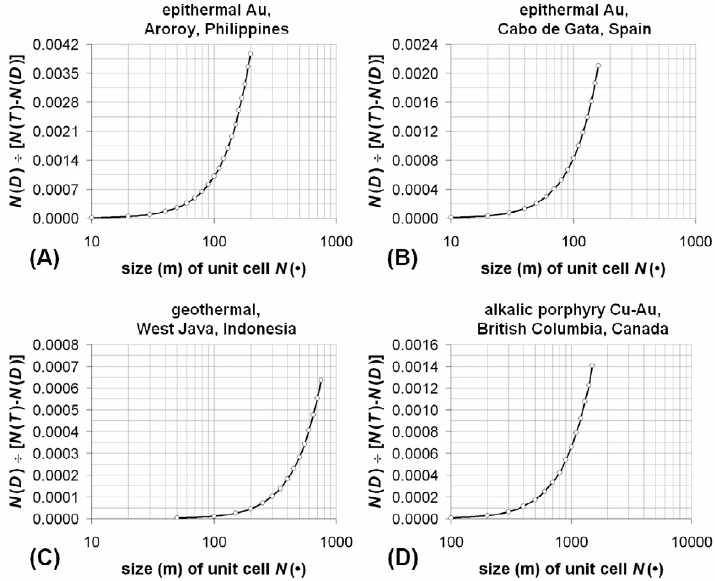
D (Fig. 8-1) result in very small values of the ratio [N(D)] : [N(T)–N(D)].
However, Fig. 8-2 shows that the ratio [
N(D)] : [N(T)–N(D)] increases exponentially as
Data-Driven Modeling of Mineral Prospectivity 255
the N(•) increases linearly. Because N(D) is constant when each D is contained in only
one cell (except in Fig. 8-2D when
N(•) ≥ 330 m), the exponential increase in the ratio
[
N(D)] : [N(T)–N(D)] is due to the exponential decrease in [N(T)–N(D)] as N(•) linearly
increases.
The graphs in Fig 8-2 do not readily indicate, however, which
N(•) is the most
suitable for data-driven modeling of prospectivity of the deposit-type of interest in each
of the areas under examination. Nevertheless, the individual data sets plotted in Fig. 8-2
Fig. 8-1. Distances and corresponding probabilities that one resource-type location is situated next
to another resource-type location in a study area. Results of application of measures of dispersion
via point pattern analysis (Boots and Getis, 1988; Rowlingson and Diggle, 1993) to the locations
of (A) epithermal Au deposits in Aroroy, Philippines (see Fig. 3-9), (B) epithermal Au deposits in
Cabo de Gata, Spain (see Carranza et al., 2008a), (C) geothermal occurrences in West Java,
Indonesia (see Carranza et al., 2008c) and (D) alkalic porphyry Cu-Au deposits in British
Columbia, Canada (see Carranza et al., 2008b). N denotes number of resource-type locations.
256 Chapter 8
can be investigated further to find the most suitable N(•) per area. One procedure of
doing so is to determine the amount (expressed in %) of increase in the ratio [
N(D)] :
[
N(T)–N(D)] from a unit cell size N(•)
i
to the next coarser unit cell size N(•)
i+1
(where 1
denotes the unit cell size interval used to create the graphs in Fig. 8-2). An alternative
procedure is to determine the amount (expressed in %) of decrease in the ratio [
N(D)] :
[
N(T)–N(D)] from a unit cell size N(•)
i
to the next finer unit cell size N(•)
i–1
(where 1
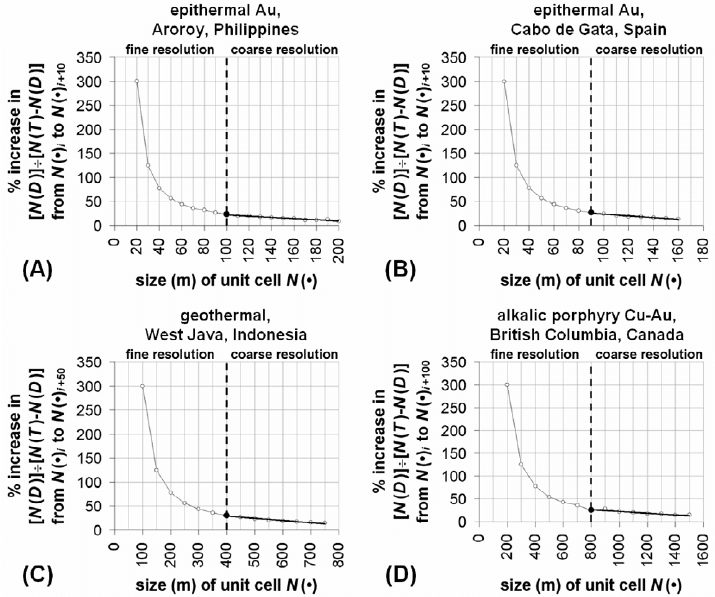
denotes the unit cell size interval used to create the graphs in Fig. 8-2). Based on the first
procedure, the graphs in Fig. 8-3 indicate that the rate of increase in the ratio [
N(D)] :
[
N(T)–N(D)] is much higher when using finer unit cells than when using coarser unit
cells. The results shown in Fig. 8-3 are consistent with the knowledge that, in raster-
based GIS (cf. Stein et al., 2001; Hengl, 2006; Nykänen and Raines, 2006), the overall
spatial information content in a map (in this case a map of
D) decreases and increases as
Fig. 8-2. Variations of the ratio [N(D)] : [N(T)–N(D)] as a function of unit cell size N(•). The
results shown are mostly for the ranges of zero-
p
robability distances derived from the point pattern
analyses (Fig. 8-1) of (A) epithermal Au deposits, Aroroy (Philippines), (B) epithermal Au
deposits, Cabo de Gata (Spain), (C) geothermal occurrences, West Java (Indonesia) and (D)
alkalic porphyry Cu-Au deposits, British Columbia (Canada).
Data-Driven Modeling of Mineral Prospectivity 257
the spatial resolution becomes coarser and finer, respectively. The results of the second
procedure lead to identical interpretations as the results of the first procedure.
The graphs in Fig. 8-3 allow distinction between
N(•) that can be considered ‘fine’
resolution and
N(•) that can be considered ‘coarse’ resolution. Gradual (i.e., equal
interval) changes in the sizes of fine resolution
N(•) are associated with exponential rates
of increase in the spatial information content in a map of
D, whilst gradual changes in
the sizes of coarse resolution
N(•) are associated with linear rates of increase in the
Fig. 8-3. Variations in the rate of percent increase in the ratio [N(D)] : [N(T)–N(D)] as function o
f
linear increase in unit cell size N(•) for representation of deposit-type locations: (A) epithermal Au
deposits in Aroroy, Philippines (see Fig. 3-9); (B) epithermal Au deposits in Cabo de Gata, Spain
(see Carranza et al., 2008c); (C) geothermal occurrences in West Java, Indonesia (see Carranza et
al., 2008a); and (D) alkalic porphyry Cu-Au deposits in British Columbia, Canada (see Carranza et
al., 2008b). Changes in fine resolution N(•) result in exponentially decreasing rates (thin curves)
of increase in the ratio [N(D)] : [N(T)–N(D)], whilst changes in coarse resolution N(•) result in
weak linearly decreasing rates (thick curves) of increase in the ratio [N(D)] : [N(T)–N(D)]. See text
for further explanation.
258 Chapter 8
spatial information content in a map D. A N(•) about the transition from fine resolution
N(•) to coarse resolution N(•) represents a threshold N(•) that can be considered the
most suitable
N(•). A N(•) that is either much finer or much coarser than the most
suitable
N(•) is likely an impractical representation of D. Thus, according to the results
shown in Fig 8-3, the most suitable
N(•) is either the coarsest fine resolution N(•) or the
finest coarse resolution
N(•). For data-driven modeling of prospectivity for epithermal
Au deposits in the Aroroy district (Philippines), the results suggest that the most suitable
N(•) is 100 m (Fig. 8-3A). For data-driven modeling of prospectivity for epithermal Au
deposits in the Cabo de Gata area (Spain), the results suggest that the most suitable
N(•)
is 90 m (Fig. 8-3B). For data-driven modeling of geothermal prospectivity in West Java
(Indonesia), the result suggest that the most suitable
N(•) is 400 m (Fig. 8-3C). For data-
driven modeling of prospectivity for alkalic porphyry Cu-Au deposits in British
Columbia, the result suggest that the most suitable
N(•) is 800 m (Fig. 8-3D). Based on
the analyses of the graphs in Fig. 8-3, it seems that the most suitable
N(•) is
approximately an inflection point in each of the curves of [
N(D)] : [N(T)–N(D)] versus
N(•) shown in Fig. 8-2. Provided that it is so, visual inspection of an inflection point in a
curve of [
N(D)] : [N(T)–N(D)] versus N(•) is, however, difficult because such a curve is
very smooth (Fig. 8-2). The technique of deriving the curves shown in Fig. 8-3 aids,
therefore, in identification of an inflection point in a curve of [
N(D)] : [N(T)–N(D)]
versus
N(•) and in selection of a most suitable N(•).
In contrast to and notwithstanding of the results of the analyses illustrated in Figs. 8-
2 and 8-3, the following previous works of GIS-based data-driven modeling of mineral
prospectivity each used a
N(•) based on subjective judgment in view of the distance-
probability relation. In data-driven modeling of prospectivity for epithermal Au deposits
in the Cabo de Gata area (Spain), Carranza et al. (2008a) chose and used a
N(•) of 100
m, which is within the range of distances in which there is zero probability of one
neighbour epithermal Au deposit location situated next to another epithermal Au deposit
location (Fig. 8-1B) and which is slightly coarser than the most suitable
N(•) of 90 m
suggested by the results presented in Fig. 8-3B. In data-driven modeling of geothermal
prospectivity in West Java (Indonesia), Carranza et al. (2008c) selected and used a
N(•)
of 500, which is within the range of distances in which there is zero probability of one
neighbour geothermal location situated next to another geothermal location (Fig. 8-1C)
and which is slightly coarser than the most suitable
N(•) of 400 m suggested by the
results displayed in Fig. 8-3C. In data-driven modeling of prospectivity for alkalic
porphyry Cu-Au deposits in British Columbia, Carranza et al. (2008b) used a
N(•) of 1
km, which is outside the range of distances in which there is zero probability of one
neighbour alkalic porphyry Cu-Au deposit location situated next to another alkalic
porphyry Cu-Au deposit location (Fig. 8-1A) and which is slightly coarser than the most
suitable
N(•) of 800 m suggested by the results shown in Fig. 8-3D. In these three case
studies, the common reason for selecting and using a
N(•) that is slightly coarser than the
most suitable
N(•) suggested by the results shown in Figs. 8-3B to 8-3D is simplicity of
Data-Driven Modeling of Mineral Prospectivity 259
area calculations (i.e., as multiples of number of unit cells or pixels) in the application of
a raster-based or pixel-based GIS.
The application of point pattern analysis (Boots and Getis, 1988; Rowlingson and
Diggle, 1993), as shown in Fig. 8-1, can therefore be useful in deriving a preliminary set
of choices for a suitable
N(•). However, the final choice of a suitable unit cell size must
also consider (a) the scale of the field geological observations used in constructing a
mineral deposit occurrence database, (b) the scales of the input maps or images of spatial
data of explanatory/predictor variables and (c) the scale of the desired output mineral
prospectivity map(s). These considerations were taken by Carranza et al. (2008b) in
data-driven modeling of prospectivity for alkalic porphyry Cu-Au deposits in British
Columbia. The current British Columbia MINFILE mineral inventory database (BCGS,
2007) contains records of prospect- to mine-camp-scale (usually larger than 1:10,000)
data for 356 locations of alkalic porphyry Cu-Au deposits. In contrast, the scale of the
geologic map is 1:250,000 (Massey et al., 2005), whereas the airborne magnetic and
gravity data were captured in 1-km and 2-km grids, respectively (Geoscience Data
Repository, 2006a, 2006b), which translate to map scales of about 1:400,000 and
1:800,000, respectively (see Hengl, 2006). Therefore, in view the different scales or
spatial resolutions of input spatial data of the explanatory/predictor variables, Carranza
et al. (2008b) used an ‘average’ unit cell size of 1 km. The use of a larger unit cell size
than indicated by the distance-probability relation can mean that more than one deposit-
type location is covered by a unit cell, and this was the case for some unit cells in the
British Columbia study. Here, however, some of the alkalic porphyry Cu-Au deposits
(e.g., Axe (Adit Zone), Axe (South Zone) and Axe (West Zone)) described in the
MINFILE database probably represent one large alkalic porphyry Cu-Au deposit so, if
that is the case, using a larger unit cell size than indicated by the distance-probability
relation is justifiable.
Whether a preliminary set of choices for a suitable
N(•) indicated by the distance-
probability relation is adopted or adapted, the analysis of the rate of increase in the ratio
[
N(D)] : [N(T)–N(D)] as function of equal-interval change in N(•), as illustrated in Fig.
8-3, is robust regardless of the number of deposit-type locations and the size of a study
area. Nevertheless, it is also imperative to verify if the most suitable
N(•) suggested by
results of analyses depicted in Figs. 8-2 and 8-3 is reasonably consistent with the average
lateral extents (at prospect- to mine-camp-scales) of known occurrences of mineral
deposits of the type sought. Data of lateral extents of known occurrences of mineral
deposits of the type sought are, unfortunately, not available in many cases. If such is the
case, then the sorts of analyses demonstrated here, although mainly graphical, provide an
objective way of selecting the most suitable
N(•) for GIS-based data-driven modeling of
mineral prospectivity. After having made a final objective choice of a suitable
N(•), one
must next determine which of the known locations of mineral deposits of the type sought
are suitable in data-driven modeling of mineral prospectivity.
260 Chapter 8
SELECTION OF COHERENT DEPOSIT-TYPE LOCATIONS FOR MODELING
Every mineral deposit, even if classified into a deposit-type, is unique and has
characteristics that are, to a certain extent, dissimilar to other mineral deposits of the
same type. It follows that multivariate spatial data signatures of deposit-type locations
are, to a certain extent, dissimilar or non-coherent. Because modeling of mineral
prospectivity involves ‘fitting’ (i.e., establishing spatial associations between) a map of
D with several maps of spatial data of X
i
evidential features, dissimilarity (i.e.,
heterogeneity or non-coherence) of multivariate spatial data signatures of deposit-type
locations can undermine the quality of a data-driven model of mineral prospectivity.
Carranza et al. (2008b) have shown that uncertainties of a data-driven model of mineral
prospectivity can be reduced and that fitting- and prediction-rates of a data-driven model
of model prospectivity can be improved by using a set of coherent deposit-type locations
(i.e., with similar multivariate spatial data signatures).
A two-stage methodology for selection of coherent deposit-type locations is
explained and demonstrated here (after Carranza et al., 2008b): (1) analysis of mineral
occurrence favourability scores of individual spatial data sets with respect to deposit-
type and non-deposit locations; and (2) analysis of deposit-type locations with similar
multivariate spatial data signatures. This two-stage methodology is demonstrated in the
case study area (Aroroy district, Philippines). Before doing so, let us address first the
issues of (a) increasing the number of locations of the target variable in a study area if it
is considered and/or found insufficient (e.g., 13 as in the case study area here) to derive,
depending on the method (Tables 8-I and 8-II), a proper (e.g., statistically significant)
data-driven model of mineral prospectivity and (b) selecting non-deposit locations
required in the analysis of coherent deposit-type locations and in the application of
multivariate methods of data-driven modeling of mineral prospectivity (Table 8-II).
The issue of increasing the number of locations of the target variable can be
addressed by considering locations immediately around each of the known deposit-type
locations as proxy deposit-type locations. This consideration is based on the assumption
that locations immediately around known deposit-type locations are also probably (albeit
weakly) mineralised. Thus, given a map of
D partitioned into equal-sized unit cells, the
eight unit cells surrounding the unit cell representing a deposit-type location can be
considered proxy deposit-type locations. (For the case study area, there are 104 (i.e.,
13
×8) proxy deposit-type locations.) Alternatively, an optimum distance buffer around
each deposit-type location can be sought via point pattern analysis (Boots and Getis,
1988; Rowlingson and Diggle, 1993) such that (a) there is zero probability of a
neighbour deposit-type location within a buffered deposit-type location and (b) based on
knowledge that mineralisation is a very rare geological phenomenon, the total number of
unit cells representing deposit-type and proxy deposit-type locations forms a very small
percentage (say, 1%) of the total number of unit cells in a study area (Carranza and Hale,
2001b, 2003; Carranza, 2002). The application of proxy deposit-type locations reduces
artificial spatial associations between evidential data and deposit-type locations
(Stensgaard et al., 2006), which usually occur when the number of the latter is small
Data-Driven Modeling of Mineral Prospectivity 261
(e.g., Carranza, 2004b). However, like the multivariate spatial data signatures of deposit-
type locations, the multivariate spatial data signatures of proxy deposit-type locations
are, to a certain extent, dissimilar or non-coherent. So, the two-stage methodology for
selection of coherent deposit-type locations is also demonstrated in selecting coherent
proxy deposit-type locations.
The issue of selecting non-deposit locations can be addressed by considering the
following three selection criteria (Carranza et al., 2008b). Firstly, in contrast to deposit-
type locations, which exhibit non-random spatial patterns (see Chapter 6), non-deposit
locations must be random (or randomly selected) so that their multivariate spatial data
signatures are likely non-coherent. Point pattern analysis (Diggle, 1983; Boots and Getis,
1988) can be applied to evaluate degrees of spatial randomness of selected non-deposit
locations (see Chapter 6 for application to deposit-type locations). Secondly, random (or
randomly-selected) non-deposit locations must be distal to (or located far away from)
deposit-type locations under study because locations proximal to deposit-type locations
likely have similar multivariate spatial data signatures to deposit-type locations and thus
probably do not qualify as non-deposit locations. Point pattern analysis (Diggle, 1983;
Boots and Getis, 1988) can be applied to determine the minimum distance from every
deposit-type location within which there is 100% probability of a neighbour deposit-type
location. In some cases, the criterion of ‘minimum distance with 100% probability’ may
leave insufficient locations for random selection of non-deposit locations, so one may
consider a lower probability distance. (For the case study area, non-deposit locations are
randomly selected beyond 2.2 km of any deposit-type location; within this distance from
any deposit-type location there is 90% probability of a deposit-type location (Fig. 8-
1A).) Thirdly, the number of distal and random non-deposit locations must be equal to
the number of deposit-type locations, because the latter locations are rare. This criterion
applies especially when logistic regression is used, as in the analysis of coherent deposit-
type locations (see below). The use of equal number of ‘zeros’ (e.g., non-deposit
locations) and ‘ones’ (e.g., deposit-type locations) in logistic regression is optimal when
the latter is rare (Breslow and Cain, 1988; Schill et al., 1993). In cases of rare ‘ones’,
King and Zeng (2001) aver that the information content contributed by the independent
variables used in logistic regression starts to diminish as the number of ‘zeros’ exceeds
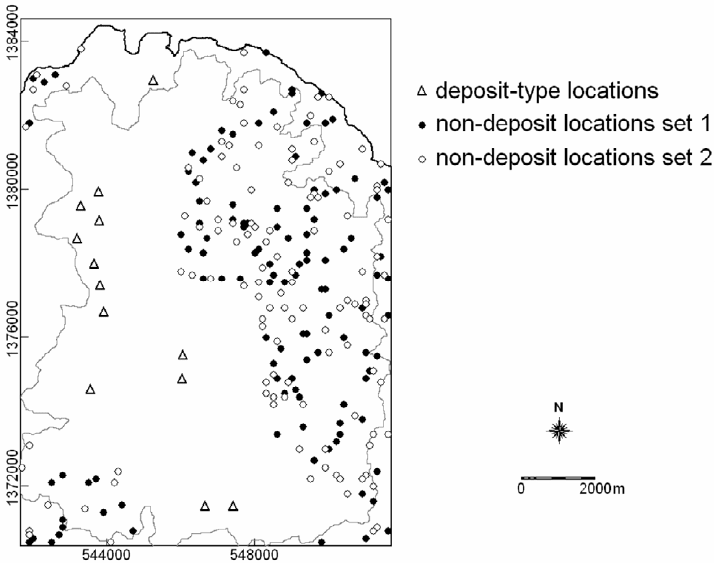
the number of ‘ones’. (For the case study, 117 distal and random non-deposit locations
are selected in order to match the total number of deposit-type and proxy deposit-type
locations. Two sets of distal and random non-deposit locations are generated (Fig. 8-4)
in order to demonstrate the reproducibility and robustness of the methodology of
selecting coherent deposit-type locations.)
We now turn to the two-stage analysis of coherent deposit-type locations.
Analysis of mineral occurrence favourability scores at deposit-type locations
This section describes and discusses the first stage in selecting coherent deposit-type
locations and coherent proxy deposit-type locations. This involves deriving mineral
occurrence favourability scores (
MOFS) of spatial data with respect to deposit-type and
262 Chapter 8
non-deposit locations. The MOFS represent likelihood of mineral occurrence, in the
range [0,1], as a function of spatial data representing the presence of indicative
geological features. Deriving the
MOFS involves establishing spatial associations
between maps of individual spatial data sets and a map of deposit-type locations. For this
purpose, either the distance distribution method or the distance correlation method,
which are explained and demonstrated in Chapter 6, can be used. Only spatial data sets
exhibiting positive spatial associations with the deposit-type locations are used further in
the analysis. Thus, for the case study area (see results of analysis in Chapter 6), the
spatial data sets used are (1) distance to NNW-trending faults/fractures, (b) distance to
NW-trending faults/fractures, (3) distance to intersections of NNW- and NW-trending
faults/fractures and (4) integrated PC2 and PC3 scores obtained from the catchment
basin analysis of stream sediment geochemical data (see Chapter 5 and Fig. 5-12). For
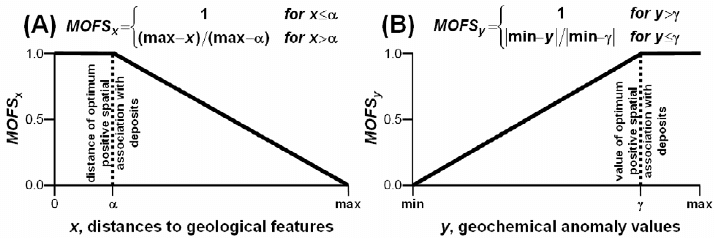
spatial data representing distances to geological features (e.g., faults/fractures), distances
equal to or less than the distance of optimum positive spatial association with the
Fig. 8-4. Two sets of randomly-selected non-deposit locations situated distal to [deposit-type]
locations of epithermal Au deposits in Aroroy district (Philippines). Polygon outlined in grey is
area of stream sample catchment basins (see Fig. 4-11).
Data-Driven Modeling of Mineral Prospectivity 263
deposit-type locations are assigned MOFS of [1], whilst distances greater than the
distance of optimum spatial association with the deposit-type locations are assigned
linearly decreasing
MOFS from [1] to [0] (Fig. 8-5A). For spatial data representing
geochemical anomaly values, values greater than the value of optimum positive spatial
association with the deposit-type locations are assigned
MOFS of [1], whilst values
equal to or less than the value of optimum spatial association with the deposit-type
locations are assigned linearly decreasing
MOFS from [1] to [0] (Fig. 8-5B).
A database of
MOFS of spatial data is then created for the deposit-type locations, the
proxy deposit-type locations and randomly-selected distal non-deposit locations. In a
GIS, creating this database involves an overlay operation (plus table operation) between
a map of
MOFS and a map of point locations under study (see, for example, Figs. 3-7
and/or 5-6). Then, it is instructive to create boxplots of
MOFS of spatial data at the
deposit-type locations, the proxy deposit-type locations and randomly selected non-
deposit locations in order to visualise the overall dissimilarities in the spatial
characteristics of these locations. For example, in the case study area, the locations of
epithermal Au deposits and their immediate surroundings are strongly dissimilar to non-
deposit locations in terms of proximity to faults/fractures (Figs. 8-6A to 8-6C) and are
moderately to strongly dissimilar to non-deposit locations in terms of geochemical
anomalies (Fig. 8-6D). However, Fig. 8-6 also shows that even individual deposit-type
locations and individual proxy deposit-type locations exhibit dissimilarities in terms of
proximity to faults/fractures and geochemical anomalies, which indicate that multivariate
spatial data signatures of deposit-type locations and of proxy deposit-type locations are,
to a certain extent, dissimilar or non-coherent.
Analysis of coherent deposit-type locations
This section describes and discusses the second stage in selecting coherent deposit-
type locations and coherent proxy deposit-type locations. The concept of the analysis in
Fig. 8-5. Scheme of assigning or calculating mineral occurrence favourability scores (MOFS) to
spatial data, such as (A) distances to geological features (e.g., faults/fractures) and (B)
geochemical anomaly values, based on their spatial association with deposit-type locations.