Boyer George R. An Economic History of the English Poor Law, 1750-1850
Подождите немного. Документ загружается.

The New Poor
Law
and
the Agricultural
Labor Market
227
Southeastern farmers responded
to the
decline
in
revenue
by
cutting
nominal wages.
The
Second Report on the
Wages,
Earnings,
and Condi-
tions
of
Employment
of
Agricultural Labourers (Parl. Papers
1905:
XCVII) contains time series
of
wages
for 12
southeastern farms from
1846
to
1851.
31
The time series show that nominal wages
of
East Anglian
farm laborers declined
by
17.1% from
1846 to
1851; elsewhere
in the
southeast wages declined by 15.0%. The cost
of
living fell
by
17.1%
over
the period (Lindert
and
Williamson 1985:
148), so
real wages
of
East
Anglian laborers remained constant from 1846
to
1851,
while real wages
of laborers elsewhere
in the
southeast increased
by 2.5%.
Nominal
wages
of
London builders' laborers remained constant from
1846
to 1851
(Schwarz
1986: 38); the
decline
in
living costs caused real wages
to
increase
by
20.7%.
The
rural-urban earnings
gap
therefore increased
sharply from 1846
to
1851.
From 1832
to
1846, real wages
of
London builders' laborers increased
by only
8%. The
increase
in
farm laborers' income during this period
can
be
estimated
by
assuming that from
1846 to 1851
real income
re-
mained constant
in
East Anglia
and
increased
by
2.5% elsewhere.
The
estimates obtained from this procedure
are
given
in
column
2 of
Table
7.7. Apart from East Anglia
and
Berkshire, farm laborers' earnings
increased
by 6.6%
from 1832
to
1846, roughly
the
same
as the
increase
in London laborers' earnings. Farm laborers' income increased
by
more
than
8% in 4
counties;
the
earnings
gap
between London
and
these
counties declined.
On the
other hand, East Anglian laborers' earnings
declined,
on
average,
by 1.5%
from 1832
to 1846.
It
is not
surprising that
the
earnings
gap
between London
and
East
Anglia increased by more than the earnings gap between London and the
rest of the southeast, because East Anglia
was
the major wheat-producing
region
in
England.
In 1836,
19.2%
of the
farmland
in
East Anglia
was
devoted
to
wheat, as compared
to
15.6%
in the
rest
of
the southeast
and
10.8%
in
England
and
Wales.
32
From 1842
to
1851 wheat prices were
on
average
20%
below their level in 1830-2 (Mitchell and Deane
1962:
488).
31
The
report presents time series
for 133
English farms
of
"weekly cash wages
... to
ordinary farm labourers
in
receipt
of
full men's wages, exclusive
of
payments
for
piece-
work,
or
extra payments during
hay and
corn harvest,
or for
overtime,
or the
value
of
any allowances
in
kind" (Parl. Papers
1905:
XCVII,
65).
Although most
of the
series
begin
in
1850
or
later,
the
series
for 12
southeastern farms
(5 in
East Anglia) begin
at or
before
1846.
32
The estimates are based on land use and crop data from the tithe surveys compiled at the
county level by Kain (1986). I calculated the share of farmland devoted to wheat by divid-
ing each region's estimated acreage in wheat by its estimated acreage in arable and grass.
228
An
Economic History of the
English Poor
Law
The precarious situation
of
East Anglian farmers
in
1850-1 was noted
by
Caird, who wrote (1852: 146) that "the position
of
the Suffolk farmer has
been gradually reduced;
and ... a
continuation
of
low prices will bring
ruin on those who have been farming with borrowed capital." Concerning
Cambridge, Caird wrote that
"in
any district of England in which
we
have
yet been, we have not heard the farmers speak
in a
tone of greater discour-
agement than here" (1852: 467-8).
The agricultural depression ended
in
1853,
and as a
result
the
earn-
ings
gap
between London
and the
rural southeast declined. From
1851
to 1855
nominal wages
of
agricultural laborers
on 12
farms
in the
"chief corn-growing counties"
of
Essex, Suffolk, Norfolk, Cambridge,
Lincoln,
and
Huntingdon increased
by
38.3%,
while
the
nominal wage
of London builders' laborers increased
by
16.7%.
33
From
1855 to the
early 1870s
the
earnings
gap
between London
and the
rural southeast
remained roughly constant. Column
3 of
Table
7.7
contains estimates
of
the
change
in
real wages
of
southeastern agricultural laborers from
1850-1
to
1869-70. During this period real wages
of
London builders'
laborers increased
by
5.4%.
34
The
wage
gap
between London
and 13
of
the 15
southeastern counties declined from 1850-1
to
1869-70.
Agricultural laborers' wages increased most rapidly,
and
therefore
the
wage
gap
declined most sharply,
in
East Anglia,
the
region that
had
experienced
the
largest relative decline
in
earnings from
1832 to
1850-1.
The above results show that the earnings gap between London and
the
rural southeast reached
a
maximum from
1849 to
1852.
35
An
accurate
measure
of the
long-term trend
in
labor market integration after
1834
therefore cannot
be
obtained by comparing rural-urban earnings gaps
in
1831-2
and
1850-1.
From 1832
to
1846
the
earnings
gap
between
Lon-
don
and
most southeastern counties remained roughly constant.
The
earnings
gap
increased sharply from
1846 to 1851, as a
result
of the
severe agricultural depression that began
in
1849.
The
return
of
agricul-
tural prosperity after
1853
brought
a
sharp increase
in
rural laborers'
33
Data on nominal wages of farm laborers are from the Second Report on the Wages,
Earnings,
and
Conditions
of
Employment of Agricultural Labourers (Parl. Papers
1905:
XCVII, 68). Wage data for London builders' laborers are from Schwarz (1986: 38).
34
Wage data for London builders' laborers in 1850-1 are from Schwarz (1986: 38). Data
for 1869-70 are from Bowley
(1901:
104). Both sources present data for bricklayers'
laborers.
35
Williamson (1982: 17) found that the "wage gap between farm and nonfarm unskilled
workers" for England as a whole reached a maximum in 1851, then declined sharply
from 1851 to 1871.
The New Poor Law and
the Agricultural
Labor Market 229
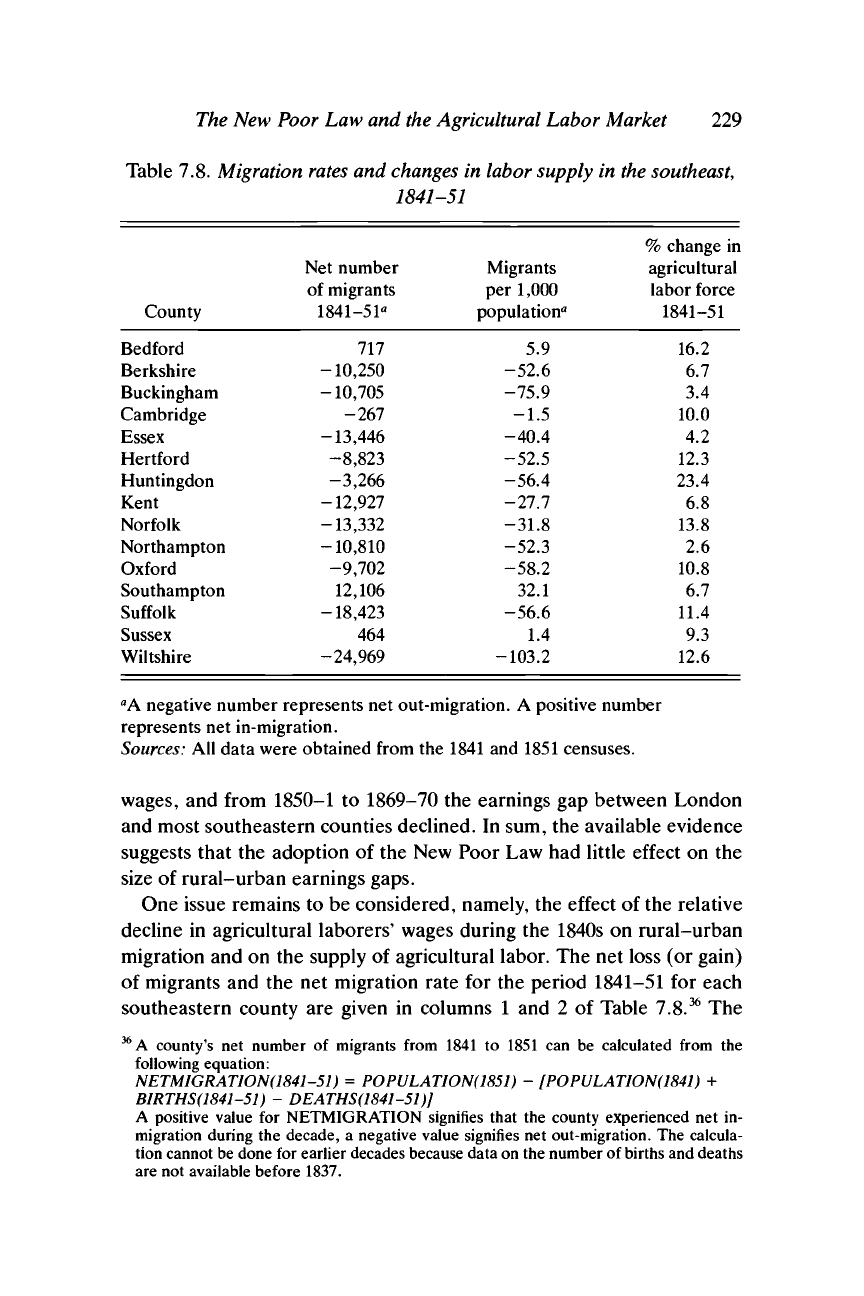
Table 7.8.
Migration rates
and
changes
in
labor
supply in
the
southeast,
1841-51
County
Bedford
Berkshire
Buckingham
Cambridge
Essex
Hertford
Huntingdon
Kent
Norfolk
Northampton
Oxford
Southampton
Suffolk
Sussex
Wiltshire
Net number
of migrants
1841-51°
717
-10,250
-10,705
-267
-13,446
-8,823
-3,266
-12,927
-13,332
-10,810
-9,702
12,106
-18,423
464
-24,969
Migrants
per 1,000
population*
5.9
-52.6
-75.9
-1.5
-40.4
-52.5
-56.4
-27.7
-31.8
-52.3
-58.2
32.1
-56.6
1.4
-103.2
% change in
agricultural
labor force
1841-51
16.2
6.7
3.4
10.0
4.2
12.3
23.4
6.8
13.8
2.6
10.8
6.7
11.4
9.3
12.6
fl
A negative number represents net out-migration. A positive number
represents net in-migration.
Sources:
All data were obtained from the 1841 and 1851 censuses.
wages, and from 1850-1 to 1869-70 the earnings gap between London
and most southeastern counties declined. In sum, the available evidence
suggests that the adoption of the New Poor Law had little effect on the
size of rural-urban earnings gaps.
One issue remains to be considered, namely, the effect of the relative
decline in agricultural laborers' wages during the 1840s on rural-urban
migration and on the supply of agricultural labor. The net loss (or gain)
of migrants and the net migration rate for the period 1841-51 for each
southeastern county are given in columns 1 and 2 of Table 7.8.
36
The
36
A county's net number of migrants from 1841 to 1851 can be calculated from the
following equation:
NETMIGRATION(1841-51)
=
POPULATION(1851)
-
[POPULATION(1841)
+
BIRTHS(1841-51)
-
DEATHS(1841-51)J
A positive value for NETMIGRATION signifies that the county experienced net in-
migration during the decade, a negative value signifies net out-migration. The calcula-
tion cannot be done for earlier decades because data on the number of births and deaths
are not available before 1837.
230
An
Economic History of the
English Poor
Law
total
net
out-migration from
the
southeast was 123,366 persons,
or
3.3%
of
the
average population
of the
southeastern counties during
the de-
cade.
37
The
out-migration rate was related
to the
rate
of
growth
of
farm
laborers' income.
The six
counties
in
which laborers' income either
de-
clined
or
increased
by
less than
4%
(Essex, Suffolk, Norfolk,
Cam-
bridge, Berkshire,
and
Wiltshire)
had a net
out-migration
of
47.7
per-
sons
per 1,000
population.
The
nine counties
in
which laborers' income
increased
by
more than 4%
had a net
out-migration
of
21.1
persons
per
1,000
population.
The
main destination
of
these migrants
was
London
(Hunt 1973: 281-4).
38
What effect
did
out-migration have
on the
supply
of
agricultural
la-
bor?
The
percentage change from 1841
to
1851
in the
number
of
adult
male agricultural laborers
in
each county
is
given
in
column
3 of
Table
7.8.
39
The southeast as a whole experienced
a
9.1%
increase in its agricul-
tural labor force from 1841
to
1851. Available price
and
output data
for
wheat suggest that
the
demand
for
farm labor declined during
the
1840s.
40
It is
therefore
no
wonder that farm laborers' earnings grew
slowly
or
declined during
the
decade. Assuming that
the
rural labor
market was
at or
near equilibrium
in
1841,
the
decline
in the
demand
for
37
The net out-migration rates in Table 7.8 are not comparable with Williamson's (1987)
estimates of gross out-migration rates presented above. Net out-migration equals gross
out-migration minus gross in-migration. The extent to which a county's net out-
migration rate understates its gross out-migration rate therefore depends on the extent
of gross in-migration to the county.
38
The importance of London as a destination for migrants from the rural south can be seen
by comparing data on the birthplaces of persons living in London in 1851 with birthplace
data for the major industrial region of England, the counties of Lancashire, Cheshire,
and the West Riding. Norfolk was not much farther from the West Riding than from
London, and yet there were only 2,008 Norfolk-born inhabitants of the West Riding in
1851 compared to 31,866 Norfolk-born Londoners. There were 2,627 Northampton-
born and 1,175 Oxford-born inhabitants of Lancashire, Cheshire, and the West Riding
compared to 10,511 and 16,092 inhabitants of London. According to E. H. Hunt
(1981:
157),
"London's attraction was probably due partly to accessibility - road and rail links
focused on the capital - and must have owed something also to the combination of
London's dominance in pre-industrial Britain and the tendency of migration streams to
perpetuate themselves. . . . Southern farm labourers and their offspring were in any
case unlikely to be particularly attracted by factory employment."
39
Occupational data in the 1841 census are given for ancient counties. In the 1851 census
data are given for registration counties. To adjust for differences in county boundaries, I
divided the number of agricultural laborers in 1851 by the ratio of the area of the
registration county to the area of the ancient county.
40
The price of wheat declined by 22.7% from 1838-42 to 1843-51 (Mitchell and Deane
1962:
488). Fairlie's (1969: 114) estimates of domestic wheat production suggest that
output was roughly constant from 1838 to 1844, increased in 1845 to a level 25% above
its 1838-44 level, then declined sharply after the repeal of the Corn Laws in 1846.
Annual wheat output in 1847-51 was 9% below output in 1838-44.
The New Poor Law and
the Agricultural
Labor Market 231
labor, combined with the increase in labor supply, resulted in a labor
surplus in rural parishes.
It was in the interest of farmers (and other parish taxpayers) to keep
the number of surplus laborers as small as possible. In terms of the
model developed in Chapter 3, farmers could encourage the out-
migration of surplus labor by setting the expected utility of the implicit
contract offered to workers, E(V), below workers' reservation level of
utility, V*, which was determined by wage rates in London. One could
argue that southeastern farmers deliberately chose not to increase the
value of their workers' contracts by enough to match the rapid increase
in London wage rates from 1846 to 1851, in order to encourage surplus
labor to migrate to London.
41
Of
course,
farmers would not have encour-
aged out-migration if they considered the sharp decline in grain prices in
1849-52 to be a temporary phenomenon. But many grain farmers must
have viewed the agricultural depression as the beginning of a long-term
decline in the profitability of grain farming caused by the repeal of the
Corn Laws in 1846. Such farmers would have been anxious to reduce the
number of farm laborers in their parishes. The fact that the supply of
farm labor increased by
9.1%
in the 1840s suggests that, from the stand-
point of southeastern farmers, the rate of out-migration was too low,
which implies that the utility value of the contracts that farmers offered
their laborers in the late 1840s was too high. Rather than use the threat
of the workhouse to reduce wages to subsistence, it appears that south-
eastern farmers offered their laborers contracts that were more generous
than necessary to retain an adequate labor force.
6. Conclusion
The New Poor Law altered the cost-minimizing form of grain-producing
farmers' implicit labor contracts, from one including seasonal layoffs
and poor relief for unemployed laborers to one of yearlong employ-
ment. The form of labor contracts changed because the substitution of
relief in workhouses for outdoor relief significantly increased the cost to
41
Sometimes parishes helped surplus laborers to migrate. From 1835 to 1837, East Anglia
sent 2,999 persons to the manufacturing districts of the northwest and 4,518 persons
overseas under the auspices of the Poor Law Commission's migration programs (Red-
ford 1964: 105-9). The 7,517 migrants from East Anglia represented 70% of the total
number of migrants relocated by the Poor Law Commission. Redford claimed that "the
local authorities in the agricultural counties" regarded these migration schemes "as an
outlet for the disposal of their most troublesome paupers" (1964: 115-6).
232 An Economic History of the
English Poor
Law
farmers of laying off unneeded workers in slack seasons. It is therefore
no wonder that many southeastern parishes ignored the Poor Law Com-
mission's directives and continued granting outdoor relief to seasonally
unemployed farm workers after 1834. The extent of this practice cannot
be measured, but Digby (1975: 71-4; 1978: 110-14) presents evidence
that it was widespread in East Anglia, especially after the number of
Poor Law inspectors was reduced from
21
to 9 in the mid-1840s.
Although the New Poor Law affected the form of rural labor con-
tracts,
the model developed in this chapter suggests that it should not
have affected farm laborers' living standards. Farmers anxious to retain
an adequate peak-season labor force had to offer laborers a contract that
yielded an expected utility equal to their reservation utility, which was
determined by wage rates in London and migration costs and therefore
was not affected by the New Poor Law. This conclusion runs strongly
counter to Snell's
(1985:
124) conclusion that the New Poor Law reduced
farm laborers' living standards by creating "conditions of dependence in
which precarious employment at low wages had to be accepted." Snell's
conclusion holds only if labor was immobile and therefore forced to
accept any contract that farmers offered. The available estimates of
migration rates show, however, that labor was very mobile from 1831 to
1851.
This chapter has presented several estimates of the change in farm
laborers' income from 1831-2 to 1850-1 in 15 southeastern counties.
The estimates differ in their assumptions concerning the changes in
unemployment rates and poor relief administration after 1834, but they
all yield the same conclusion: Farm laborers' income increased in the
majority of southeastern counties (9 to 12 out of 15, depending on the
assumptions), and nowhere declined by as much as
15%.
The best-guess
estimates in Table 7.7 suggest that laborers' income declined on average
by 1.5% in the 4 East Anglian counties and increased by 7.7% in the
other 11 counties. The earnings gap between London and most south-
eastern counties remained roughly constant from 1832 until the agricul-
tural depression of the late 1840s. In sum, the data support the model's
conclusion that farm laborers' income was not affected by the New
Poor Law.
8
THE ECONOMICS OF POOR
RELIEF IN INDUSTRIAL CITIES
The Royal Poor Law Commission viewed outdoor relief
as
a rural institu-
tion, and most historians, myself included, have focused their analyses
on poor relief in agricultural parishes. But outdoor relief also played an
important role in the manufacturing cities of northwest England.
1
Along
with industrialization came business cycles and the problem of how to
deal with cyclical fluctuations in the demand for industrial workers.
Manufacturers used the Poor Law as an unemployment insurance sys-
tem: Workers not needed during downturns were laid off or put on short
time,
and collected outdoor
relief.
Because a large share of the poor rate
was paid by non-labor-hiring taxpayers, by laying off workers manufac-
turers were able to pass some of their labor costs on to others during
downturns.
However, there was a problem with using the Poor Law as an unem-
ployment insurance system. Parishes were obliged to relieve only those
paupers who had their legal settlement in the parish. In the first half of
the nineteenth century, 50% or more of the work force in most industrial
cities had been born, and were legally settled, elsewhere. Industrial
cities not only were under no obligation to relieve nonsettled workers,
they had the right to send any nonsettled applicants for relief back to
their parish of settlement. A city's policy concerning whether to remove
or relieve nonsettled able-bodied applicants depended in part on the
political power of its manufacturers. Manufacturers supported granting
relief to nonsettled workers during downturns, to ensure that an ade-
quate work force would be available upon the return of prosperity. Non-
1
The major works on the economic role of poor relief in the industrial northwest during
the first half of the nineteenth century are by Michael Rose (1965; 1966; 1970; 1976) and
David Ashforth (1976; 1979; 1985). Rose's (1965) unpublished dissertation on poor relief
in the West Riding is especially valuable. See also Midwinter (1969), Redford (1964), and
Edsall (1971).
233
234
An
Economic History of the
English Poor
Law
labor-hiring taxpayers were more anxious
to
remove nonsettled appli-
cants
in
order
to
reduce their relief expenditures.
All
urban taxpayers
agreed, however, that
the
power
of
removal
was an
important weapon
that should
not be
surrendered, because
it
enabled cities
to
reduce their
expenditures
on
persons, such as widows
or
handloom weavers, likely
to
be long-term recipients
of relief.
The purpose
of
this chapter
is to
outline
the
economic role played
by
outdoor relief
in the
textile-producing cities
of
Lancashire
and the
West
Riding
of
Yorkshire.
I
focus
on
manufacturers'
use of the
Poor
Law as
an unemployment insurance system,
and on
cities' selective
use of the
power
of
removal
to
manipulate
the
size
and
structure
of the
urban
labor force.
No
distinction
is
made between pre-1834
and
post-1834
relief administration because most historians agree that industrial cities
continued using outdoor relief
for at
least
two
decades after 1834.
2
I
conclude that
in the
absence
of
outdoor relief
and the
power
of re-
moval, manufacturers' profit rates would have been significantly lower.
The existence
of
unemployment insurance,
in the
form
of
outdoor
relief,
enabled manufacturers
to use
layoffs
to
shift some
of
their labor
costs
to
non-labor-hiring taxpayers, while
the
power
of
removal
en-
abled urban taxpayers
in
general
to
pass some
of the
cost
of
relieving
nonsettled paupers
to
their (generally rural) parishes
of
settlement
and
to
the
paupers themselves.
1.
The
Economic Role
of
Poor Relief
in
Industrial Areas
Industrial cities
did not
face large seasonal fluctuations
in
labor require-
ments,
but
they
did
have
to
contend with fluctuations
in
demand caused
by
the
trade cycle.
3
The
early-nineteenth-century trade cycle
was to a
large extent driven
by
fluctuations
in the
demand
for
exports
and
there-
fore
was
especially pronounced
in the
textile-producing cities
of the
northwest.
The
cyclical behavior
of the
Lancashire cotton industry
and
the Yorkshire woollen industry were similar (Matthews 1954: 152).
Dur-
ing
the
period from 1819
to
1850, major downturns
in
trade occurred
in
1826,
1839,
1841-2,
and
1847-8, while minor downturns occurred
in
2
See,
for
example, Rose (1966; 1970), Ashforth (1976),
and
Hunt
(1981:
136-7).
3
This
is
not to
say that seasonality
did not
exist
in
industrial
cities.
The demand
for
labor in
the building trades
was
seasonal,
as was the
demand
for
dressmakers, shirtmakers,
and
other female-dominated occupations (Jones 1971:
33-51;
Treble 1979: 72-80).
But sea-
sonality was more
of a
problem
in
London
and in
port cities than
in the
textile-producing
cities
in the
northwest (Jones
1971:
34).
Poor Relief
in
Industrial
Cities
235
Table 8.1. Unemployment and short time in Manchester cotton mills,
1848
Month
January
February
March
April
May
June
Average
Number
of
workers
28,193
28,278
28,145
28,262
28,316
28,163
28,226
fully
employed
79.0
76.9
71.1
63.7
69.0
71.6
71.9
working
short time
3.0
4.4
8.7
16.8
12.8
11.1
9.5
%
unemployed
18.0
18.7
20.2
19.5
18.2
17.3
18.6
Source:
The Economist, weekly issues from January
8,
1848, through July
1,
1848.
1829,
1832, and 1837 (Gayer, Rostow, and Schwartz 1953: 688, 692;
Matthews 1954: 127-44).
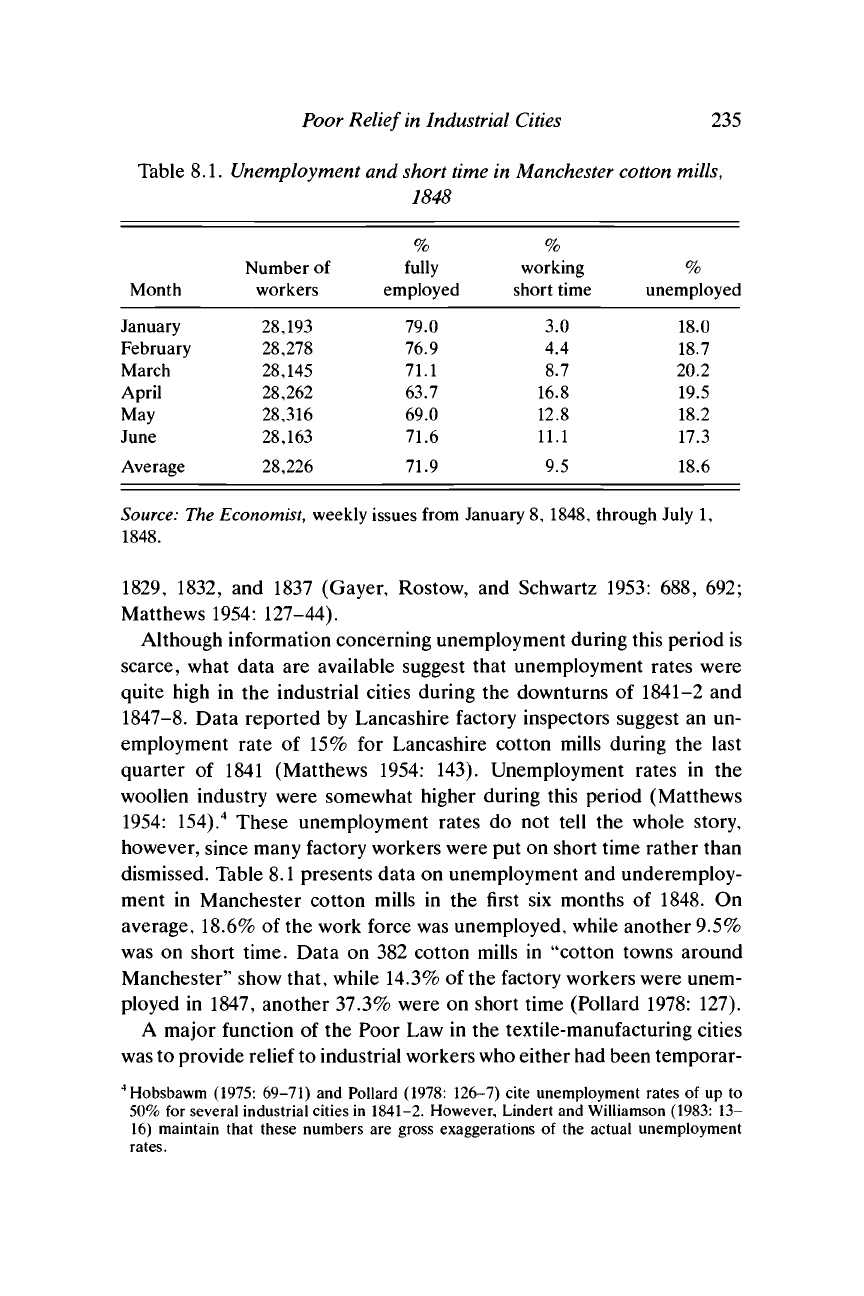
Although information concerning unemployment during this period is
scarce, what data are available suggest that unemployment rates were
quite high in the industrial cities during the downturns of 1841-2 and
1847-8.
Data reported by Lancashire factory inspectors suggest an un-
employment rate of 15% for Lancashire cotton mills during the last
quarter of 1841 (Matthews 1954: 143). Unemployment rates in the
woollen industry were somewhat higher during this period (Matthews
1954:
154).
4
These unemployment rates do not tell the whole story,
however, since many factory workers were put on short time rather than
dismissed. Table 8.1 presents data on unemployment and underemploy-
ment in Manchester cotton mills in the first six months of 1848. On
average, 18.6% of the work force was unemployed, while another 9.5%
was on short time. Data on 382 cotton mills in "cotton towns around
Manchester" show that, while 14.3% of the factory workers were unem-
ployed in 1847, another 37.3% were on short time (Pollard 1978: 127).
A major function of the Poor Law in the textile-manufacturing cities
was to provide relief to industrial workers who either had been temporar-
4
Hobsbawm (1975: 69-71)
and
Pollard (1978: 126-7) cite unemployment rates
of up to
50%
for
several industrial cities
in
1841-2. However, Lindert
and
Williamson
(1983:
13-
16) maintain that these numbers
are
gross exaggerations
of the
actual unemployment
rates.
236
An Economic History of the
English
Poor Law
Table 8.2. Number of adult
able-bodied
men
relieved
in
Lancashire
and
the
West
Riding,
1839-45
Quarter ended
Lady Day
Number relieved on account of
Want of work
Insufficiency of earnings
Total
Lancashire
1839
1840
1841
1842
1843
1844
1845
West Riding
1839
1840
1841
1842
1843
1844
1845
304
883
978
3,841
5,213
2,031
1,041
230
2,967
2,528
4,090
7,674
1,943
810
1,461
2,632
2,904
4,597
5,058
3,416
2,402
539
838
1,118
1,993
2,222
979
717
1,765
3,515
3,882
8,438
10,271
5,447
3,443
769
3,805
3,646
6,083
9,896
2,922
1,527
Source:
Sixth through twelfth annual reports of the Poor Law Commissioners.
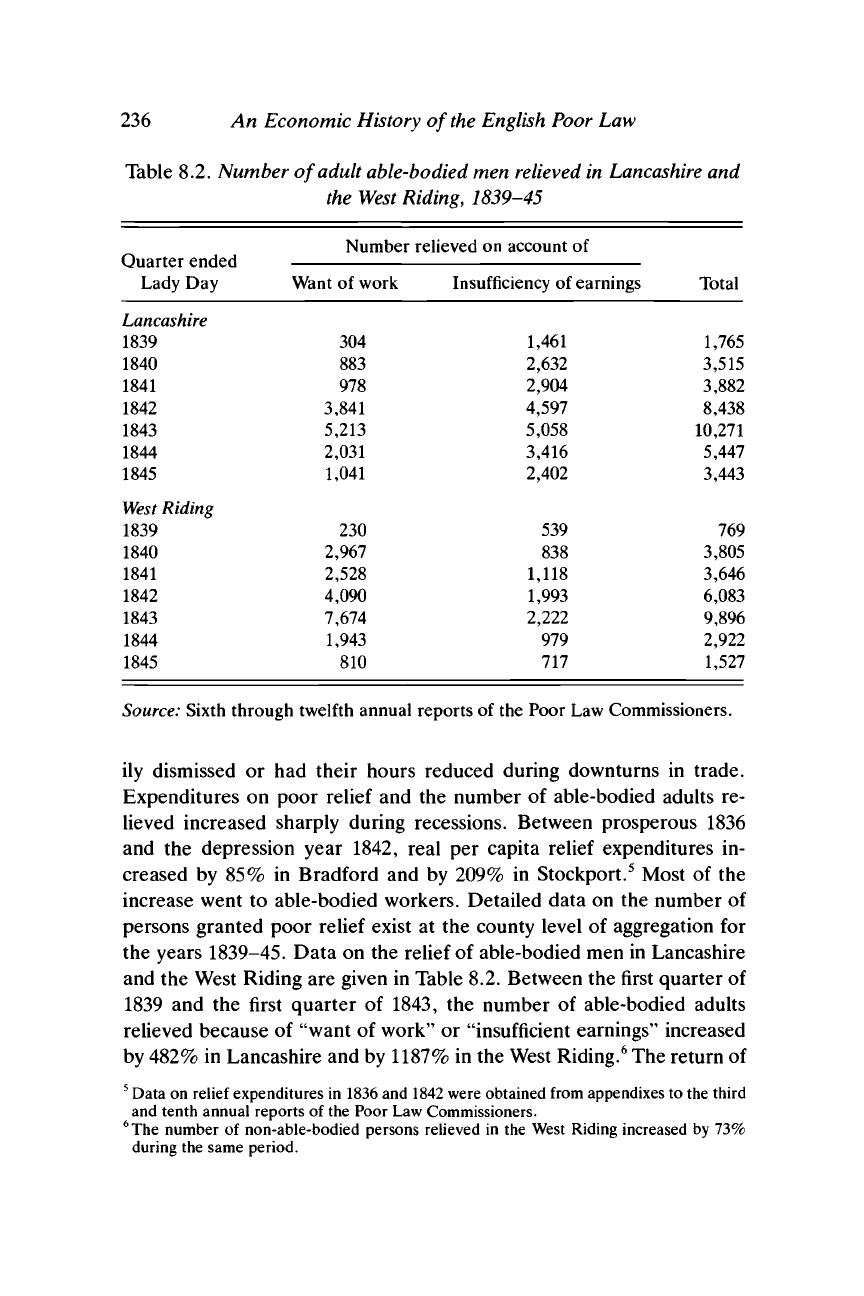
ily dismissed or had their hours reduced during downturns in trade.
Expenditures on poor relief and the number of able-bodied adults re-
lieved increased sharply during recessions. Between prosperous 1836
and the depression year 1842, real per capita relief expenditures in-
creased by 85% in Bradford and by 209% in Stockport.
5
Most of the
increase went to able-bodied workers. Detailed data on the number of
persons granted poor relief exist at the county level of aggregation for
the years 1839-45. Data on the relief of able-bodied men in Lancashire
and the West Riding are given in Table 8.2. Between the first quarter of
1839 and the first quarter of 1843, the number of able-bodied adults
relieved because of "want of work" or "insufficient earnings" increased
by 482% in Lancashire and by 1187% in the West Riding.
6
The return of
5
Data on relief expenditures in 1836 and 1842 were obtained from appendixes to the third
and tenth annual reports of the Poor Law Commissioners.
6
The
number of non-able-bodied persons relieved in the West Riding increased by 73%
during the same period.