Boyer George R. An Economic History of the English Poor Law, 1750-1850
Подождите немного. Документ загружается.

The Poor
Law,
Migration,
and Economic Growth
187
3.
The Effect of Poor Relief on Migration: Model Three
The results obtained in Section 2 show that the payment of poor relief to
agricultural laborers had
a
trivial negative impact on labor mobility and
national income.
I
contend that these estimates represent
an
upper-
bound measure
of
the loss
in
national income caused by the Poor Law.
The Polanyi model assumes that farmers' labor costs were unaffected by
the Poor Law. Because wage income and poor relief were substitutes,
farmers were able
to
reduce wage rates
by an
amount equal
to
their
contribution to the poor rate. The model assumes that farmers' expendi-
tures per worker equaled labor's marginal product. However,
if
labor-
hiring farmers dominated parish politics, they could have used the Poor
Law
to
reduce their expenditures per worker below the marginal prod-
uct
of
labor. The third model assumes that the system
of
outdoor relief
enabled farmers
to
reduce their labor costs and therefore caused farm-
ers'
profits
to
increase. The resulting increase
in
capital accumulation
had
a
positive effect on economic growth.
The model
is
similar
to the
implicit contracts model developed
in
Chapter 3, except that income
is
substituted
for
utility
in
the farmer's
constraint. To retain
an
adequate peak-season labor force, farmers had
to offer workers
an
implicit contract consisting
of
wage payments and
poor relief that yielded an income equal to workers' reservation income
R,
determined by wage rates and disamenities
in
London, and the cost
of migration. That is,
R = W
+ B
= W
+
eB
+
(1
-
e)B
Farmers' labor costs are equal
to
W
+
eB =
R -
(1
-
e)B
Farmers' expenditures per worker are reduced by an amount (1
-
e)2?
below workers' reservation income, where (1
-
e)B
is
the per-worker
relief contribution
of
non-labor-hiring taxpayers. Note that
if
workers'
reservation income equals the marginal product of labor plus the contri-
bution of non-labor-hiring taxpayers to the relief fund (that is, if R =
R
r
= MP
e
+
(1
-
e)B), then
W +
eB = MP
e
and this model is the same
as
the Polanyi model developed
in
Section 2. But this
is a
special case.
If
workers' reservation income is less than MP
e
+
(\-e)B
then
R-
(l-e)B
=
W+ eB<MP
f
188 An Economic History of
the
English Poor Law
So long as R < MP
e
+ (1 - e)B, farmers' expenditures per worker were
less than the marginal product of labor, and the Poor Law increased
farmers' profits.
17
Suppose that workers' reservation income was equal to the marginal
product of labor.
18
Then farmers' payments to workers were below the
marginal product of labor by precisely the contribution to the poor rate
of taxpayers who did not hire labor; that is,
W + eB = MP
e
- (1 - e)B
If R was equal to the marginal product of labor, the system of poor relief
had no effect on migration; relief replaced laborers' wage income one-
for-one. On the other hand, the transfer of income from taxpayers who
did not hire labor to labor-hiring farmers should have had a positive
effect on economic growth. Non-labor-hiring taxpayers consisted mainly
of artisans, shopkeepers, and family farmers, whose incomes were sig-
nificantly below those of labor-hiring farmers. The Poor Law (ironically)
transferred income from low- to high-income individuals and therefore
might have increased savings. The reduction in farmers' labor costs
should have increased the demand for land, causing rents to increase.
Thus some of the gain to farmers was passed on to (wealthier) land-
lords.
19
The income transfer should have led to increased capital forma-
tion in agriculture or increased investment outside of agriculture.
Three estimates of the size of the income transfer are given in Table
17
Profit-maximizing farmers would never offer workers
a
contract that yielded
an
income
greater than
R' = MP
t
+ (1 - e)B,
because under such
a
contract their expenditures per
worker would
be
greater than
the
marginal product
of
labor.
If
workers' reservation
income
was
greater than
/?',
there would
be
out-migration, which would increase
the
marginal product
of
labor
in the
parish
and
thus increase
/?'.
Out-migration would
continue until
R' = R. If
the value
of
a
worker's implicit contract never exceeded
R\ the
Polanyi model gives
an
upper-bound measure
of the
effect
of
poor relief
on
labor
mobility.
18
This amounts
to
assuming that migration costs, rural-urban differences
in
labor quality,
the employment uncertainty
in
urban areas,
and the
urban disamenities premium were
large enough
to
account
for the
entire rural-urban wage gap,
so
that
the
regional labor
market was
in
equilibrium.
19
The suggestion that landlords might have benefited from
the
Poor
Law
runs sharply
counter to the traditional hypothesis that farmers shifted part of their poor relief expendi-
tures
to
landlords. However,
the
assumption that landlords lowered rents
in
response
to
high poor rates makes sense only
if the
payment
of
poor rates reduced farmers' profits
below "normal" levels.
If the
Poor
Law had no
effect
on
farmers' profits,
as in the
Polanyi model,
it
should have
had no
effect
on the
rental price
of
land.
If
the Poor Law
caused profits
to
increase,
the
rental price
of
land also should have increased.
On the
other hand, farmers might have been able
to
convince absentee landlords that produc-
tion costs were positively correlated with relief expenditures even
if
they were
not.
The Poor Law, Migration, and Economic Growth
189
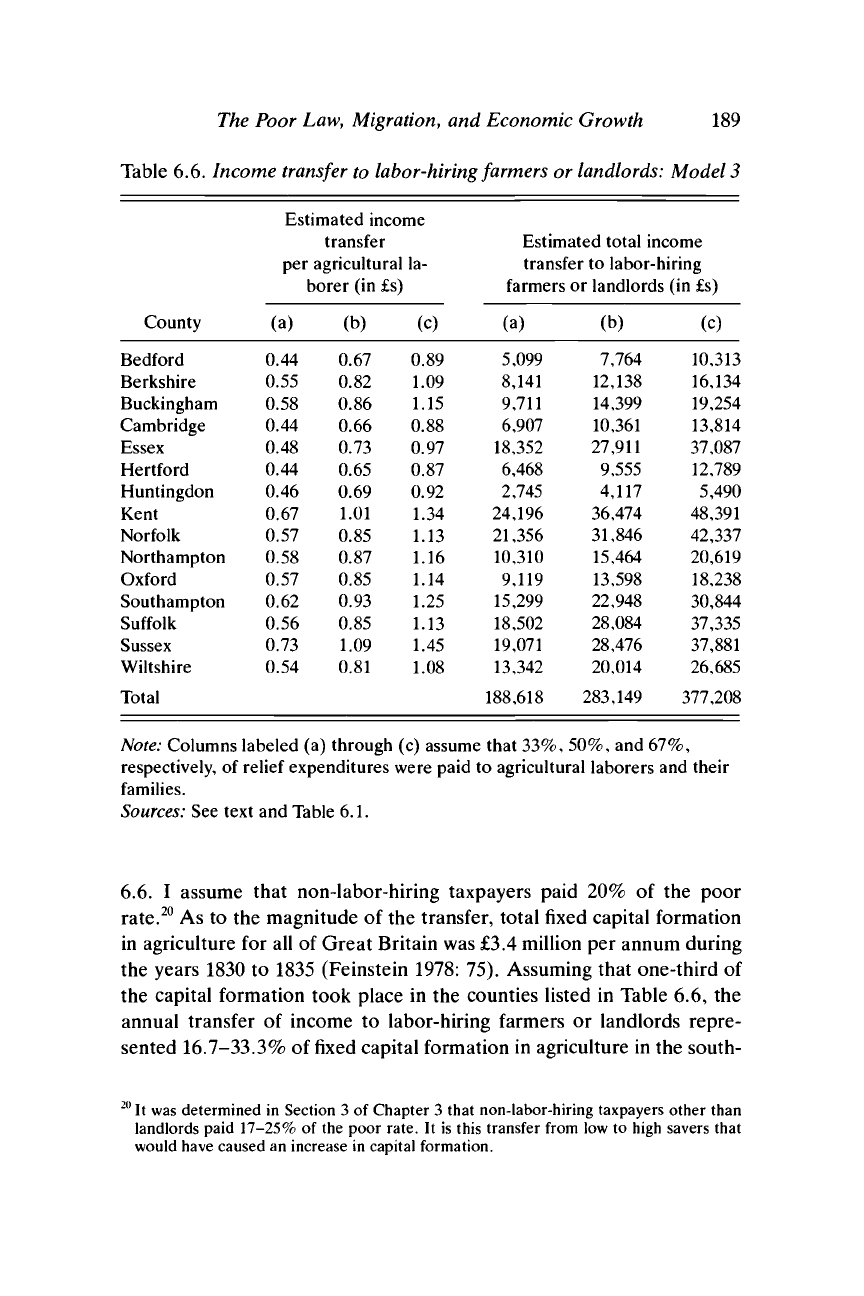
Table 6.6. Income
transfer
to
labor-hiring farmers
or
landlords:
Model 3
County
Bedford
Berkshire
Buckingham
Cambridge
Essex
Hertford
Huntingdon
Kent
Norfolk
Northampton
Oxford
Southampton
Suffolk
Sussex
Wiltshire
Total
Estimated income
per
transfer
agricultural
la-
borer
(in £s)
(a)
0.44
0.55
0.58
0.44
0.48
0.44
0.46
0.67
0.57
0.58
0.57
0.62
0.56
0.73
0.54
(b)
(c)
0.67
0.89
0.82
1
0.86
1
1.09
1.15
0.66
0.88
0.73
0.97
0.65
0.87
0.69
0.92
1.01 1
0.85
1
0.87
1
0.85
1
0.93
1
0.85
1
1.09
]
0.81
1
L34
1.13
L.16
1.14
L25
L.13
1.45
L08
Estimated total income
transfer
to
labor-hiring
farmers
(a)
5,099
8,141
9,711
6,907
18,352
6,468
2,745
24,196
21,356
10,310
9,119
15,299
18,502
19,071
13,342
188,618
or landlords
(b)
7,764
12,138
14,399
10,361
27,911
9,555
4,117
36,474
31,846
15,464
13,598
22,948
28,084
28,476
20,014
283,149
(in £s)
(c)
10,313
16,134
19,254
13,814
37,087
12,789
5,490
48,391
42,337
20,619
18,238
30,844
37,335
37,881
26,685
377,208
Note: Columns labeled
(a)
through
(c)
assume that 33%, 50%,
and
67%,
respectively,
of
relief expenditures were paid
to
agricultural laborers
and
their
families.
Sources:
See
text
and
Table 6.1.
6.6. I assume that non-labor-hiring taxpayers paid 20% of the poor
rate.
20
As to the magnitude of the transfer, total fixed capital formation
in agriculture for all of Great Britain was £3.4 million per annum during
the years 1830 to 1835 (Feinstein 1978: 75). Assuming that one-third of
the capital formation took place in the counties listed in Table 6.6, the
annual transfer of income to labor-hiring farmers or landlords repre-
sented 16.7-33.3% of fixed capital formation in agriculture in the south-
20
It
was determined
in
Section
3 of
Chapter 3 that non-labor-hiring taxpayers other than
landlords paid 17-25%
of
the poor rate.
It
is
this transfer from low
to
high savers that
would have caused
an
increase
in
capital formation.
190 An Economic History of
the
English Poor Law
east of England.
21
Of course, the actual increase in investment depends
on the difference in savings rates among non-labor-hiring taxpayers,
labor-hiring farmers, and landlords. Although it is not possible to mea-
sure precisely group-specific savings rates, what data are available sug-
gest there were large differences in savings rates across income classes.
Crafts (1985: 124-5) conjectures that the "savings rate from agricultural
rent and profits" was as high as 30% in the 1820s. The savings rate of
non-labor-hiring taxpayers (i.e., family farmers, artisans, and shopkeep-
ers) was much lower, perhaps 5%.
22
Assuming these are reasonable
estimates of the group-specific savings rates, the income transfer from
non-labor-hiring taxpayers to labor-hiring farmers and landlords led to
an annual increase in savings (and investment) of £47,200-£94,300, or
4.2-8.4% of fixed capital formation in agriculture. If the average savings
rate of non-labor-hiring taxpayers was 10%, the income transfer to
labor-hiring farmers and landlords led to an annual increase in savings of
£37,700-£75,400. Thus, the Poor Law might have played a role (albeit a
small one) in funding the agricultural improvements of the first third of
the nineteenth century.
The results in Table 6.6 hold if workers' reservation income was equal
to the marginal product of labor. If MP
(
< R < MP
(
+ (1 - e)B, the
Poor Law both slowed migration and increased farmers' profits. Migra-
tion declined because rural workers' income was greater than the mar-
ginal product of labor, and farmers' profits increased because their ex-
penditures per worker were less than the marginal product of labor. In
effect, farmers and workers shared the contribution of non-labor-hiring
taxpayers to the poor rate. Part of it went to farmers, raising profits
above "normal" levels, and part went to workers, raising wages above
the marginal product of labor. The effect of poor relief on rural-urban
wage gaps (and hence on migration) was smaller than that given in
Tables 6.3-6.5, because those tables assume that R = MP
(
+ (1 - e)B.
21
In 1831, the 15 southeastern counties included in Table 6.6 contained about 27% of the
adult male agricultural laborers in Great Britain. My assumption that 33% of capital
formation in agriculture took place in these counties is meant to yield a lower-bound
estimate for the ratio of the income subsidy received by farmers to the amount of fixed
capital formation.
22
My conjecture of a 5% savings rate is based on the assumption that the average income
of family farmers, artisans, and shopkeepers was too small to enable much saving.
Evidence to support this assumption can be obtained from Appendix D of the 1834 Poor
Law Report (on labor rates), which contains large numbers of complaints from non-
labor-hiring taxpayers that they cannot afford to pay the extra taxes associated with the
use of labor rates (Pad. Papers 1834: XXXVIII).
The Poor
Law,
Migration,
and
Economic Growth
191
Similarly,
the
effect
on
farmers' profits
or
landlords' rental income
(and
hence
on
savings)
was
smaller than that given
in
Table
6.6,
which
as-
sumes that
R = M?
(
P
The above bounds
on the
value
of R
were
set for the
following
rea-
sons:
Farmers would never offer workers
a
contract yielding
an
income
larger than
MP
(
+ (1 - e)B
because that would mean their expenditures
per worker
(W + eB)
were larger than
the
marginal product
of
labor.
Similarly, workers would never
set
their reservation wage below
the
marginal product
of
labor because
the
marginal product represented
their opportunity income
in
neighboring agricultural parishes.
The value
of R was
determined
by
wage rates
in
London, workers'
valuation
of
urban disamenities,
and the
cost
of
migration. Real wages
of London builders' laborers increased by
30%
from 1800-14
to
1826-34
(Schwarz
1986:
40-1).
The
increase
in
London wages increased farm
workers' reservation income, both absolutely
and
relative
to the mar-
ginal product
of
labor
in
agriculture.
24
Therefore,
the
effect
of
poor
relief
on
migration (farmers' profits)
was
likely
to
have increased
(de-
creased) over time. Perhaps
the
results
in
Table
6.6
represent
an
accu-
rate measure
of the
effect
of
poor relief
in
1800-14
and the
results
in
Tables
6.3, 6.4, and 6.5 are an
accurate measure
of the
effect
of
poor
relief
in
1826-34.
If so, the
average annual effect
of
poor relief
on
migration from 1795
to
1834 was trivial.
4.
Conclusion
The analysis presented
in
this chapter
has
reached some surprising conclu-
sions,
which suggest that
the
traditional interpretation
of
the Poor Law's
effect
on
economic growth needs
to be
revised.
The
hypothesis that
the
payment
of
poor relief
to
able-bodied agricultural laborers significantly
slowed rural-urban migration
(and
hence economic growth)
is not sup-
ported
by the
evidence. Even
if all
relief benefits paid
to
able-bodied
workers were
in
excess
of
the marginal product
of
labor (model one),
the
loss
in
national income caused
by the
Poor Law was small. However,
the
results obtained from
the
first model overstate
the
impact
of
poor relief
23
If R = MP,, the entire contribution of non-labor-hiring taxpayers went to farmers, while
if R = MP
f
+ (1 - e)B the entire contribution went to workers.
24
There is no evidence of a comparable increase in the marginal product of agricultural
labor. Wheat yields increased by 7% from 1815-19 to 1826-34 (Healy and Jones 1962:
578).
No data on wheat yields exist for 1800-14. The price of wheat declined by 35%
from 1800-14 to 1826-34 (Mitchell and Deane 1962: 488).
192 An Economic History of the English Poor Law
because they assume that farmers' expenditures per worker exceeded the
marginal product of labor. If profit-maximizing farmers used poor relief
to raise workers' income without increasing their labor
costs
(model two),
or to reduce their labor costs below the marginal product of labor (model
three),
the Poor Law at worst had little effect on the economy and at best
stimulated growth by increasing the profit rates of labor-hiring farmers or
the rental income of landlords.
25
25
The idea that the Poor Law "may have had some overall positive effects on the Industrial
Revolution" was recently suggested by Joel Mokyr (1985b: 14). The results of this
chapter and Chapter 8 support some of Mokyr's hypotheses.
7
THE NEW POOR LAW AND THE
AGRICULTURAL LABOR MARKET,
1834-1850
The debate over the economic impact of the Old Poor Law on the
agricultural labor market has been paralleled by a debate over the eco-
nomic consequences of the Poor Law Amendment Act. However, al-
though the issues to be explained are similar, the number of participants
in the latter debate has been surprisingly small. The purpose of this
chapter is to determine how farmers and laborers responded to the
abolition of outdoor relief in 1834.
The traditional literature maintained that the system of outdoor relief
reduced laborers' wages and farmers' profits in the long run, and that its
abolition raised laborers' living standards. According to the 1834 Report
of the Royal Poor Law Commission, the system of outdoor relief en-
abled farmers "to reduce wages to the minimum, or even below the
minimum of what would support an unmarried man," but it also reduced
labor's productivity by so much that "the farmer finds that pauper la-
bour is dear, whatever be its price" (Royal Commission 1834: 59, 71).
The report predicted that the abolition of outdoor relief would eliminate
unemployment, increase labor productivity, increase "the return to the
farmers' capital[, and thus] induce the capitalist to give better wages"
(1834:
329).
My conclusion that outdoor relief did not have a negative effect on
farmers' profits or laborers' living standards implies that the traditional
analysis of the economic impact of the Poor Law Amendment Act needs
to be revised. The abolition of outdoor relief
did
not have
a
positive effect
on living standards. The question that remains to be answered
is
whether
it had a negative effect on living standards, or whether implicit labor
contracts were altered in such a way that agricultural laborers' annual
income was unaffected by the change in relief administration. K. D. M.
Snell (1985) has recently argued that southern agricultural laborers ex-
perienced a large decline in income as a result of the New Poor Law. His
193
194 An Economic History of
the
English Poor Law
conclusion is based on the assumption that labor was immobile and there-
fore forced to accept any implicit contract offered by farmers. If labor was
mobile, and evidence shows that it was, the New Poor Law should not
have affected workers' income. On the other hand, the form in which
labor was compensated should have changed, since the new law disal-
lowed the dominant implicit labor contract in grain-producing areas.
The chapter proceeds as follows: Section 1 discusses the reasons why
the Poor Law was reformed in 1834. Historians' conclusions concerning
the effect of the New Poor Law on the agricultural labor market are
summarized in Section 2. Section 3 considers the effect of Poor Law
reform on the dominant form of implicit labor contracts in grain-
producing areas. In Section 4, I offer estimates of the change in real
income of southern agricultural laborers from 1832 to 1850. Rural-
urban migration and changes in the earnings gaps between London and
southern agricultural counties from 1834 to 1850 are discussed in Sec-
tion 5.
1.
The
Revision
of
the Poor
Law
The process of revising the Poor Law was set in motion in February 1832
when the Royal Commission to Investigate the Poor Laws was formed
by the government. Its purpose was "to make a diligent and full inquiry
into the practical operation of the laws for the relief of the poor . . . and
into the manner in which those laws are administered; and to report
whether any and what alterations, amendments, or improvements may
be beneficially made in the said laws, or in the manner of administering
them, and how the same may be best carried into effect" (Royal Commis-
sion 1834: 1). The commission published a 360-page report in March
1834,
followed by several volumes of evidence. A bill for the amend-
ment of the Poor Law was introduced in the House of Commons in
April, and the Poor Law Amendment Act became law on August 14,
1834.
The bill encountered little opposition in Parliament. The Webbs
(1929:
94) maintained that "there can scarcely have been, during the
past hundred years, a measure of first-class social importance, gravely
affecting the immediate interests of so large a number of people, that
aroused, in its passage through both Houses of Parliament, so little
effective opposition, and even so little competent discussion, as the Poor
Law Amendment Bill."
Before turning to the effect of the New Poor Law on the agricultural
The New Poor Law and
the Agricultural
Labor Market 195
labor market, we need to confront two related
issues:
Why was
the Royal
Commission formed in 1832, and why was the Poor Law amended? After
all,
the analysis of the previous chapters suggests that the politically domi-
nant groups in many agricultural parishes found outdoor relief to be part
of
a
cost-minimizing labor contract. There were changes in the economic
environment between 1815 and 1832, but none important enough to alter
the general form of the optimal labor contract.
In fact, there is plenty of evidence in the reports of the assistant Poor
Law commissioners that grain-producing farmers did not support the
abolition of outdoor
relief.
For instance, Assistant Commissioner Pringle
wrote that farmers were "averse to any measures that would render the
labourer independent of parish assistance, which, by keeping him to its
confines, retains him always at their command when wanted for urgent
work," and Assistant Commissioner Cowell concluded that "farmers find
that labour is cheaper to them when the labourers are paid partly by the
rates and partly by wages, and therefore they will not permit the allow-
ance system to be superceded" (Pad. Papers
1834:
XXVIII, 297,595-6).
l
Even the Royal Commission's Report (1834: 59) admitted that "employ-
ers of paupers are attached to a system which enables them to dismiss and
resume their labourers according to their daily or even hourly want of
them, to reduce wages . . . , and to throw upon others the payment of a
part ... of the wages actually received by their labourers." Polanyi
(1944:
298-9) concluded that "by 1833 the farming community was stol-
idly in favor of retaining Speenhamland."
The key to understanding the amendment of the Poor Law is the
makeup of Parliament. The major beneficiaries from the system of out-
door
relief,
labor-hiring farmers, were not well represented in Parlia-
ment, which was dominated by large landowners, whose knowledge of
the administration of poor relief at the parish level was limited. Land-
owners had a personal interest in relief administration only to the extent
that it affected their rental income.
Historians have given two major reasons for the formation of the
Royal Poor Law Commission: fear of rising poor rates, and the agricul-
tural laborers' revolt of
1830-1.
2
The hypothesis that the system of
1
Other evidence in the assistant commissioners' reports that labor-hiring farmers sup-
ported continuing the system of outdoor relief can be found in Pad. Papers (1834:
XXVIII, 208, 209, 232, 300, 307, 335, 344, 594).
2
The
reform of the Poor Law was not brought about by a change in the composition of
Parliament. The Royal Poor Law Commission was formed four months before the pas-
sage of the Reform Act in June 1832. The Poor Law Amendment Act was adopted by the
196 An Economic History of
the
English Poor Law
outdoor relief caused poor relief expenditures to increase over time
became popular after the Napoleonic Wars. The 1817 House of Com-
mons Select Committee on the Poor Laws concluded that "unless some
efficacious check be interposed, there is every reason to think that the
amount of the [poor rate] assessment will continue as it has done, to
increase, till ... it shall have absorbed the profits of the property on
which the rate may have been assessed, producing thereby the neglect
and ruin of the land" (Pad. Papers 1817: VI, 8). Similarly, David Ri-
cardo
(1821:
106) concluded that "whilst the present laws are in force, it
is quite in the natural order of things that the fund for the maintenance
of the poor should progressively increase, till it has absorbed all the net
revenue of the country."
The trend in relief expenditures from 1817 through 1832, the year the
Royal Commission was appointed, is given in Table 7.1. Three time
series are presented: nominal expenditures, real expenditures, and per
capita real expenditures. The trend in expenditures differs across the
three series. Nominal relief expenditures were 14% lower in 1832 than
in 1817, whereas per capita real expenditures were virtually the same in
1817 and 1832. One could argue, however, that landowners concerned
about falling profit and rental rates were most interested in the trend in
real relief expenditures, and this was upward.
3
Real expenditures in-
creased by 23% from 1817 to 1832. Landowners might have interpreted
the trend in real relief expenditures as support for the 1817 committee's
hypothesis, and therefore put pressure on the government to come up
with a plan to amend the Poor Law in order to reduce expenditures.
The fear of continuously increasing poor rates probably was not
strong enough by itself to cause the government to take action in 1832.
The catalyst for Poor Law reform was the agricultural laborers' uprising
of
1830-1,
the so-called Captain Swing riots. The disturbances consisted
mainly of threshing-machine breaking, arson, and wage riots (Hobs-
reformed Parliament,
but
Parliament continued
to be
dominated by large landowners
for
several decades after 1832. According
to
Evans
(1983:
41),
"between 70
and
80
per
cent
[of
the MPs
elected
in
December 1832] represented
the
landed interest.
. . . Not
more
than
one
hundred members
[out of 658]
were bankers, merchants
or
manufacturers.
Many pre-1832 parliaments
had
returned similar numbers
of
the professional
and
indus-
trial middle classes." Clearly,
the
Poor
Law
Amendment
Act
would
not
have been
adopted without
the
support
of
the landed interest.
3
The
amount
of
land that was taxed remained roughly constant from 1817
to
1832, so that
any increase
in
real expenditures meant
an
increase
in the
real
tax
rate. Landowners
concerned about rental income should have been indifferent between
an
increase
in the
poor rate caused
by
rising
per
capita expenditures (with population constant)
and an
equal increase caused
by
population growth (with
per
capita expenditures constant).