Bednorz W. (ed.) Advances in Greedy Algorithms
Подождите немного. Документ загружается.

A Multi-start Local Search Approach to the Multiple Container Loading Problem
61
determine the initial solution and the next solution in the neighborhood. The move strategy
of this local search is first admissible move strategy as shown by this algorithm.
4. Computational experiments
4.1 Configuration
The tested method of multi-start local search procedure is shown below. At first phase, only
one rule is required. The following rules are used to decide an initial solution of
.
(R1) Sorting in decreasing order of the box volume v
i
, i ∈ P.
(R2) Sorting in decreasing order of the box value c
i
, i ∈ P.
These rules are used properly by problem type. If the object of the problem is to maximize
the volume utilization, the rule R1 is used, and if the object of the problem is to maximize
the total value of the loaded boxes, the rule R2 is used. Therefore the initial solution of box
sequence is all same at any j, j = 1,..., msn.
Another initial solution of
, which is the order of orientation for each box
of type i are selected using a random function initialized random seed rs
j
. The random
function used here is linear congruential method.
The static parameter overhang ratio γ
is important factor as shown by Takahara (Takahara,
2006). However, γ is fixed here for the simplification.
In order to show the effectiveness of the approach above described, the test cases from the
literature were taken. Three kinds of test cases, that is the bin packing type multiple
container loading problem with one container type, the bin packing type multiple container
loading problem with different container type and the knapsack type multiple container
loading problem, are taken.
As the bin packing type multiple container loading problem with one container type, the 47
examples of Ivancic et al. (Ivancic et al., 1989) are used here. The objective of the problems of
Ivancic et al. is to find a minimal number of required containers load all given boxes. Each
problem consists of two to five box types where only one container type is available. The
problems of Ivancic et al. are denoted by IMM01 to IMM47.
As the bin packing type multiple container loading problem with different container type,
the 17 examples of Ivancic et al. (Ivancic et al., 1989) are used here. The objective of these
problems is to find the arrangement to maximize the volume utilization to load all given
boxes. The problems of these are denoted by IMM2-01 to IMM2-17.
In these two bin packing type problems, the constant numbers are
α
= 1 and β = 0 in the
criterion (3) and the rule R1 is used to determine the initial solution of box sequence.
As the knapsack type multiple container loading problem, the 16 examples of Mohanty et al.
(Mohanty et al., 1994) are used here. The objective of this problem is to maximize the total
value of the loaded boxes. The problems are denoted by MMI01 to MMI16. In this knapsack
type problem, the constant numbers are
α
= 0 and β =1 in the criterion (3) and the rule R2 is
used to determine the initial solution of box sequence.
The algorithm was implemented in C using MS Visual C++ 6.0. The results of this approach
were calculated on Xeon PC with a frequency 3.0GHz and 3GB memory.

Advances in Greedy Algorithms
62
4.2 Comparison with other methods
In order to show effectiveness of the approach above described, this approach MSLS has
compared with other approaches. The following approaches were included the results of
three kinds of test problems:
• IV_1989, a heuristic approach (Ivancic et al., 1989);
• MO_1994, a heuristic approach (Mohanty et al., 1994);
• B&R_1995, a heuristic approach (Bischoff & Ratcliff, 1995);
• BO_2000, a heuristic approach (Bortfeldt, 2000);
• EL_2002, a tree search approach (Eley, 2002);
• EL_2003, a bottleneck approach (Eley, 2003);
• TA_2006, a meta-heuristic approach (Takahara, 2006);
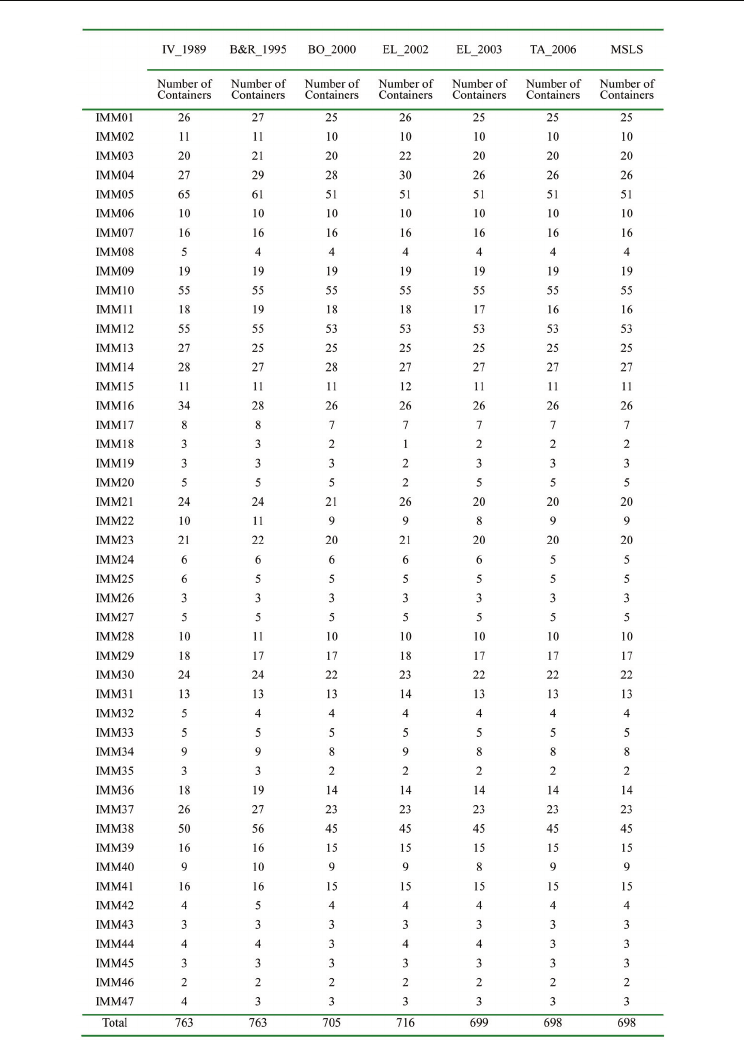
Table 1 presents the results for the 47 IMM problem classes. The parameters that were used
in MSLS are γ = 50 , msn = 5 , lsn = 500 , nsb = 1 and nsr = 3 . The last column shows the total
number of required containers. The results show that MSLS could be obtained the minimum
number of total required containers than any other approach. But the result of the proposed
approach is same as the result of the SA-Combined of TA_2006. This is because the greedy
loading algorithm SCA is almost same as the loading algorithm that uses in TA_2006.
However, the performance of computational time of MSLS has been improved from that of
TA_2006 by 50%.
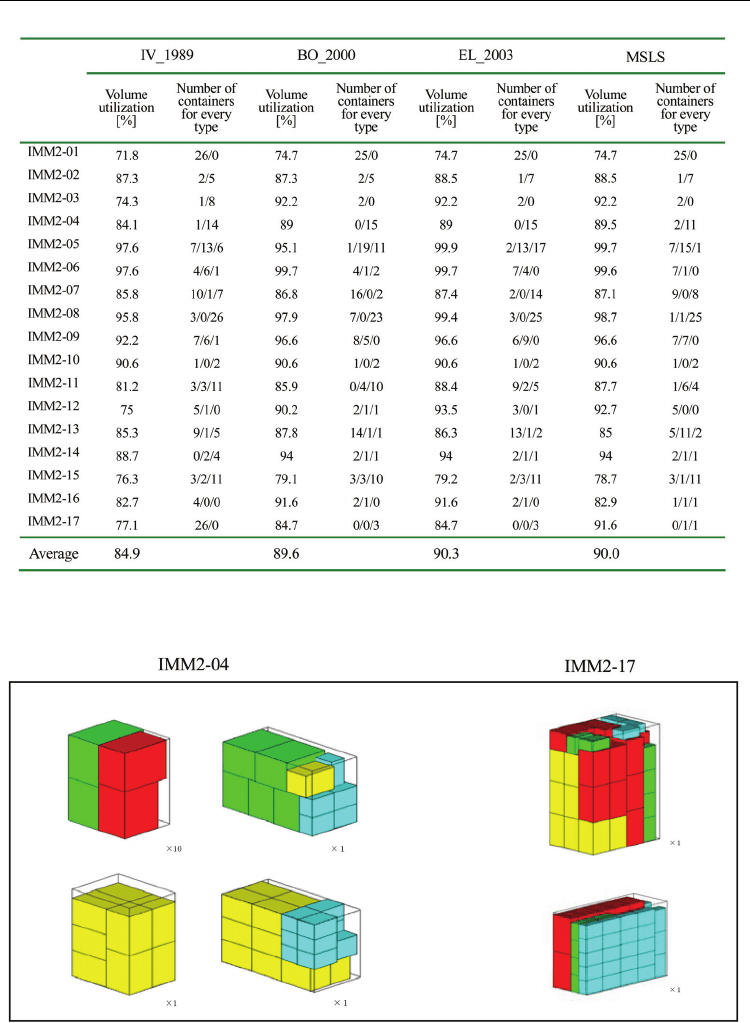
Table 2 shows the results for the 17 examples of three dimensional bin packing problem
with different container types. The parameters that were used in MSLS are γ = 50 , msn =10 ,
lsn =1000 , nsb = 1 and nsr = 3 . The proposed approach obtained second highest average of
volume utilization. For the test cases of IMM2-04 and IMM2-17, best arrangements ware
found among these four methods. Fig.1 shows the best results found by the proposed
approach.
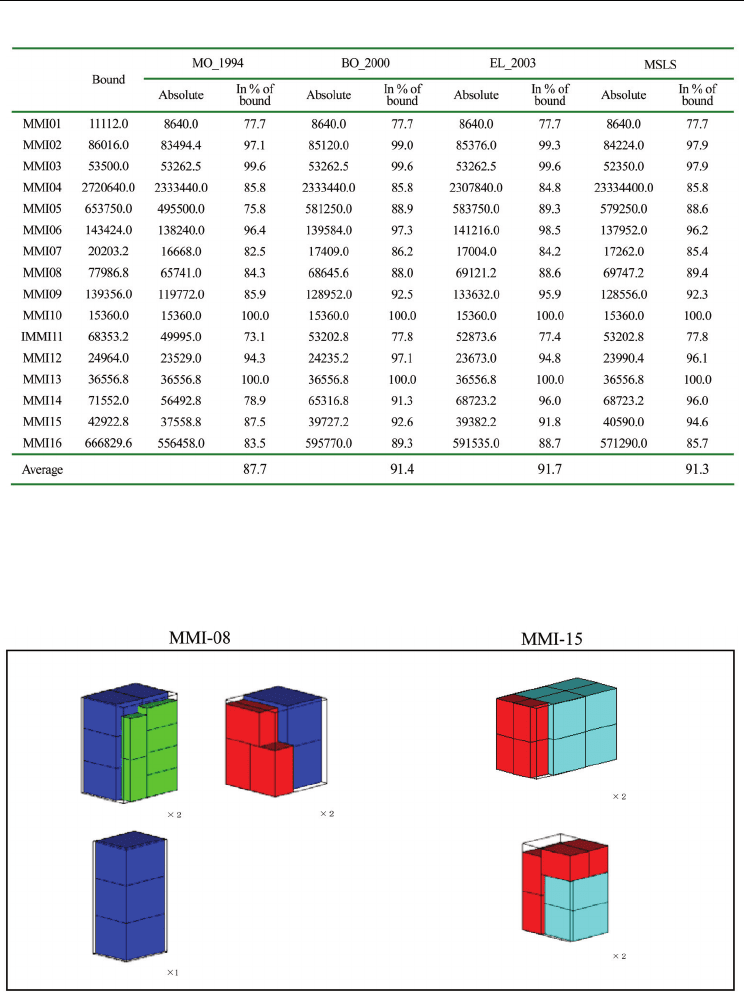
Table 3 shows the results for the 16 MMI examples of knapsack type problem. The
parameters that were used in MSLS are γ = 50 , msn =10 , lsn =1000 , nsb = 2 and nsr = 6 . The
proposed approach obtained third highest average of volume utilization. For the test cases
of MMI08 and MMI15, best arrangements ware found among these four methods. Fig.2
shows the best results found by the proposed approach.
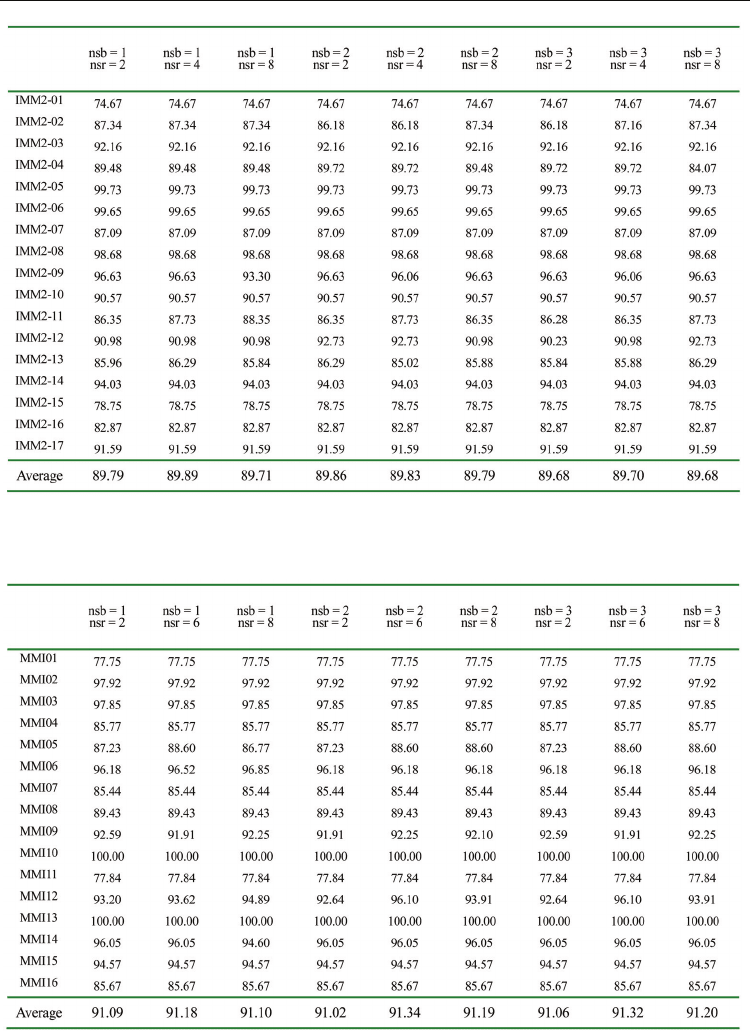
4.3 Effect of neighborhood size
The neighborhood sizes, that is nsb and nsr , are key parameters of the proposed approach.
nsb is the box sequence element ranges that can be exchanged. nsr is the number of iterations
in which the orientation order elements are exchanged. In order to show the effect of these
parameters, the following experiments have been done. The other parameters that were
used here are γ = 50 , msn =10 , lsn =1000 . Table 4 shows the Ivancic et al. with different
container types test problems results. The value in this table is volume utilization. If the
neighborhood size nsb grows, the effect of the neighborhood size nsr becomes small. In the
case of nsr = 3 or nsr = 4 , the better results are obtained. Table 5 shows Mohanty et al. test
problems results. The value is the percentage of bounds. If the neighborhood size
nsb
becomes small, the effect of the neighborhood size nsr becomes small. In the case of nsr = 5
or nsr = 6 , the better results are obtained.
A Multi-start Local Search Approach to the Multiple Container Loading Problem
63
Table 1. Results obtained for the problems from Ivancic et al. with one container type
Advances in Greedy Algorithms
64
Table 2. Results obtained for the problems from Ivancic et al. with different container types
Fig. 1. Layout results of Ivancic et al. with different container types test problems
A Multi-start Local Search Approach to the Multiple Container Loading Problem
65
Table 3. Results obtained for the problems from Mohanty et al.
Fig. 2. Layout results of Mohanty et al. test problems
Advances in Greedy Algorithms
66
Table 4. Ivancic et al. with different container types test problems results for different
neighborhood size
Table 5. Mohanty et al. test problems results for different neighborhood size

A Multi-start Local Search Approach to the Multiple Container Loading Problem
67
5. Conclusion
The presented multi-start local search approach for the multiple container loading problem
is suitable for solving various kind of problem, because the proposed approach is based on
greedy loading algorithm and hardly uses problem-specific operators and heuristic rules.
Hence it is easy to improve and manage by users. Its good performance and superiority
compared with the other approaches were shown in the test results.
In this paper, only the weakly heterogeneous problems are taken. Thus, further studies
include integration of greedy loading algorithm and multi-start approach, dealing with the
strongly heterogeneous problems, and development of an efficient container loading
software.
6. References
Bischoff, E. E. & Ratcliff, M. S. W. (1995). Issues in the development of approaches to
container loading, Omega, 23, pp.377-390.
Bortfeldt, A. (2000). Eine heuristik für multiple containerladeprobleme, OR Spektrum, 22
pp.239-262.
Eley, M. (2002). Solving container loading problems by block arrangement, EJOR, 141,
pp.393-402.
Eley, M. (2003). A bottleneck assignment approach to the multiple container loading
problem, OR Spectrum, 25, pp.45-60.
George, J. A. & D. F. Robinson, D. F. (1980). A heuristic for packing boxes into a container,
Computers Opns Res., 7, pp.147-156.
George, J. A. (1996). Multiple container packing: a case study of pipe packing, Journal of the
Operational Research Society, 47, pp.1098-1109.
Gilmore, P. C. & Gomory, R. E. (1965). Multistage cutting stock problems of two and more
dimensions, Opns Res., 13, pp.94-120.
Ivancic, N.J., Mathur, K. & Mohanty, B.B. (1989). An integer-programming based heuristic
approach to the three dimensional packing problem, Journal of Manufacturing and
Operation Management, 2, pp.268-298.
Johnson, D. S., Demers, A., Ullman, J. D., Garey, M. R. & Graham, R. L. (1974). Worst-case
performance bounds for simple one-dimensional packing algorithms, SIAM J.
Comput., 3, pp.299-325.
Mohanty, B. B., Mathur, K. & Ivancic, N.J. (1994). Value considerations in three-dimensional
packing – A heuristic procedure using the fractional knapsack problem, EJOR, 74,
pp.143-151.
Takahara, S. (2005). Loading problem in multiple containers and pallets using
strategic search method, Lecture Notes in Artificial Intelligence 3558, pp.448-
456.

Advances in Greedy Algorithms
68
Takahara, S. (2006). A simple meta-heuristic approach for the multiple container loading
problem, Proceedings of 2006 IEEE International Conference on Systems, Man and
Cybernetics, pp.2328-2333, Taipei, Taiwan.
5
A Partition-Based Suffix Tree Construction
and Its Applications
Hongwei Huo
1
and Vojislav Stojkovic
2
1
School of Computer Science and Technology, Xidian University, Xi’an
2
Computer Science Department, Morgan State University, Baltimore
1
China
2
USA
1. Introduction
A suffix tree (also called suffix trie, PAT tree or, position tree) is a powerful data structure
that presents the suffixes of a given string in a way that allows a fast implementation of
important string operations. The idea behind suffix trees is to assign to each symbol of a
string an index corresponding to its position in the string. The first symbol in the string will
have the index 1, the last symbol in the string will have the index n, where n = number of
symbols in the string. These indexes instead of actual objects are used for the suffix tree
construction. Suffix trees provide efficient access to all substrings of a string. They are used
in string processing (such as string search, the longest repeated substring, the longest
common substring, the longest palindrome, etc), text processing (such as editing, free-text
search, etc), data compression, data clustering in search machines, etc.
Suffix trees are important and popular data structures for processing long DNA sequences.
Suffix trees are often used for efficient solving a variety computational biology and/or
bioinformatics problems (such as searching for patterns in DNA or protein sequences, exact
and approximate sequence matching, repeat finding, anchor finding in genome alignment,
etc).
A suffix tree displays the internal structure of a string in a deeper way. It can be constructed
and represented in time and space proportional to the length of a sequence. A suffix tree
requires affordable amount of memory. It can be fitted completely in the main memory of
the present desktop computers. The linear construction time and space and the short search
time are good features of suffix trees. They increase the importance of suffix trees. A suffix
tree construction process is space demanding and may be a fatal in the case of a suffix tree to
handle a huge number of long DNA sequences. Increasing the number of sequences to be
handled, due to random access, causes degrades of the suffix tree construction process
performance that uses suffix links. Thus, some approaches completely abandon the use of
suffix link and give up the theoretically superior linear construction time for a quadratic
time algorithm with better locality of reference.
2. Previous work
Weiner [1] gave the first linear time algorithm for suffix tree construction. McCreight [2]
built a more space efficient algorithm for suffix tree construction in linear time. It has a

Advances in Greedy Algorithms
70
readable account for suffix tree construction while processing a string from right to left.
Ukkonon [3] developed a conceptually different linear-time algorithm for suffix tree
construction that includes all advantages of McCreight’s algorithm but also allows a much
simpler explanation. It is a left-to-right on-line algorithm. Ukkonon’s algorithm maintains at
each step a suffix tree for a string S, where S is c
1
... c
i
... c
n
, as the index i is increasing from 1
to n. Many improvements in suffix tree construction have been done during the last
decades. The early algorithms for suffix tree construction have been focused on developing
algorithms in linear space. These algorithms are adapted to a small input size and the entire-
complete suffix tree can be constructed in the memory. Unfortunately, these algorithms are
less space efficient, because they suffer from a poor locality of memory reference. Cache
processor architectures have a hard job to store memory references in the secondary
memory. One moment there are too many data to be loaded into the memory that causes the
missing a lot of cache and more disk swapping. Thus, how to develop a practical algorithm
for suffix tree construction is still an important problem.
Suffix trees are not only used in the substring processing problems. They are used also in the
complex genome-scale computational problems. For example, MUMmer [4, 5] is a system
for the genome alignment, which uses as its main structure suffix trees to align two closely
relative genomes. Due to the advantages of suffix trees, MUMmer provides the faster,
simpler, and more systematic way to solve the hard genome alignment problem. REPuter [6,
7] is another popular software tool for the efficient computing of exact repeats and
palindromes in the entire genome. It uses an efficient and compact suffix tree to locate exact
repeats in linear time and space.
Although suffix trees have these superior features, they are not widely used in the real
string processing software. The main reason for that is that the space consumption of a
suffix tree is still quite large despite the asymptotically linear space [3]. Therefore, several
researchers/scientists have developed the alternative index structures, which store less
information than suffix trees, but they are more space efficient [8]. The most known index
structures are suffix arrays, level compressed tries, suffix binary search trees, [4]. Index
structures have to be tailed for some string matching problems and cannot be adapted to
other kinds of problems without loss of performance. Also, the traditional string methods
cannot be directly used in the DNA sequences because they are too complex to be treated.
The reducing the space requirement of suffix trees is still an important problem in the
genome processing.
In order to overcome these disadvantages, we propose a new algorithm for suffix tree
construction for DNA sequences based on the partitioning strategies and use of the common
prefixes to construct the independent subtrees [9]. The experiments show that the proposed
algorithm is more memory-efficient and it has a better performance on the average running
time.
3. Suffix tree
3.1 Definition
Definition 1. A suffix tree for a string S of n-characters, where n>=1, is a tree with n leaves
numbered from 0 to n-1. Each internal node, other than the root, has at least two children.
Each edge has an edge-label that is a nonempty substring of the string S. All edges exit from
a same node have edge-labels beginning with different characters.