Avgoustinov Nikolay. Modelling in Mechanical Engineering and Mechatronics
Подождите немного. Документ загружается.

162 4 Towards Better Product and Process Modelling
the MDA, and have greatly contributed to the current state-of-the-art of systems
modelling.
According to Frankel (2001, p.31) modelling languages can be used as
programming languages to improve productivity, quality and longevity.
MDA offers excellent concept and architecture for implementing both
authoring tools and systems of models. It considers many of the information-
technology-related issues of the modelling, but on a relatively low-level of
implementation. Therefore, although very suitable for implementation of software
models, it seems to be unable to solve all problems and issues of mechanical and
mechatronical modelling – at least not without extensions and improvements.
4.3.11 Holonic Manufacturing
Let us first introduce some definitions for clarity:
Holon: object, which can be viewed as both a part of a given system and as an
autonomous or compound entity.
Manufacturing Holon: An autonomous and cooperative building block of a
manufacturing system for transforming, transporting, storing and/or validating
information and physical objects. The manufacturing
holon has always an
information processing part and often a physical processing part. A holon can be
part of another holon.
Autonomy: The capability of an entity to create and control the execution of its
own plans and/or strategies.
Cooperation: A process whereby a set of entities develops mutually acceptable
plans and executes these plans.
Holarchy: A system of holons that can cooperate to achieve a goal or objective.
The holarchy defines the basic rules for cooperation of the holons and thereby
limits their autonomy.
Holonic Manufacturing System (HMS): A holarchy that integrates the entire
range of manufacturing activities from order booking through design, production,
and marketing in order to realize the agile manufacturing enterprise.
Holonic Attributes: The attributes of an entity that make it a holon. The
minimum set is autonomy and cooperativeness.
Holonomy: The extent to which an entity exhibits holonic attributes.
Some typical examples of manufacturing holons are: continuous processing
holon, machining holon, assembly holon, transportation holon and system
optimization holon.
In comparison to other well-known notions a holon is cooperative like a server
in a client–server environment and autonomous like a free agent
(http://www.mech.kuleuven.be/goa/). To summarize, the holonic approach puts the
focus on decentralization of the control and decision making, which is achieved by
incorporation of intelligence in the holons. Sometimes advantages specific to the
fractal manufacturing (see below) can be also observed.
4.3.12 Fractal Manufacturing
According to Warnecke (1996) the term fractal originates from the Latin word
fractus (broken, fragmented). It is usually described in the literature as a self-
similar
geometry or structure, but this definition is somewhat unintuitive and
inaccurate. What is actually meant by self-similar is that there is some pattern –
4.4 Modelling Parameters 163
either structural, or geometrical, or of whatever nature – which can be found or
recognized on different hierarchy levels within a given object or system.
Fractal Factory: self-similar, self-organized, self-optimizing, goal-oriented,
dynamic structure,
cf. Warnecke (1996). Goals are also self-similar.
A (manufacturing) fractal can be viewed as a special kind of holon: it is by
definition part of a bigger (or higher level) fractal and can be simultaneously
independent and self-functioning. But on another level in the hierarchy there
always exists a fractal with similar organization, topology, structure, ways of
control,
etc. These similarities can lead to many advantages – mainly reuse of work
and simplification. The most important advantage of the approach is that identical
(control) structures, used on the different fractal levels, lead to more intuitiveness
and easier predictability, simplifying therewith the control. By means of software
systems reusability of the control modules is achieved for similar fractals
(components with the same properties/structure), which leads to cost reduction and
increases the efficiency.
4.3.13 Others
The above survey of some known approaches does not pretend to be complete or
exhaustive: there exist some approaches that are known but not mentioned here
because they are not (fully) relevant to our presentation scheme. Other approaches
might be relevant, but still unknown to the author. Some other approaches are
really worth mentioning, but are not included in the survey due to time-related
reasons. Among them are:
• Bionic Manufacturing
• Property Driven Design (PDD); KFT, Saarland University described in
Weber
et al. (2003; Weber (2005a;b)
• Global Manufacturing Interface (GMI), University of Twente
• Reference Model of Open Distributed Computing: ISO/IEC 10746
• Modular Factory
• Multi-agent Systems (Bochmann et al. (2003; Fischer et al. (2003), etc.)
• BEA WebLogic Integration (BEA Systems (2004)
• Service Oriented Architecture (SOA)
• ESPRIT 21955: Working Group on Intelligent Manufacturing Systems
(http://www.mech.kuleuven.be/imswg/welcome.html)
• Intelligent Mechatronic Systems (http://www.mech.kuleuven.be/imechs/ or
http://www.mech.kuleuven.be/ams/)
4.4 Modelling Parameters
After detailing so many and different requirements, we have to consider what
means can be used to satisfy them. Since the focus of this book is more on
methodology than on software implementation we shall neither go into too much
implementational detail, nor consider specific solutions or examples.
4.4.1 Parameters Enumeration
At the beginning, let us just review which quantities, attributes or traits of the
models and of the modelling could be influenced directly: those are our modelling
164 4 Towards Better Product and Process Modelling
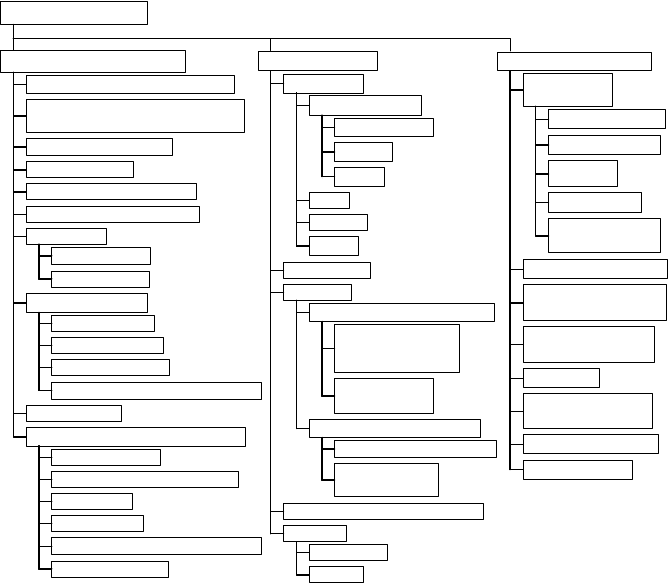
parameters. A handful of parameters well-known in software design are given in
Figure 4.2 together with modelling parameters, which I know from my personal
practical experience. They are grouped in three main categories:
strategic/conceptual activities, model organization and implementation modalities.
Of course, this grouping is neither absolute nor final, but it helps in the
understanding and handling of the matter.
Modelling parameters
strategic & conceptual activities
model organization
implementation modalities
separation of authoring from use
shifting the focus from use of tools
towards adequate models/results!
interaction resemblance
parameterization
pursuing optimal granularity
platform-independent design
integrability
appropriate hosting
use of patterns
choice of appropriate authoring tools
interoperability
standardization
long living hosts
high performance
low price of the host
new versions backward compatible
tool performance
quality of the delivered models
tool lifetime
tool reliability
new versions backward compatible
low price of the tool
architecture
decentralized
autonomy
max. independence from the host
structure
component-based
open
modular
fractal
clear interfaces
libraries
broker
incorporation of self-awareness
incorporation of intelligence
capability to answer
pre-defined questions
about itself
capability for
self-maintenance
capability to take decisions
capability for
self-improvement
hierarchical
layered
object-oriented
technology
employment of recursion
minimization of the
information content
mnemonics
factoring out reusable
content
modeller qualification
user qualification
(data) encapsulation
(data) abstraction
(multiple)
inheritance
polymorphism
use of
user-defined types
proper choice of the
level of standardization
Modelling parameters
Figure 4.2.
Most important modelling parameters
As its name suggests, the requirements in the strategic/conceptual group seem to be
the most important or have greatest impact on satisfaction of the requirement. This
could be proved by considering their relations to the main (functional)
requirements.
4.4.2 Main Relations Between (Modelling) Parameters and (Functional)
Requirements
The functional requirements (FRs) detailed in 4.2 and modelling parameters from
Figure 4.2 (DPs; for now only the strategic ones) are listed side by side in Table
4.3. The meaning of ellipses is the same as in Table 4.1. Note that no horizontal
lines are drawn to stress that no correspondence or mapping is established until
now.

4.4 Modelling Parameters 165
Table 4.3. Determining the dependence of FRs on the DPs
Functional requirements Modelling parameters
perfect modelling must...
...allow representation of arbitrary attributes...
...outlook
...functionality
...behaviour
...ensure models' adequateness...
...ensure model plausibility
...ensure quick delivery
...ensure low (running) costs
...provide modelling freedom:
allow static and dynamic modelling
design for extensibility
unrestricted model size
ensure scalability
use of generic modelling techniques
...ensure modelling expedience:
provide efficient modelling concept(s)
can accomplish any task with minimal number
of instructions
ensure cheap creation and reusability
...ensure quick delivery
minimize the accidental/due complexity
design models ready for integration
keep models simple and intuitive
flexibility on all hierarchy levels
use reliable modelling methods and tools
ensure long model-lifetime
separation of authoring and use
focus on achieving adequate
results
interaction resemblance
parameterization
pursuing optimal granularity
platform-independent design
integrability
interoperability
standardization
use of patterns
host…
…long living hosts
…host's performance
…low price of the host
new versions backward compa-
tible
choice of appropriate tools
…performance
…quality of the delivered
models
…lifetime
…reliability
…backward compatible
…low price of the tool
The next step towards a better (solution for) modelling is to find the
interdependencies among the functional requirements and the modelling
parameters. More precisely, in order to satisfy all requirements it is necessary to
know which of them depend on which parameter, and if there are parameters that
impact more than one requirement their exact influence should be known. Since
the determination of these interdependencies – in our case about twenty
166 4 Towards Better Product and Process Modelling
requirements and about forty-five modelling parameters – takes plenty of time,
only the results of this investigation are given here, followed by some comments.
Note that these results can differ if the same analysis is performed from a team
with different experience, as well as if the sets of requirements and parameters are
changed due to differences in the analysed case.
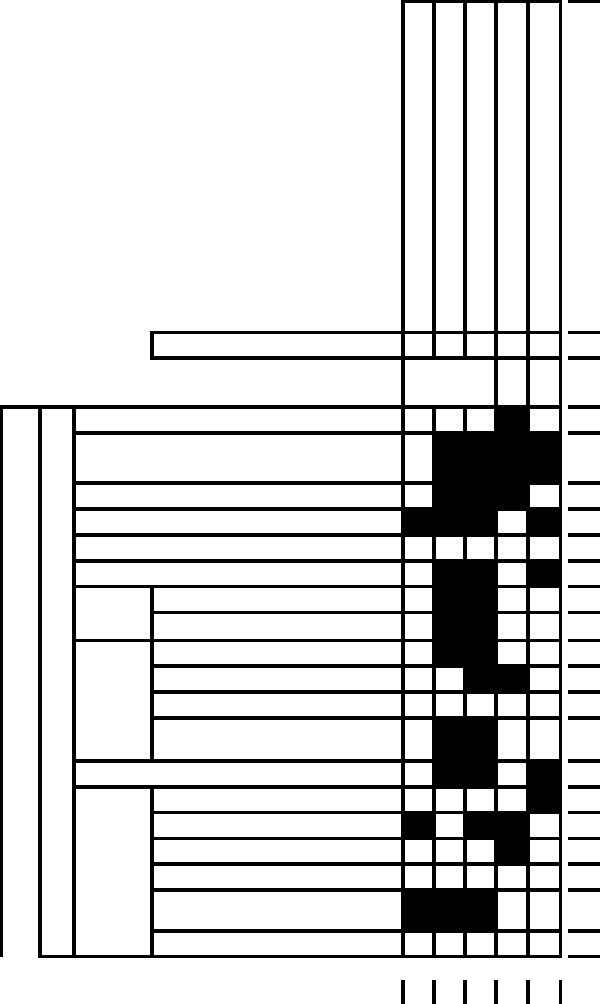
The easiest possibility to represent these results is to use a matrix, similar to the
design matrix used in the axiomatic design Suh (2001) or in the property driven
development/design (PDD) Weber
et al. (2003); Weber (2005a;b). This is
illustrated in Table 4.4 and shows how the existence (or the change in the value of)
a parameter influences the satisfaction of one or more functional requirements. A
“x” in a cell of Table 4.4 denotes an apparent dependence in direct proportion to
the requirement, written as heading of the respective column, on the parameter,
written as heading of the respective row. A “
x-1” denotes, respectively, inversely
proportional influence. A question mark means that the dependence is probable,
but not sure. Dependencies needing further investigation are denoted “
n.i.”
(abbreviated from “need investigation”).
If you are familiar with the
quality function deployment (QFD) technique,
Table 4.4 could seem familiar to you or you could even ask yourself, is it possible
to use QFD here instead or at least to estimate more precisely each relation: yes, it
is possible. Initially we wanted to give estimation for the strenght of each relation
in Table 4.4, but we decided that when working with so many requirements and
parameters it is too difficult to assess the relation strengts properly and consistently
troughout the whole table when viewing a general case like the case here.
4.4.3 Rank of Influence
The next step should be to consider the importance of each parameter, or its rank of
influence on satisfying the functional requirements. This can be performed on the
basis of Table 4.4, which illustrates the interrelations between the requirements and
the parameters. Since both of them are actually represented as hierarchical trees,
only the leafs of these trees should be compared, otherwise their parents (or
superordinates) could show mixed relations, which can be misleading.
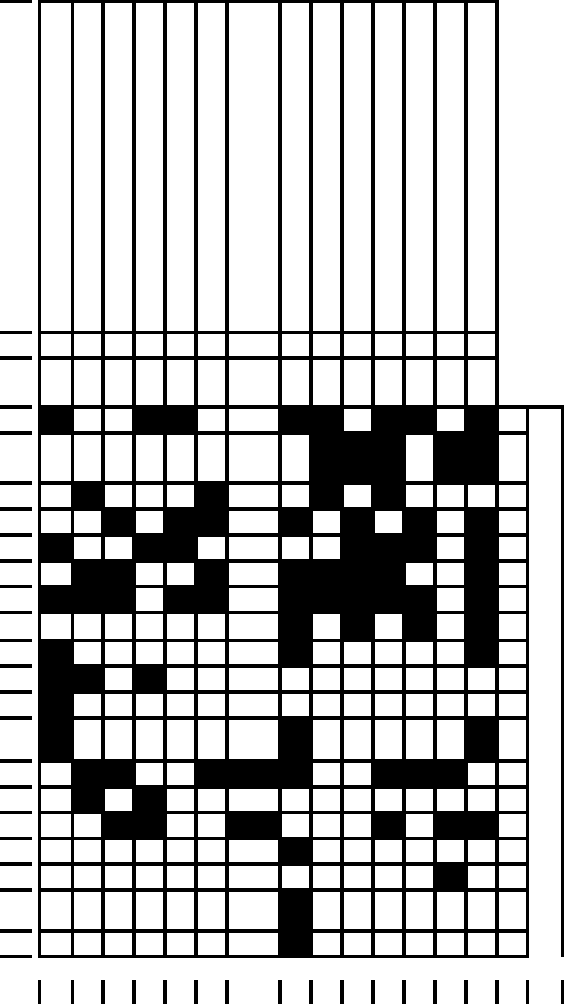
In Table 4.4 (page 168) there is one row (labelled “degree of dependence”) and
one column (labelled “rank of influence”), performing special tasks: they show the
count of the related items for the corresponding category. In other words, the
degree of dependence of any requirement shows the number of parameters it
depends on; the rank of influence shows the number of requirements depending on
a given parameter. Although these measures are only quantitative, they can give
first impressions about which parameters are more influential and which
requirements can be critical to achieve due to a too high degree of influence. Both
measures consider only the directly proportional influence. Since no qualitative
measures can be determined for now, there is not much choice but to investigate
the quantitative aspect.
Let us begin with the strategic and conceptual parameters. A brief look at the
table reveals that 5 of the 19 parameters have influence on half of the 20
requirements or more, whereas 4 requirements depend on the half of the
strategic/conceptual parameters. As can be seen, the highest rank of influence –
13 – is assigned to
interoperability, followed by parameterization, platform-
independent design
and use of patterns, with rank of 12 each. Thereafter follow
shifting the focus (on the models instead of tools) with 10, separation of authoring
4.5 Model Centred Approach 167
from use with 9, and quality of the provided models also with 9. A short discussion
of these parameters is provided in Section 4.6.
Note that when a specific solution is considered, achieving cheap creation and
low running costs are usually viewed as constraints and not as functional
requirements. But since here they are the result of the search for a generic solution
(or approach), they are considered as requirements in this case and have to be
analysed. Also noteworthy is the fact that the prices of the authoring tool and the
host seemingly have the lowest rank of influence – 1. Actually, despite these low
ranks the real influence of these two parameters is considerable and will be
discussed later on.
4.5 Model Centred Approach
I have had my results for a long time: but I do
not yet know how I am to arrive at them.
Karl Friedrich Gauss
A new – not burdened with obsolete restrictions, applications and standards –
approach could allow recent achievements in computer science to bring “fresh air”
to product and process modelling. But is it at all possible to satisfy the
requirements presented in Section 4.2 above, if the powerful CAx-systems cannot?
If Nature is considered for a moment, numerous examples illustrating the (power
of) natural selection can be found: bigger is not always stronger, groups of small
animals often achieve more than one big animal; smaller creatures often adapt
better and propagate quicker than the bigger ones.
4.5.1 Idea
The careful consideration and assessment of the techniques presented in Section
4.3 on the basis of the available information, among other reasons, have led us to
conceive an approach to complement the SCA, as well as to provide an alternative
possibility for development of sophisticated, but less complex systems of models.
This approach – the
Model Centred Approach (or in short MCA) – aims at
avoiding or eliminating the problems and disadvantages mentioned in the previous
chapter. Its initial description has been presented in Avgoustinov (2002), and
Avgoustinov (2004). Driving force of the approach is the modelling, comple-
mented by concepts like intuitiveness, object-oriented and feature-based design,
separation of model authoring and use, multiple levels of detail, aspects,
etc.
Although the SCA has been historically predetermined, it is not relevant for
contemporary conditions and cannot deal anymore with its own deficiencies and
with the problems arising. It seems much more appropriate and relevant if product
and process modelling is performed on an aspect- and object-oriented, model
centred basis, where the main building blocks are components, implemented as
autonomous intelligent entities – the main driving force. The “name” model
centred approach has been chosen as opposite to “system centred approach” and to
stress the fact that the priorities of the MCA are different.
168 4 Towards Better Product and Process Modelling
Table 4.4a. Modelling parameter influence on functional requirements (UL part )
...outlook
...functionality
...behaviour
...ensure model plausibility
...ensure quick delivery
31012 6 5
0.1
0.2
0.3
1.1
1.2
x
xxxx
xxx
xxx x
xx x
xx
xx
xx
xx
xx
xx x
x
xxx
x
xxx
strategic & conceptual activities
separation of authoring from use
shifting the focus from use of tools
towards adequate models/results!
integra-
bilit
y
approp-
riate
hosting
tool reliabilit
y
interaction resemblance
low price of the tool
high performance
degree of dependence
Modelling parameters
tool lifetime
quality of the delivered models
choice of
appropriate
authoring tools
platform-independent model design
pursuing optimal granularity
parameterization
tool performance
use of patterns
new versions backward
compatible
low price of the hos
t
new versions backward
com
p
atible
interoperabilit
y
long living hosts
standardization
Correlation number
dd
1
2
3
4
5
6
7
8
9
10
11
12
13
14
15
16
17
18
19
Correlation number 1 2 3 4 5
┼
4.5 Model Centred Approach 169
Table 4.4b. Modelling parameter influence on functional requirements (UR part )
Correlation number
dd
1
2
3
4
5
6
7
8
9
10
11
12
13
14
15
16
17
18
19
...ensure low (running) costs
allow static and dynamic modelling
design for extensibility
unrestricted model size
ensure scalability
use of generic modelling techniques
can accomplish any task with minimal
number of instructions
ensure cheap creation and reusability
minimize the accidental/due complexity
design models ready for integration
keep models si
mple and intuitive
flexibility on
all hierarchy levels
use of reliable modelling methods and tools
ensure long mo
del-lifetime
765545 2115686410
1.3
2.1
2.2
2.3
2.4
2.5
3.1.1
3.1.2
3.1.4
3.2
3.3
3.4
4
5
xxx xxxxx
9
xxx xx
10
xxxx
7
xxx xxxx
12
x xx xxx x
7
xx x xxxx x
12
xxx xx xxxxx x
13
?x
-
1
x
-
1
n.i. ? x
x
-
1
xxx
6
xxx
5
xx x
5
x
1
xxx
5
xx xxx xxx
12
xx
4
xx x x xx
9
x
2
x
1
x
4
x
1
rank of influence
┼
6 7 8 9 10 11 12 13 15 16 17 18 19 20 R
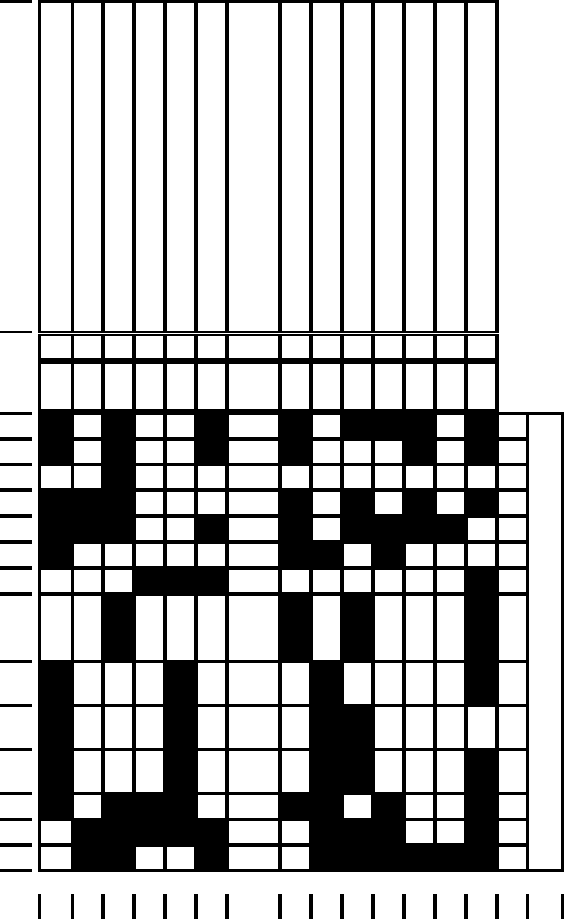
170 4 Towards Better Product and Process Modelling
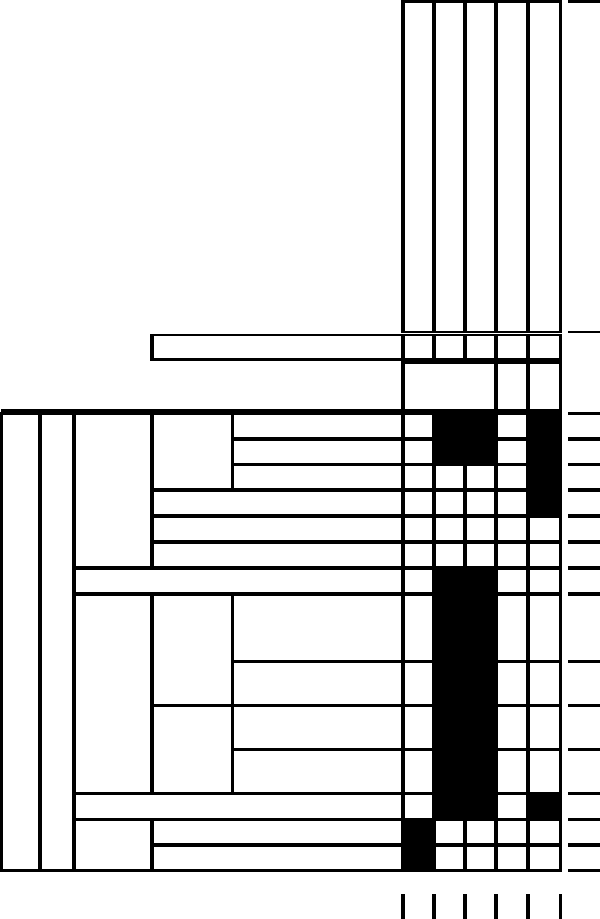
Table 4.4c. Modelling parameter influence on functional requirements (ML part )
...outlook
...functionality
...behaviour
...ensure model plausibility
...ensure quick delivery
Correlation number
110 8 3 5degree of dependence
0.1
0.2
0.3
1.1
1.2
clear interfaces
xx x
libraries
xx x
broker
x
x
xx
capability to answer
pre-defined ques-
tions about itself
xx
capability for self-
maintenance
xx
capability to take
decisions
xx
capability for self-
im
p
rovement
xx
xx x
x
x
architecture
Modelling parameters
incorpo-
ration o
f
intelli-
gence
incorpo-
ration o
f
self-
aware-
ness
decentralized
fractal
autonomy and
intelligence
layered
structure
hierarchical
modula
r
model organization
open
compo-
nent-
based
max. independence from the host
20
21
22
23
24
25
26
27
28
29
30
31
32
33
Correlation number 1 2 3 4 5
┼
4.5 Model Centred Approach 171
Table 4.4d. Modelling parameter influence on functional requirements (MR part )
Correlation number
...ensure low (running) costs
allow static and dynamic modelling
design for extensibility
unrestricted model size
ensure scalability
use of generic modelling techniques
can accomplish any task with minimal
number of instructions
ensure cheap creation and reusability
minimize the accidental/due complexity
design models ready for integration
keep models simple and intuitive
flexibility on al
l hierarchy levels
use of reliable modelling methods and tools
ensure long model-lifetime
215139 510649384
1.3
2.1
2.2
2.3
2.4
2.5
3.1.1
3.1.2
3.1.4
3.2
3.3
3.4
4
5
20
21
22
23
24
25
26
27
28
29
30
31
32
33
x x x x xxx x
12
xx x x xx
10
n.i.
x
3
xxx x x x x
9
xxx x x xxxx
9
xxxx
4
xxx x
6
xxxx
6
xx x x
6
xx xx
6
xx xxx
7
x xxx xx x x
12
xxxxx xxx x
10
xx x xxxxxx
10
rank of influence
┼
6 7 8 9 10 11 12 13 15 16 17 18 19 20 R