Asai K. (ed.) Human-Computer Interaction. New Developments
Подождите немного. Документ загружается.

A Tool for Getting Cultural Differences in HCI
351
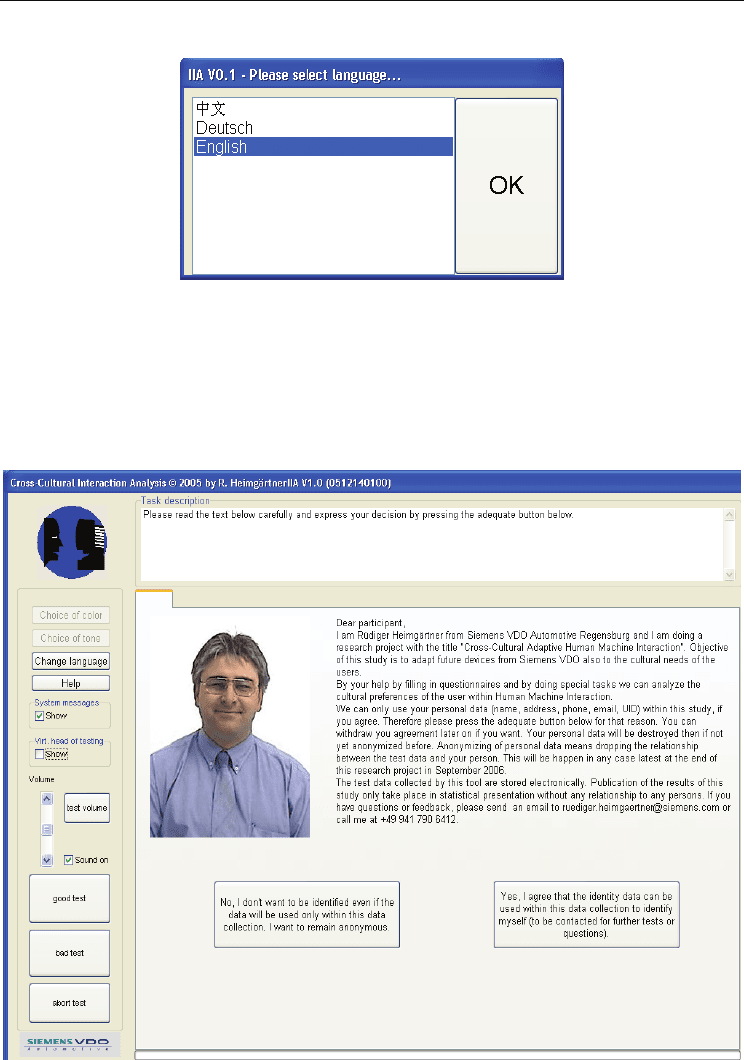
session represented by some parameters like mouse moves or mouse clicks as well as
keyboard presses (at y-axis) displayed over time (at x-axis).
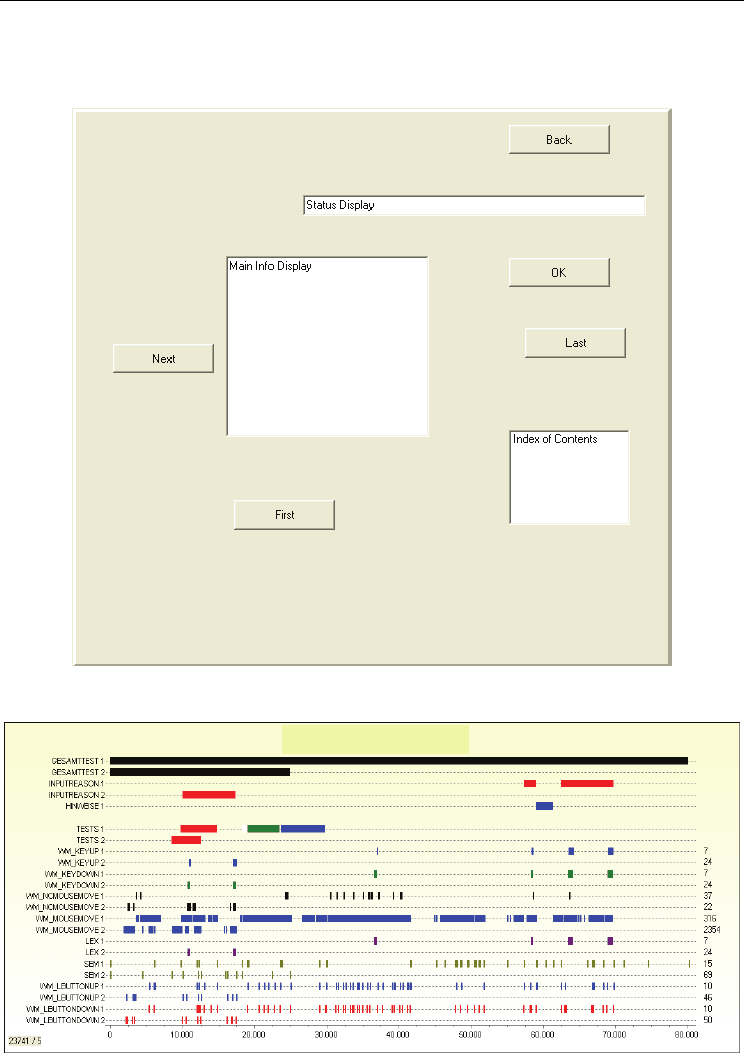
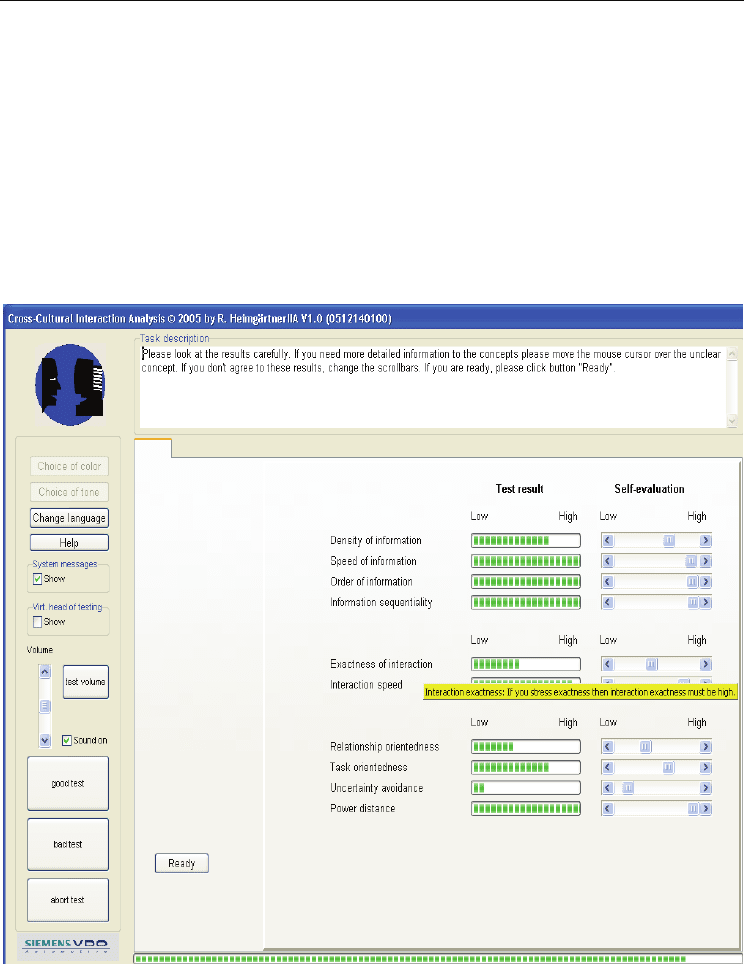
Fig. 5. Main part of the GUI of the URD Test Task
Fig. 6. Part of a Course of Interaction (of a user with the system during a test session)
COURSE OF INTERACTION

Human-Computer Interaction, New Developments
352
4. IIA Tool Setup, Test Setting and Usage
To motivate the user to interact with the computer and to test the hypotheses, test tasks have
been developed and implemented into the IIA tool as described in the last section, which the
user has to work on. Figure 7 shows the IIA test procedure containing the sequence of tasks
presented to the test participant (the brackets embraces the file names of the source code of
the modules written in Delphi7).
IIA Test
Procedure
Select test
language
(choicelang
form2.pas)
Agreement
declaration
(identdata.pas)
Identification
page
(identdata.pas)
Selection of
tone types
(options.pas)
Selection of
widget colors
(options2.pas)
Demographic
Data Collection
(userdata.pas)
Information
order
(infoorder.pas)
Information
speed
(infospeed.pas)
Interruption
tolerance
(irtol.pas)
Interaction
exactness
(interexact.pas)
Interaction
speed
(interspeed
.pas)
Interaction
sequentiality
(interseq.pas)
Information
hierarchy
(infohier.pas)
User
Requirement
Design
(Arranging
widgets)
(urd.pas)
Map Display
Test Task
(poi.pas)
Information
Sequentiality
(comic.pas)
Debriefing
questionnaire
(endques.pas)
Result
Evaluation
(testrep.pas)
Information
Tolerance
(sensedisturb.
pas)
Test
description
(testdescr.pas)
Fig. 7. Test procedure of the IIA test
A user test session with the IIA data collection module comprises five parts: collection of
demographic data, test tasks, (cultural) value survey module (VSM94) questionnaire from
Hofstede 1994, evaluation of results by the user, and debriefing questionnaire. The method
to ask many users online by letting them do special test use cases and to collect the
qualitative data (user preferences) emerged by this process quantitatively, has been used for
Chinese (C), English (E) and German (G) speaking employees of SiemensVDO (SV) (now
Continental) worldwide by an automated online data collection using the IIA data collection
module to get cultural differences in HMI. After the start of the IIA data collection module,
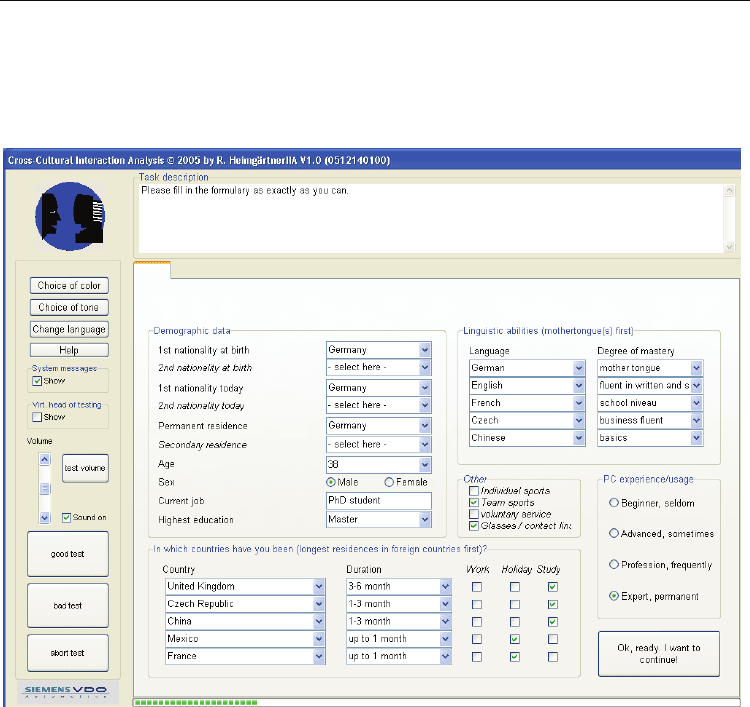
firstly, the user has to select his preferred test language (figure 8).
A Tool for Getting Cultural Differences in HCI
353
Fig. 8. The user can choose the language in which the test takes place (Chinese, German, or
English)
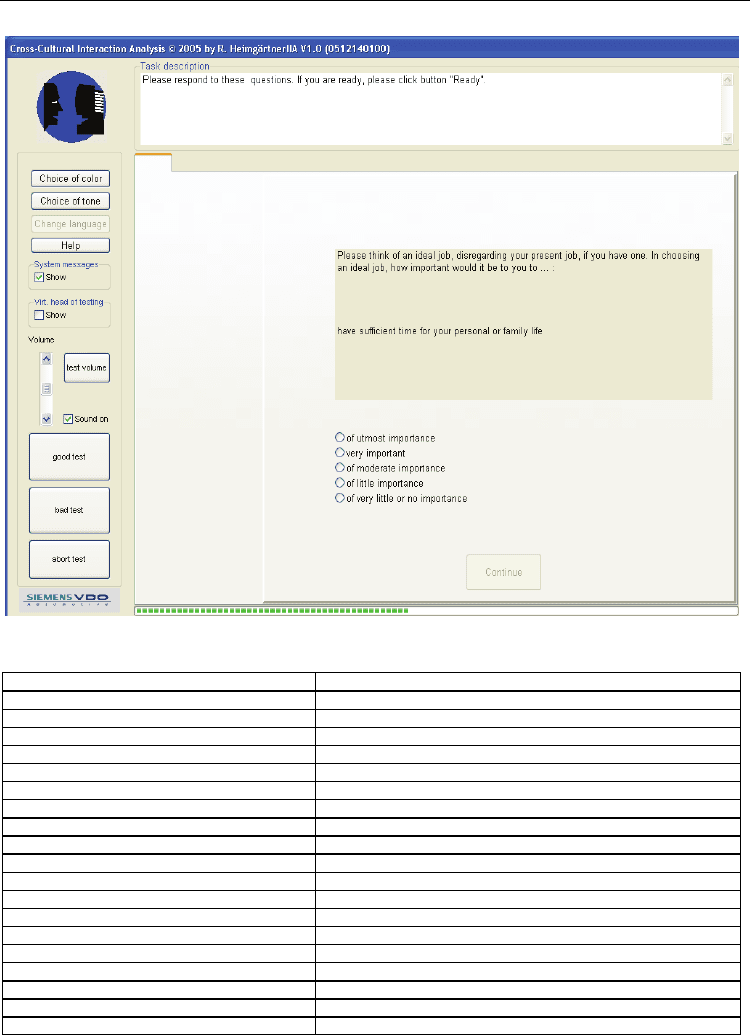
Afterwards, greetings and a legend will be presented followed by a declaration of consent
by the user that the collected data from the user may be used within the research project
(figure 9). If the user disagrees, no personal data may be collected: the data collection will be
anonymous.
Fig. 9. Test introduction and agreement to use personal data
Human-Computer Interaction, New Developments
354
The demographic “questionnaire” delivers the usual knowledge of demographic research
especially about the cultural background of the user (like mother tongue, languages,
nationality, residence in foreign countries, highest education, job description, age and PC
experience) (figure 10).
Fig. 10. Special “demographic questionnaire” recording also the interaction behavior of the
user with the system
However, in this case, the demographic “questionnaire” is already a special test task,
recording also many parameters regarding the interaction behavior of the user with the
system.
• Sequence of asking the questions.
• Number of dialog steps to finish the test task.
• Number of interactions during doing the test task e.g. number of using optional
functions and help initiations, color settings, mouse moves or clicks and drop downs.
• Length of interaction breaks during doing the test task.
• Number of premature trials to go on to the next test task because the user meant he has
finished the current task already. It is assumed that (C)>(G), because C has lower
uncertainty avoidance than (G).

A Tool for Getting Cultural Differences in HCI
355
• Number of help usage. The user can press a help button to get a hint about to do the
test task. It is assumed in literature (cf. Honold, 2000), that Chinese user do not use this
button as often as German users because of fearing to lose their face.
• Number of initiating optional functions supposed to be high for (G) because of the wish
to work very accurately.
• Straightness of mouse moving direction is assumed to be linear for (G) because of high
task-orientedness.
• Speed of mouse movement: probably higher for (C) than for (G) because of low
uncertainty avoidance and high communication speed.
• Jerkiness of mouse movements concerning affectivity and emotionality: (C) higher than
(G) because of their relationship-orientedness.
• Number of language switching probably higher for (C) because of cultural interest and
openness as well as multilingualism by relationship-orientedness and collectivistic
attitude.
• Number of dialog steps assumed to be lower for (G) than for (C) because of task-
orientedness.
• Test duration can be both: (G) > (C) by doing tasks very exactly because of task-
orientedness but also the other way around: (C) > (G) by discussing the tasks with other
people because of relationship-orientedness.
• For all number of key presses like usage of return-key-presses and usage of keyboard
(number and kind of key presses), (C) > (G) is expected because of high interaction
speed coming from low uncertainty avoidance as well as high communication speed
and density by relationship-orientedness.
• Number of sounds, words, sentences, and utterances higher for (C) e.g. because of
higher affectivity and relationship-orientedness.
• Duration of selection (e.g. combo box) is expected higher for (G) than for (C) because of
degree of reflection (R) and interaction exactness (hit exactness at motoric selection).
• Time between “Mouse-Move-Over-Widget and Click onto Widget”: (G) > (C) because
high degree of reflection and low interaction speed.
• Length of stay with mouse at widgets: (G) > (C) because of higher degree of reflection
(R) as well as low interaction speed.
• Double click speed: higher for (C) than for (G) because of interaction speed, uncertainty
avoidance (UV) and affectivity.
• Entering speed (e.g. on the keyboard): (C) > (G) because of interaction speed, (UV) and
affectivity.
• Times between “selecting” and “using” (G)>(C) because of interaction speed, (UV) and
(R).
• Sequence of user actions (e.g. „Selecting“): (G) > (C) because of action chain theory, i.e.
high information sequentiality because of orientation to plan – avoiding coincidences –
and doing things sequentially according to mono-chrone understanding of time as well
as high uncertainty avoidance exposing a linear cognitive style.
• Number of backspace usage (number of wro
ng entering) and error clicks (= senseless or
useless mouse clicks): (C) > (G) because of low (UV) and high interaction speed paired
with high impatience or desire to get fast feedback (all initiations are expected to get
immediate reactions).
Human-Computer Interaction, New Developments
356
Fig. 11. Question in the IIA data collection module
Parameter Exam
p
le
ID 47
Number 42
Grou
p
2
Cate
g
or
y
DNS
Positio
n
4
Source Brow
n
Headline Driver navi
g
ation s
y
stem
Q
uestio
n
How
p
olite should be a DNS?
Scale Interval
Scale size 0
,
100
Attributes
p
olite honestl
y,
p
olite-eu
p
hemistic
La
y
out Vertical
Result 54
Reason necessar
y
False
Reason box headline
Please
g
ive a reaso
n
Reaso
n
no idea
Show values False
Priorit
y
4
Without
q
uestio
n
False
Table 2. Flexible controlling of the questionnaires in the IIA data collection module by using
simple excel sheets
A Tool for Getting Cultural Differences in HCI
357
Furthermore, to analyze the cultural characteristics of the users, the value survey module
(VSM94) has to be filled in by the user (cf. Hofstede, 2002). The VSM94 contains 26 questions
to determine the values of the cultural dimensions using the indices of Hofstede that
characterize the cultural behavior of the users (cf. Hofstede, 1991). The questions are
implemented within the IIA data collection tool (cf. figure 11) as flexible questioning module
which can be controlled by a simple excel sheet (cf. table 2): not only the contents but also
the kind of questions can be defined (nominal, ordinal, interval, with/without qualitative
reason/text box, with/without numerical display, checkboxes or radio buttons).
After this, the results of the VSM94 and those of the test tasks are presented to the user who
has to estimate whether or not the cultural and informational values found correlate or
match to him (cf. figure 12).
Fig. 12. Asking the user to evaluate the results found during the IIA test
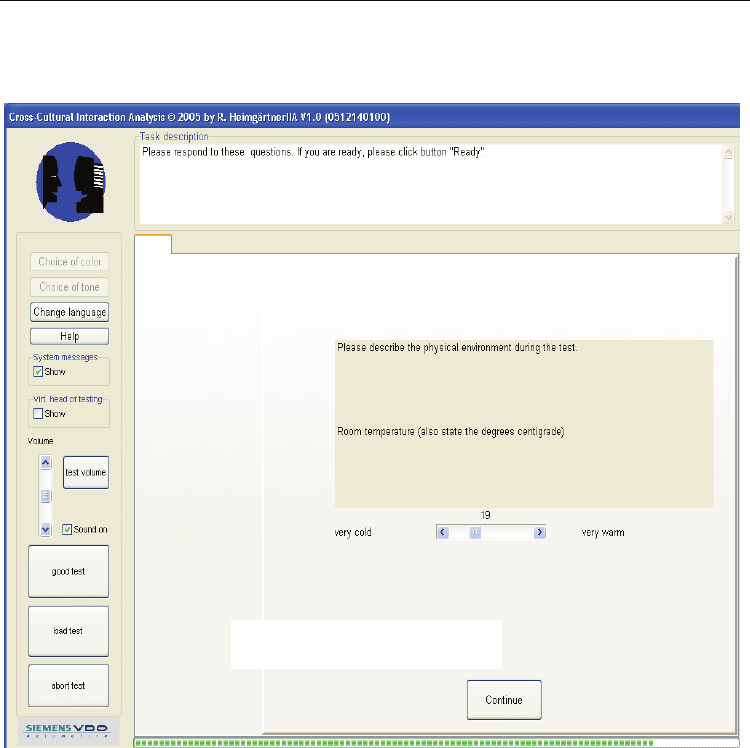
The debriefing part reveals the purpose of the test to the user in greater detail. It collects
data regarding the usability of the test system, the perceived difficulty of the test in general,
Human-Computer Interaction, New Developments
358
if the user has recognized the implemented hypotheses in the test tasks during the test
session, as well as e.g. asking the physical conditions of the test environment (cf. figure 13).
Fig. 13. Asking the user about the conditions of the test environment
5. Data Collection and Data Analysis with the IIA Tool
Two online studies timely separated by one year (in 2006 and 2007) served to verify the
functionality and reliability of the IIA tool and to get the preferences of users according to
their cultural background (especially regarding their interaction behavior). Randomly
selected employees from SiemensVDO (now Continental) all over the world were invited
per email to do the test session using the IIA data collection module by downloading it from
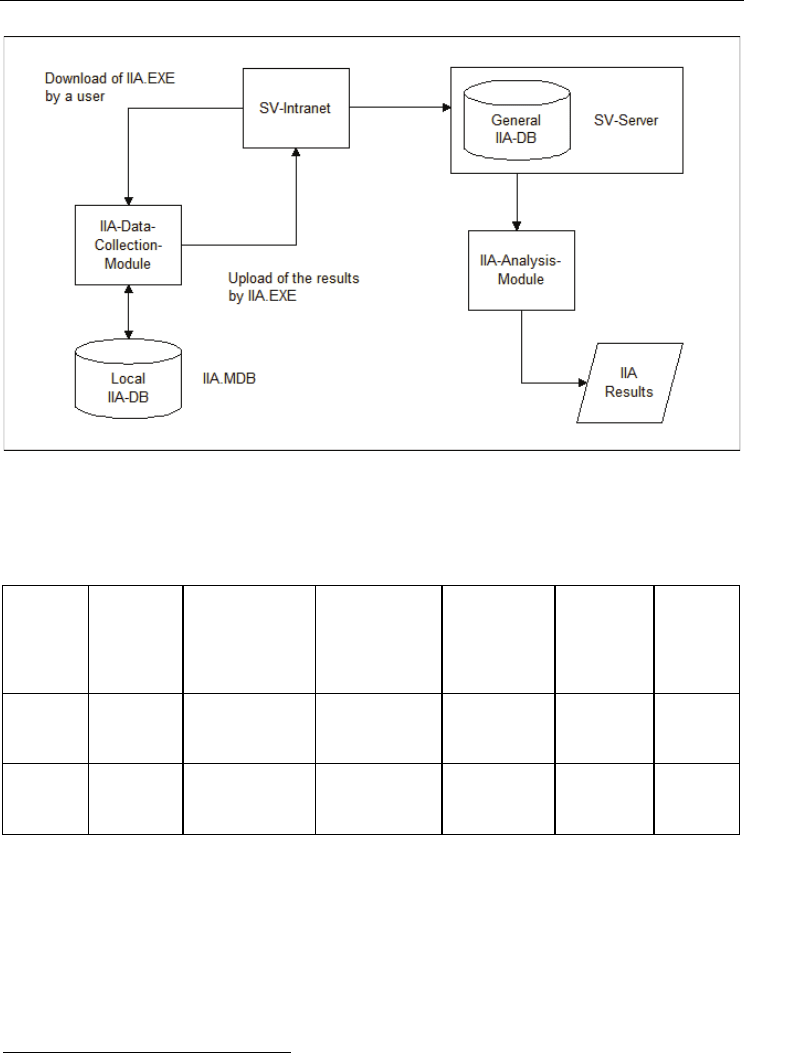
the corporate intranet. The test participant (Siemens VDO employee) downloaded the IIA
data collection module via the corporate intranet locally on his computer, started the tool
and did all test tasks. Before closing the tool, the collected data has been transferred
automatically onto a non public and secure network drive on a SV server by the IIA tool
(figure 14). Using the IIA data analysis module, the data could have been analyzed there.
A Tool for Getting Cultural Differences in HCI
359
Table 3 characterizes the two online studies regarding sample size, tests downloaded, tests
aborted, valid test data sets, and return rate.
Study
Sample
size
Survey period
Number of
downloaded
tests
Tests
Aborted
[%]
Number
of valid
test
data sets
Return
Rate [%]
1 600
12/14/05 -
01/14/06 166 41,5 102 16,6
2 14500
11/14/06 -
01/19/07 2803 66,8 916 6,3
Table 3. Characterization of the two online studies conducted with the IIA tool
The tests have been aborted due to the following reasons: download time too long
2
, no time
to do the test now, test is not interesting or appealing. This type of qualitative data helped to
optimize the testing equipment and to steer the direction of data analysis by asking the user
for the reasons of his behavior during the test (e.g. by open questions using text boxes). Only
complete and valid data sets have been analyzed using the IIA data analysis module and the
statistic program SPSS (cf. Bortz & Döring, 2005). The discrimination rate of classifying the
2
Notably in China because of slow network connections.
Fig. 14. Course of data collection flow

Human-Computer Interaction, New Developments
360
users to their selected test language by the variables concerning the cultural background of
the user’s mother tongue, nationality, country of birth and primary residence was 83.3% for
the first and 81.9% for the second study.
3
Therefore, the differences in HCI in these studies
have been analyzed in relation to three groups of test persons according to the selected test
languages (Chinese (C), German (G), and English (E)) in order to reduce data analyzing
costs. In the following, I concentrate on the more representative second main study, because
it has been used nine times more valid test data sets (916:102). Furthermore, the second
study almost mirrors the results of the first study. Nevertheless, I will contrast and discuss
the differing results in some detail to be able to deduce the reliability of the IIA tool. Out of
the 14500 test persons invited in the larger second main study, 2803 downloaded and started
the test. The return rate of 19.3% is sufficient for reasonable statistical analysis. 66.8% of the
tests have been aborted. The remaining 33.1% of the tests have been completed and only the
data of these tests has been analyzed using the IIA data analysis module and the statistics
program SPSS. The total remaining amount of valid data sets is 916.
To analyze the collected data, structural equation models have been used. Structural
equation models belong to the statistical methods of conformational factor analysis.
4
In
contrast, explorative factor analysis can be used to determine the correctness of the conducted
classification of the parameters into factors (e.g. informational dimensions). Factor analysis
serves to structure and to select the deduction of the cultural interaction indicators (CII’s) of
the information dimensions for HMI design. The objective of factor analysis is the grouping
and reduction of the information quantity (judgments, questions, variables) simultaneously
ensuring and protecting of information content. The main tasks of factor analysis are:
• Grouping variables to „factors“ according to their correlation strength.
• Identifying variables resp. factors that correlate highly with information related
dimensions or predict them greatly.
• Filtering of variables having low explanation value in regard to the factor or the
informational dimension they represent.
• Resuming variables to indicators on the basis of factor and item analysis as well as
reflections regarding content.
• Deducting indicators representing (parts of) the information related dimensions.
The methods used for these purposes are explorative factor analysis, regression analysis and
item analysis (all feasible in SPSS). The analysis of the empirically collected data comparing
the average values using the IIA analysis module, neural networks, and AMOS
5
revealed
that some of the parameters do really depend on culture.
6. Results: Cultural Interaction Indicators (CII’s) and Patterns (CIP’s)
In the two online studies, some values of the implemented variables in the IIA tool showed
3
The discrimination rate has been calculated using discriminance analysis (cross validated and
grouped, Wilk's Lamda in study 1: λ
1-2
=.072**, λ
2
=.568**, Wilk's Lamda in study 2: λ
1-2
=.192**,
λ
2
=.513**). The level of significance is referenced with asterisks in this chapter (* p<.05, **
p<.01).
4
Cf. Backhaus et al., 2003.
5
AMOS is short for Analysis of MOment Structures. It is a statistical tool for data analysis providing
structural equation modeling (SEM). For further details, please refer to Arbuckle, 2005.