Ahsan A. Two Phase Flow, Phase Change and Numerical Modeling
Подождите немного. Документ загружается.

Numerical Modeling and Experimentation on
Evaporator Coils for Refrigeration in Dry and Frosting Operational Conditions
39
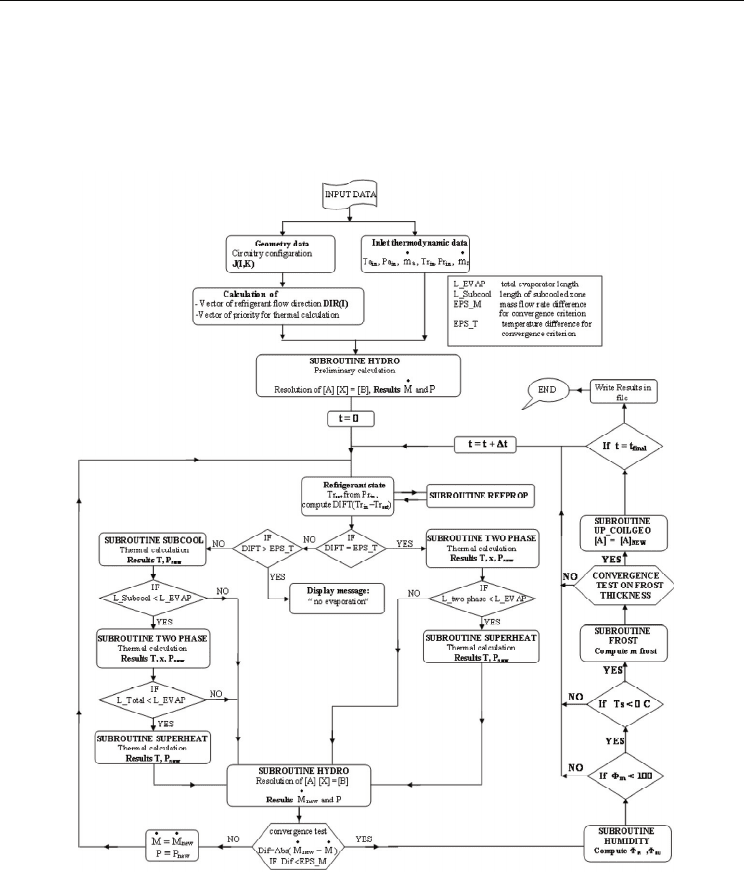
distributed into diffused (m
ρ
) and solidified (m
δ
) mass parts. Next, the program calls the
subroutine UPCOILGEO to update the geometric configuration of the heat exchanger (outer
tube diameter, fin thickness, convective heat transfer area, free flow area) and stores the
information in respective matrices. By considering the most recent geometry resulting from
frost deposition over a time step, the hydrodynamic, thermal and psychometric calculations are
repeated for each time step Δt until the total working period of the heat exchanger is covered.
3.2 Experimental validation
In the first instance, results from the FMT and ISWS procedures were compared as part of
the model validation process. For dry and frosting conditions further comparison was
respectively performed with the available information from the literature (Kondepudi et al.,
1993b) and with data from the CanmetENERGY’s experimental stand (Ouzzane & Aidoun,
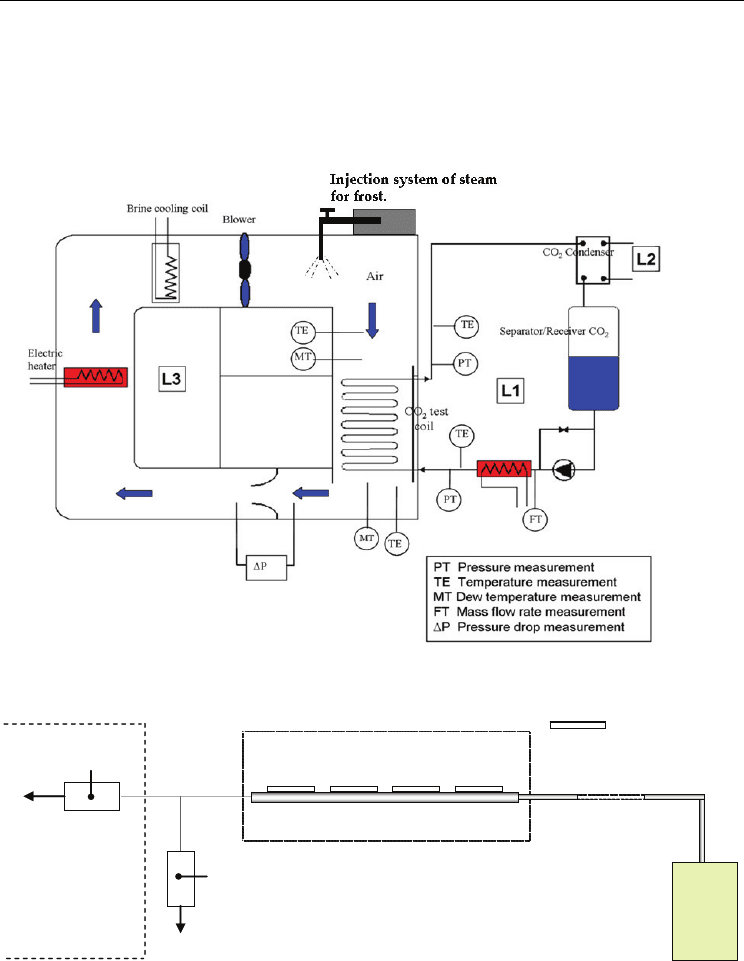
2008). This installation, shown in (Fig.6), complies with ASHRAE standards for forced air
cooling and heating coils (ASHRAE, 2000). Evaporating carbon dioxide is the working fluid
in the loop of interest (L1), which includes a CO
2
pump, a mass flow meter, a CO
2
-air coil
with aluminum wavy fins and copper tubes, a brazed plate condenser and a reservoir for
CO
2
condensate. The loop is well instrumented for the purpose of heat and mass transfer
balances and fluid flow. For a flexible control of temperature and capacity, a brine loop (L2)
was used to cool down the CO
2
condenser. The temperature control of this loop is achieved
by a mechanical refrigeration system (L3). Loop (L1) is located in a closed room with two
compartments corresponding to inlet and outlet of the coil: air flows from one compartment
to the other through a duct enclosing the coil. Air circulation is maintained by a blower. The
compartments are well insulated in order to reduce infiltration of outside air and moisture.
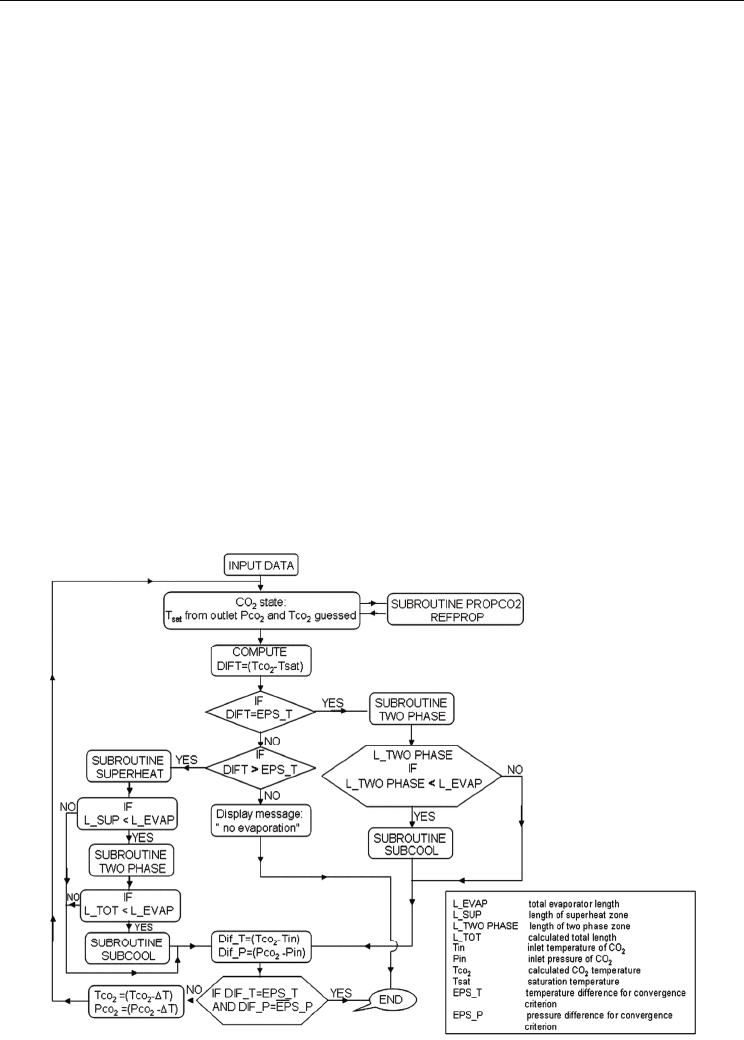
Fig. 4. Flow chart of the computing procedure for FMT
Two Phase Flow, Phase Change and Numerical Modeling
40
Means of adjusting air temperature and humidity conditions at the duct inlet are provided
by a brine cooler, electric heating and a steam generator. Both compartments are equipped
with temperature, pressure, flow and dew point sensors set in accordance with ASHRAE
standards (ASHRAE, 1987). The coil is 0.22 m deep with a face area of 0.61m x 0.32 m. The
configuration employed is similar to that represented on Figure1 and has eight rows of ten
tubes, 8.7 mm internal diameter, 4 fins per inch, arranged in one circuit.
Fig. 5. Flow chart of the computing procedure for ISWS
At temperatures of -10
o
C and -15
o
C as used here, air absorbs only a very low quantity of
vapour. Therefore, it is very difficult to vary and to control air humidity at the evaporator
coil entrance. The steam injected in the test chamber instantaneously freezes on the walls
and injector orifice. For this reason the injection system is designed to ensure sufficient
steam superheat and residence time for it to be absorbed by the ambient air. (Fig. 7) shows a
schematic of the steam injection. Saturated vapour produced in the generator flows in an
insulated pipe to an electrical superheater. The desired level of superheat and the required
Numerical Modeling and Experimentation on
Evaporator Coils for Refrigeration in Dry and Frosting Operational Conditions
41
steam quantities result from a combined adjustment of the heaters and the solenoid valves
for the steam injection and water drainage. Operation of the heaters is controlled to ensure
the required temperature for the injected steam. Presented below are some comparison
examples and validations performed. For dry surfaces, four different experimental cases are
selected, with their operating conditions summarized in Table 1.
Fig. 6. Schematic diagram of CanmetENERGY test set-up
Steam
generator
35 kW
Su
p
erheater
1,2 kW 1,2 kW 0,94 kW 0,94 kW
Electrical heater
To drain
Injection
into test chamber
Solenoid valve
(Open when steam
is injected)
Solenoid valve
Closed when steam is
injected
Insulated tube
Test chamber
Fig. 7. Schematic of injection system of steam
In all these cases, the refrigerant is entering the coil in a saturated state with an assumed
quality of 0 %. The results in Table 2 show that the coil capacity predicted by the ISWS
procedure is in good agreement with the experimental data, the maximum discrepancy

Two Phase Flow, Phase Change and Numerical Modeling
42
being less than 6.5 %. Comparison with FMT procedure of (Ouzzane & Aidoun, 2008) shows
differences of less than 14 %.
Table 1. Input conditions for validation
The results show also that the refrigerant pressure drop predicted by ISWS procedure is in
good agreement with the experimental data. The cumulative errors resulting from the
iterative process applied with correlations for pressure drop whose overall uncertainty is ±
50% (Rohsenow et al., 1998) and for the heat transfer coefficient whose uncertainty on the
predictions is ± 40 % (Hwang et al., 1997) are well within the acceptable range. In the
analysis performed by (Ouzzane & Aidoun, 2008), the pressure drop for the saturated
refrigerant flow is strongly affected by the quality of the refrigerant. Since the iterative
process in the present approach is based on tube length increments, and because quality
results from computations, it is possible that surges in quality occur towards the end of the
evaporation process and result in correspondingly high departures of the pressure drop
outside the range covered by the correlations used.
Capacity
(W)
Outlet
quality
ΔP
(kPa)
Outlet
temperature
(
o
C)
Outlet
relative
humidity
(%)
Air CO
2
CO
2
CO
2
Air CO
2
Air
CASE 1
ISWS 4091.0 4112.9 52.8 % 170.2 -22.4 -29.4 -
FMT 4438.3 4530.6 58.0 % 195.2 -23.0 -29.9 -
Experiments
4083.3 - 51.4 % 171.6 -22.4 -29.6 66.0
CASE 2
ISWS 4444.6 4435.2 80.7 % 152.5 -22.9 -30.0 -
FMT 4811.5 4914.1 89.0 % 149.6 -23.5 -29.9 -
Experiments 4471.0 - 75.0 % 132.2 -22.9 -29.6 65.6
CASE 3
ISWS 1402.4 1379.1 32.5 % 29.3 -22.6 -24.5 -
FMT 1557.2 1550.0 36.5 % 38.6 -22.8 -24.8 -
Experiments 1495.9 - 35.5 % 44.4 -22.7 -24.9 76.0
CASE 4
ISWS 5588.8 5590.6 45.3% 195.0 -19.4 -26.6 -
FMT 5869.4 5683.8 47.5% 398.9 -19.8 -30.8 -
Experiments 5458.0 - 43.5 % 303.4 -19.1 -28.8 54.7
Table 2. Comparison of numerical results from two resolution procedures and experiments
Numerical Modeling and Experimentation on
Evaporator Coils for Refrigeration in Dry and Frosting Operational Conditions
43
Air inlet in coil Air outlet in coil
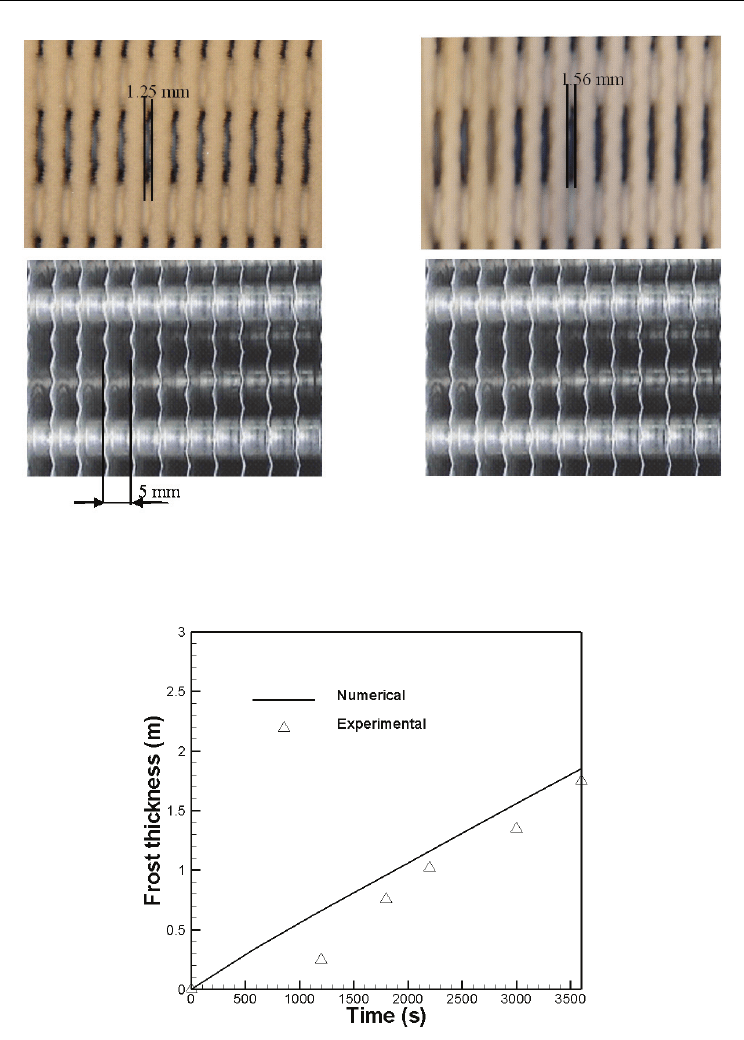
Fig. 8. Pictures showing the frost formed on tubes and fins
Fig. 9. Variation of the frost thickness with time

Two Phase Flow, Phase Change and Numerical Modeling
44
Under frosting conditions, several tests were performed on the test bench at
CanmetENERGY, some of which were selected to validate the theoretical model. From the
pictures taken by digital cameras located at the inlet and outlet of the coil (Fig. 8), the frost
thickness is estimated. The coil with no frost is used as a reference for the scale and the frost
thickness variation with time is shown in (Fig. 8).
Fig. 10. Variation of the air pressure drop with time
Variations of the frost thickness and air pressure drop with time are presented in Fig. 9 and
Fig. 10. As frost accumulates air flow passage cross-sections reduce, thereby increasing the
pressure drop. Agreement between experimental and numerical calculations is quite
satisfactory. The first measurable frost layer thickness is only observed after 20 minutes
from the start. This is due to difficulties in accurately estimating slowly developing frost
layer thicknesses.
4. Simulation results
The developed theoretical tool using FMT and ISWS procedures was used to perform
several studies. An interesting feature is that all relevant operation parameters can be
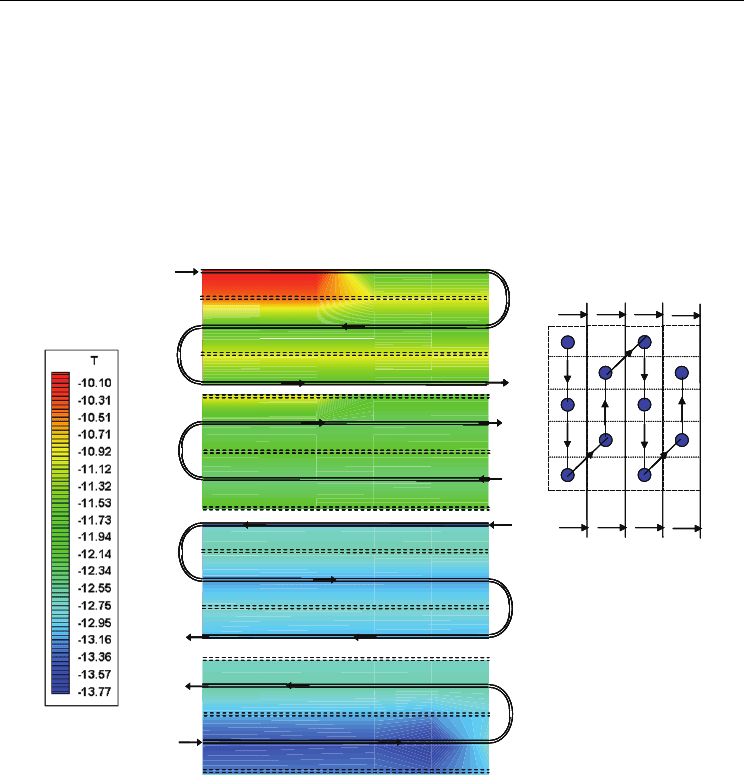
determined locally along the coil and mapped. In the example represented in (Fig. 11),
typical results are shown for the air temperature from inlet to outlet, row after row. The
general tendency towards temperature decrease with the row number can be expected but
the distribution along tube lines is less obvious and will depend on the configuration and
the operating conditions. In the first and the last rows (A-A and D-D sections), we can
clearly see zones where single phase refrigerant prevails. Subcooled liquid and superheated
vapour, are represented in blue and red respectively. The same kind of results can be
presented for relative humidity (Ouzzane & Aidoun, 2004), in which case the locations
where frost formation may first develop are indicated.
Numerical Modeling and Experimentation on
Evaporator Coils for Refrigeration in Dry and Frosting Operational Conditions
45
4.1 Effect of recirculation
Experience from large ammonia refrigeration installations reveals that circulation makes
better use of the evaporators’ surfaces, with enhanced heat transfer and improved overall
system performance. This technique is now being proposed in more modest sizes as well, by
inserting an accumulator in the system. In these systems a separator supplies liquid
refrigerant to the evaporator while saturated vapour is fed to the compressor. At the
evaporator exit saturated refrigerant in the state of liquid-vapour mixture is sent back to the
separator (x<1). The overall impact is a performance improvement through a refrigerant
flow rate increase (with a corresponding internal heat exchange improvement) and a
reduction or elimination of superheat at the compressor suction.
A-A
B-B
C-C
D-D
A
A
B
B
C
C
D
D
A-A
B-B
C-C
D-D
A-A
B-B
C-C
D-D
A-A
B-B
C-C
D-D
A
A
B
B
C
C
D
D
Fig. 11. Typical temperature field inside the coil
However this improvement comes with saturation pressure and related temperature
variations, resulting in property values reductions. These opposing effects are expected to
lead to an optimum circulation ratio with traditional refrigerants and ammonia. Using an
actual installation to obtain data however, imposes limitations on their range and on the
extent of the corresponding parametric analysis that will be derived. In (Ouzzane & Aidoun,
2007), circulation of CO
2
was studied as part of secondary loops with phase change, as
found in supermarkets. The purpose was to investigate the impact of the circulation practice
on heat transfer and heat exchangers performance, through modeling and test bench data
for CO
2
. In the first instance this will be limited to the evaporator. The circulation ratio, N
was varied in the range 1 to 4 and corresponding heat transfer coefficients, internal pressure
drop and saturation temperature variations were obtained. Despite a substantial

Two Phase Flow, Phase Change and Numerical Modeling
46
improvement in heat transfer due to circulation (in the order of 180% for N=4), the coil
capacity remained almost unchanged while pressure drop considerably increased and the
corresponding saturation temperature dropped from 1.7
o
C for N=1 to 6.4
o
C for N=4. In the
following analysis and discussion, two sets of results will be considered. The first set comes
from experiments performed on a test bench with coil characteristics specified in the
previous section. The second set of results comes from simulations. Since the purpose of this
investigation is to study the evaporator coil under the conditions of circulation, operating
conditions are adjusted so that only two-phase flow exists (0 < x < 1). The range of
circulation ratios covered experimentally was from 1 to 5.5 approximately. The coil
geometric specifications are those reported in the above section and operating conditions as
well as resulting performance parameters are recapitulated in Table 3. On the airside
temperature and flow rate were maintained approximately constant. On the CO
2
side
saturation conditions (pressure and temperature) were also maintained approximately
constant while the flow rate was progressively increased. Assuming negligible heat losses to
the surrounding, a heat balance on air and CO
2
allows estimating coil capacity and exit
quality, while pressure drop results from direct measurement. The coil capacity appears to
be quasi-constant despite some fluctuations around 1.5 kW at these conditions. Bearing in
mind that the amplitude of these fluctuations is within the uncertainty range of the
measurements and because of the limited number of data points it is not possible at this
stage to identify a variation tendency.
Circulation ratio N=1.0 N=1.23 N=1.50 N=2.90 N=5.42
CO
2
Mass flow rate (g/s) 5.1 6.23 7.6 14.7 27.5
Tin (C) -24.1 -24.3 -24.1 -24.1 -24.1
x (%) (exit) 100.0 82.8 68.8 36.2 19.7
ΔP (kPa)
10.0 19.5 27.8 45.3 78.1
Air
Tair
in
( C) -20.0 -19.95 -20.0 -20.2 -20.3
Mass flow rate (g/s) 605.1 589 605.7 606.4 603.1
Capacity (kW) 1.48 1.501 1.521 1.534 1.514
Table 3. Results from measurement for different circulation ratios
The pressure drop on the other hand increases very rapidly with circulation ratio. Further
investigation of this effect was performed by simulation of a typical refrigeration case for
supermarket conditions. The coil operating conditions and the corresponding results are
summarized in Table 4 for circulation ratios ranging from 1 to 4.
Circulation affects positively the refrigerant side heat transfer coefficient, as is shown by
(Fig. 12). This is due to the combination of good thermo physical properties of CO
2
and
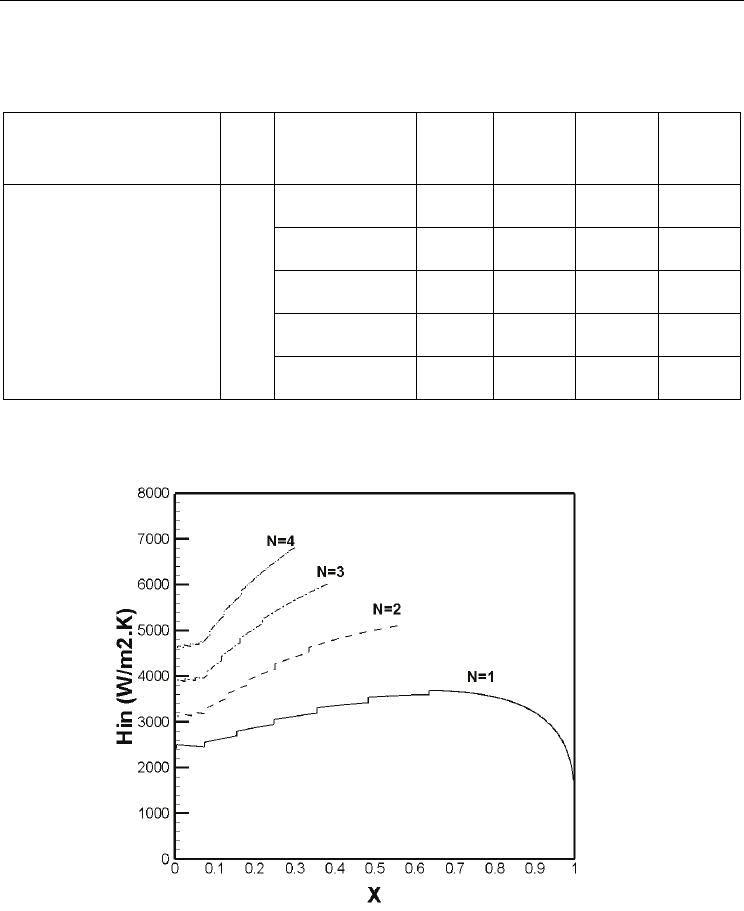
Numerical Modeling and Experimentation on
Evaporator Coils for Refrigeration in Dry and Frosting Operational Conditions
47
increasing flow rates. The increase is at least 85% when going from N=1 to N=4. However,
the maximum local increase of the overall heat transfer coefficient is no more than 10%
(Ouzzane & Aidoun, 2007).
Geometry and
conditions
Circulation
ratio
1 2 3 4
Inner diameter = 8.7mm
Ext. diameter = 9.5mm
Fins (27.8×31.8×0.19)
118 fins/m, L = 90 m
T
co2
=-30C, Tair
in
=-24C
air
m 1.105 (kG /s)
•
=
CO
2
CO2
m(
g
/s)
•
11.6 23.2 34.8 46.4
x (%) (exit) 99.66 55.48 37.99 29.89
ΔP (kPa)
82.66 164.02 220.74 288.26
Q (kW) 3.551 3.774 3.749 3.672
ΔT
CO2
1.744 3.533 4.81 6.3944
Table 4. Calculation results for different circulation ratios
Fig. 12. Internal heat transfer coefficient distribution for different circulation ratios
This is not surprising since the controlling factor is the air side heat transfer, which is known
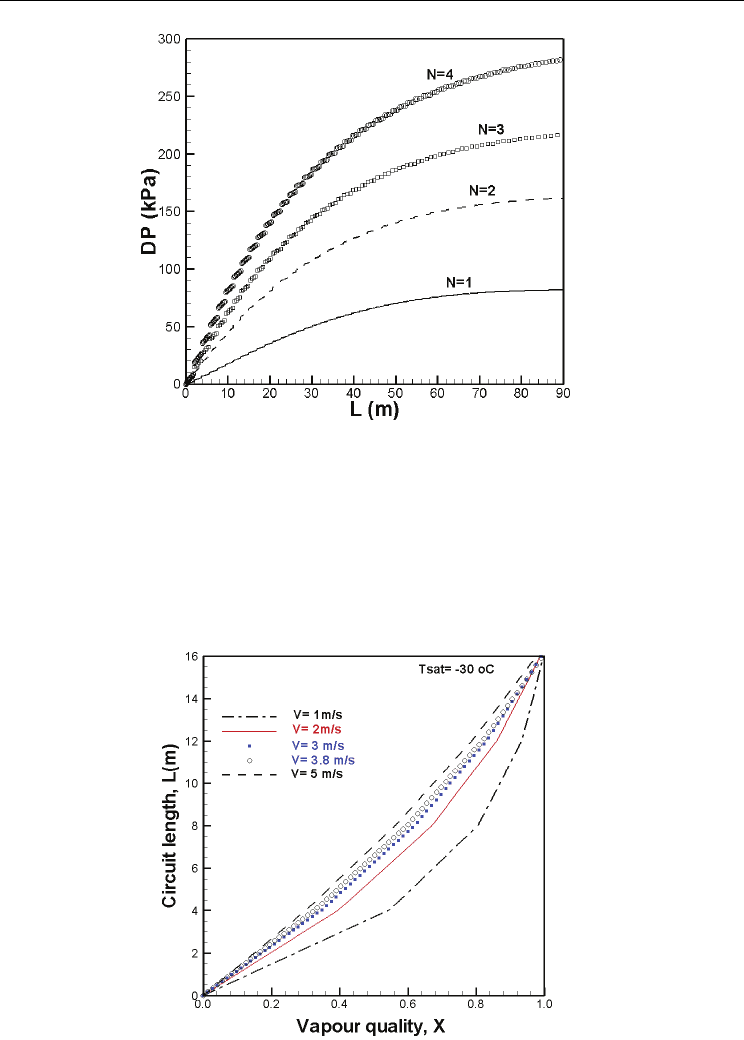
to be limiting. As pointed out earlier, pressure drop increases very rapidly with coil length,
(Fig. 13). Up to 90% of this pressure drop occurs in the first half of the coil, particularly for
lower circulation ratios, where refrigerant qualities are lower. This study was limited to the
coil; however it should be extended to all the system to assess the overall impact.
Two Phase Flow, Phase Change and Numerical Modeling
48
Fig. 13. Internal cumulative pressure drop distribution for different circulation ratios
4.2 Effect of circuiting
Circuiting is an important design factor for performance enhancement, improved flow and
air temperature distribution. By combining tube diameter, fin and circuitry arrangements, it
is possible to maximise heat transfer per unit volume while minimising flow resistance both
internally and externally. Simulations shown in (Fig. 19) and (Fig.20) were obtained for the
following conditions: 16 pass coil, T
r
=-30
o
C, T
a
=-25
o
C and φ=50%.
Fig. 14. Distribution of refrigerant quality in the circuit