Ahsan A. Two Phase Flow, Phase Change and Numerical Modeling
Подождите немного. Документ загружается.


Modeling Solidification Phenomena in the Continuous Casting of Carbon Steels
129
R
C
0.244
33.7
α
−
=⋅ (40)
LL//
0.265 and =( ) /2
δγ
κκκκ
=+ (41)
As described by equations (37) through (41), considering an average equilibrium partition
coefficient κ=0.265 for carbon at the delta/liquid and gamma/liquid phase transformations,
respectively, and a local cooling rate C
R
, solid fraction values can be computed as a function
of mushy-zone temperatures and specific chemical analysis of steel. Dendrites are
characterized by means of the primary λ
PRIM
and secondary λ
SDAS
dendritic arm spacing. The
dependence of both λ
PRIM
and λ
SDAS
spacing on the chemical composition and solidification
conditions is needed for a correct microstructure prediction whose results can be employed
for micro- and macro-segregation appraisal. Primary dendrite arm spacing is related to the
solidification rate r and thermal gradient G in the mushy zone according to the following
formula (Cabrera-Marrero et al, 1998):
PRIM rg
nr G
11
42
λ
−−
=⋅⋅ (42)
Solidification rate r is actually the rate of shell growth:
dS
r
dt
=
(43)
and the thermal gradient G is defined as:
LS
TT
G
w
()−
=
(44)
where w is the width of the mushy zone. It is interesting to note that local solidification
times T
F
are related to the local cooling rates with the expressions:
LS LS LS
F
R
TT TT TT
T
dS
CrG
G
dt
−−−
===
(45)
Furthermore, λ
SDAS
is an important parameter as it plays a great role in the development of
micro-segregation towards the final stage of solidification. For this reason it has received
more attention than λ
PRIM
. Consequently, recalling the work of (Won & Thomas, 2001)
secondary dendrite arm spacing λ
SDAS
(in μm) was computed using the following equation:
R
SDAS
C
R
CC C
CC C
0.4935
(0.5501 1.996 (% ))
0.3616
(169.1 720.9 (% )) for 0 (% ) 0.15
143.9 (% ) for (% ) 0.15
λ
−
−⋅
−
−⋅ ⋅ <≤
=
⋅⋅ >
(46)
4. Results and discussion
For the Stomana slab caster that normally casts slab sizes of 220x1500 mm x mm two
chemical analyses for steel were examined depending on the selected carbon concentrations,
as presented on Table 2.

Two Phase Flow, Phase Change and Numerical Modeling
130
%C %Si %Mn %P %S %Cu %Ni %Cr %Al T
liq
(°C) T
sol
(°C)
0.100 0.30 1.20 0.025 0.015 0.35 0.30 0.10 0.03 1515 1495
0.185 0.30 1.20 0.025 0.015 0.35 0.30 0.10 0.03 1508 1479
Table 2. Steel chemical analyses examined for Stomana
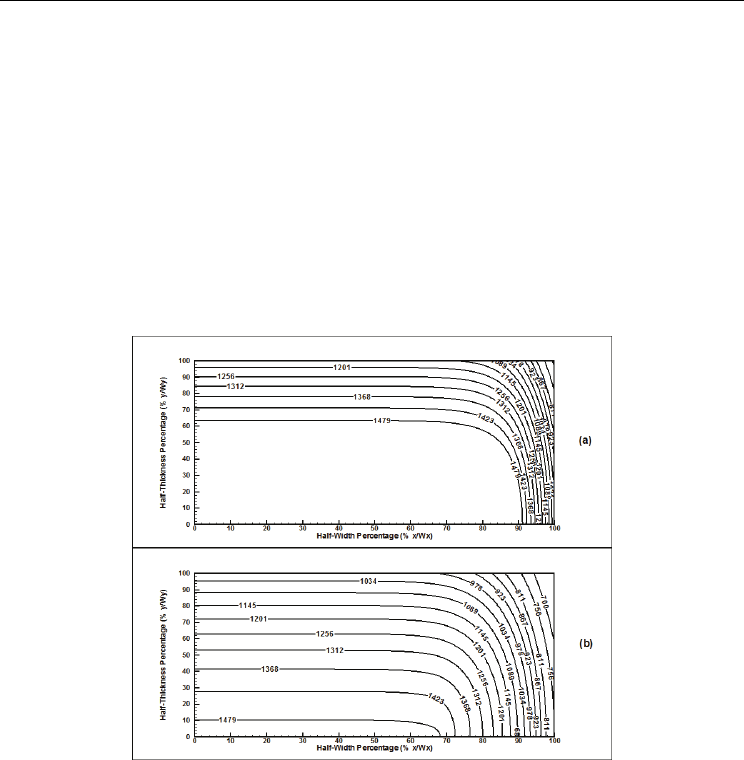
Fig. 1. Temperature distribution in sections of a 220 x 1500 mm x mm Stomana slab, at 5.1 m
for part (a) and 10 m for part (b) from the meniscus, respectively. %C = 0.10; casting speed:
0.80 m/min; SPH: 20 K; solidus temperature = 1495ºC; (all temperatures in the graph are in ºC)
In addition to this, two levels for superheat SPH (=T
cast
-T
L
) were selected at the values of 20K
and 40K. Two levels for the casting speed u
c
were also examined at the 0.6 and 0.8 m/min.
Fig. 1 presents the temperature distribution till solidus temperature inside a slab at two
different positions in the caster; parts (a) and (b) show results at about 5.1 m and 10.0 m
from the meniscus level in the mold, respectively. The dramatic progress of the solidification
front is illustrated. The following casting parameters were selected in this case: %C=0.10,
SPH= 20K, and u
c
= 0.8 m/min. It is interesting to note that the shell grows faster along the
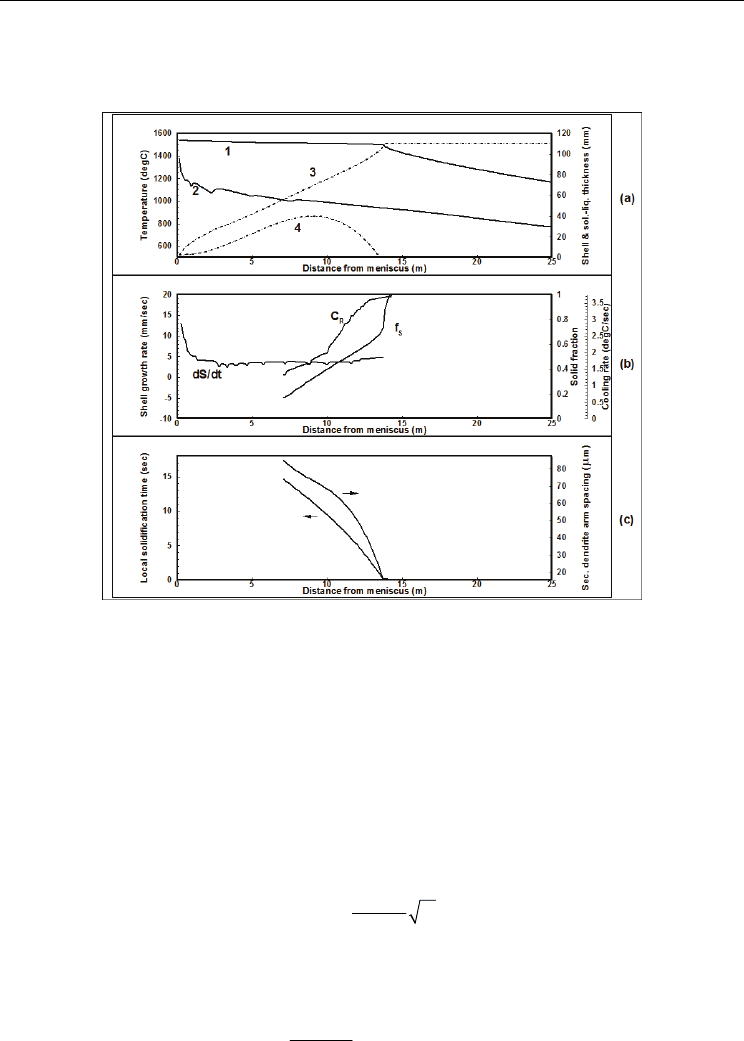
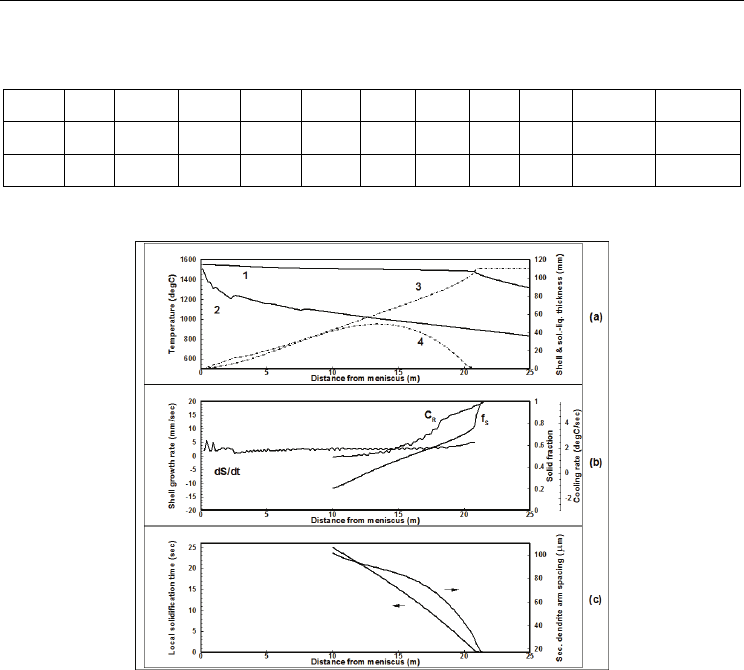
direction of the smaller size, i.e., the thickness than the width of the slab. Fig. 2 presents
some more typical results for the same case. The temperature in the centre is presented by
line 1, and the temperature at the surface of the slab is presented by line 2. The shell
thickness S and the distance between liquidus and solidus w are presented by dotted lines 3
and 4, respectively. In part (b) of Fig. 2 the rate of shell growth (dS/dt), the cooling rate (C
R
),
and the solid fraction (f
S
) in the final stages of solidification are presented. Finally, in part (c)
the local solidification time T
F
, and secondary dendrite arm spacing λ
SDAS
are also presented.
It is interesting to note that the rate of shell growth is almost constant for the major part of
solidification. Computation results show that solid fraction seems to significantly increase
towards solidification completion. Apart from unclear fluid-flow phenomena that may
adversely affect the uniform development of dendrites in the final stages of solidification
Modeling Solidification Phenomena in the Continuous Casting of Carbon Steels
131
and influence the local solid-fraction values, the shape of the f
S
curve at the values of f
S
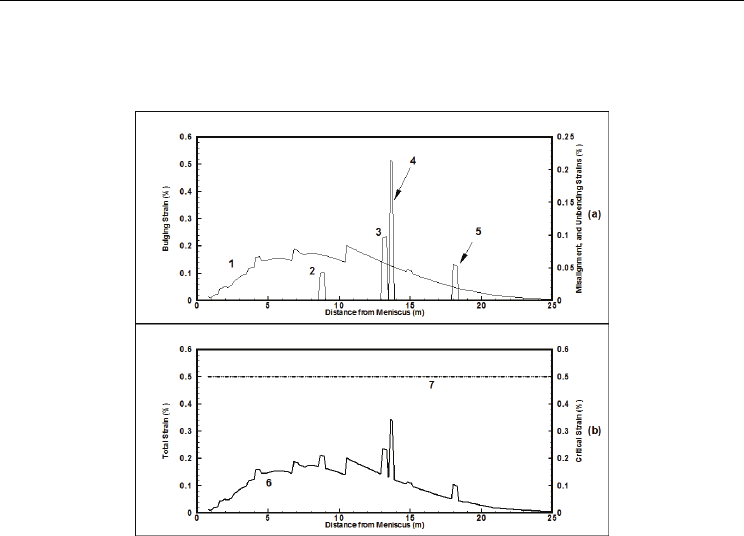
above 0.8 seem to be influenced by the selected set of equations (37)-(41). Fig. 3 depicts
computed strain results along the caster.
Fig. 2. Results with respect to distance from the meniscus: In part (a), lines (1) and (2)
illustrate the centreline and surface temperatures of a 220 x 1500 mm x mm Stomana slab;
lines (3) and (4) depict the shell thickness and the distance between the solidus and liquidus
temperatures; in part (b), the solid fraction f
S
, the local cooling-rate C
R
, and the rate of shell
growth dS/dt are presented; in part (c), the local solidification time and secondary dendrite
arm spacing are depicted, as well. Casting conditions: %C = 0.10; casting speed: 0.80 m/min;
SPH: 20 K; solidus temperature = 1495ºC; (all temperatures in the graph are in ºC)
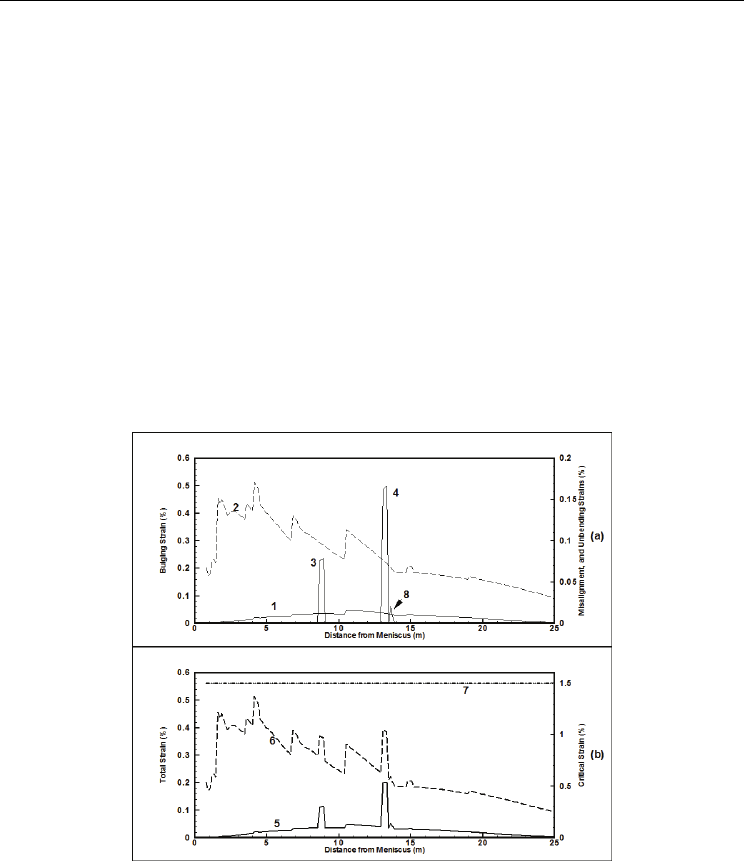
In part (a) of Fig. 3 line 1 depicts the bulging strain along the caster with the aforementioned
formulation. Left-hand-side (LHS) axis is used to present the bulging strain which is also
presented by dashed line 2 with the means of another formulation (Han et al, 2001) which is
presented by the following equations:
PP
BP
e
t
ES
4
,2
3
32
σ
δ
=
(47)
where most parameters were defined in the appropriate section and E
e
is an equivalent
elastic modulus that was calculated using the following equation:
SP
e
S
TT
E
T
4
10 in MPa
100
−
=×
−
(48)
Two Phase Flow, Phase Change and Numerical Modeling
132
Consequently, the bulging strain is computed by equation (20) in which δ
B
is substituted by
δ
B,2
. It seems that the computed results in the latter case are much higher than the ones
computed with the generally applied method as described in 3.1.1. Furthermore, the
recently presented formulation (47)-(48) was proven to be of limited applicability in most
cases for the Sovel slab caster and in some cases in the Stomana caster as it gave rise to
extremely high values for the bulging strain. Coming back to Fig. 3, the right-hand-side
(RHS) axis in part (a) presents the misalignment and unbending strains in a smaller scale. In
order to emphasize the misalignment effect upon the strain two different values, 0.5 mm
and 1.0 mm of rolls misalignment were chosen at two positions, about 8.9 m and 13.4 m,
respectively, along the caster. In this way, these values are depicted by lines 3 and 4 in part
(a) of Fig. 3. The caster radius is 10.0 m while two unbending points with radii 18.0 m and
30.0 m at the 13.5 m and 18.0 m positions along the caster were selected in order to simulate
the straightening process. Line 8 in part (a) of Fig. 3 actually presents the strain from the first
unbending point. The LHS axis in part (b) of Fig. 3 represents the total strains as computed
by the two methods for bulging strain and illustrated by lines 5 and 6. In this case, the total
strain is less than the critical strain (as measured on the RHS axis and illustrated by straight
line 7) throughout the caster.
Fig. 3. In part (a), bulging strain (LHS axis), and misalignment and unbending strains (RHS
axis) are illustrated. Bulging strain is depicted by two lines (1) and (2) depending on the
applied formulation: line (1) is based on the formulation presented in section 3.1.1, and line
(2) is based on the formulation described by equations (47) & (48). Lines (3) and (4) depict
the strains resulting from 0.5 mm and 1.0 mm rolls-misalignment, respectively. Line (8)
shows the strain from unbending at this position of the caster. In a similar manner, the total
strains (LHS axis) are presented in part (b); the critical strain (RHS axis) is also, included.
Casting conditions: 220 x 1500 mm x mm Stomana slab;%C = 0.10; casting speed: 0.80
m/min; SPH: 20 K; solidus temperature = 1495ºC
Modeling Solidification Phenomena in the Continuous Casting of Carbon Steels
133
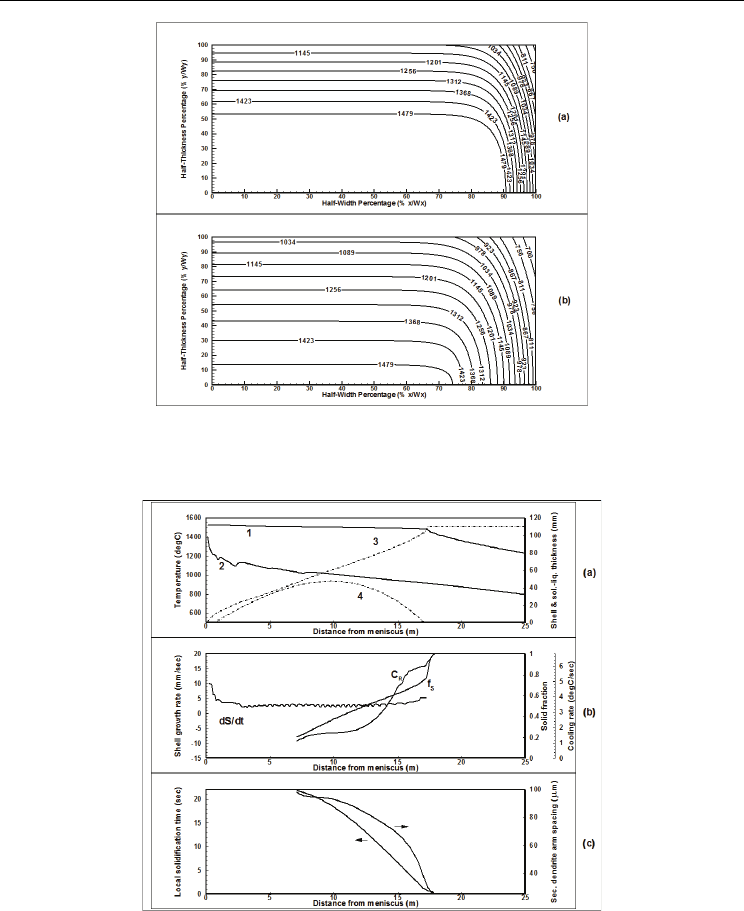
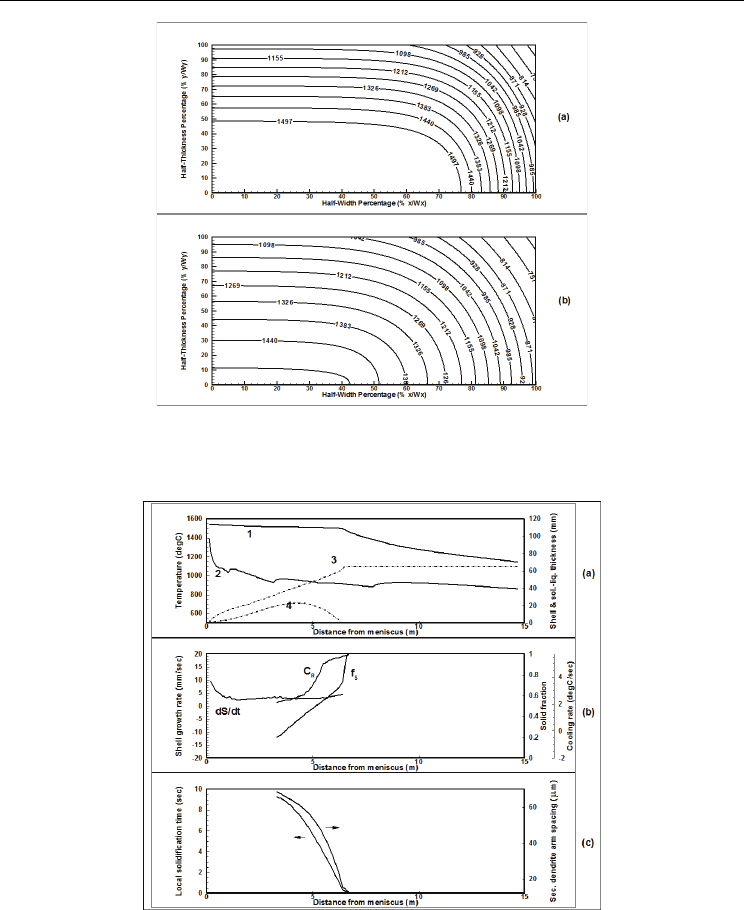
Fig. 4. Temperature distribution in sections of a 220 x 1500 mm x mm Stomana slab, at 8.0 m
for part (a) and 16 m for part (b) from the meniscus, respectively. %C = 0.185; casting speed:
0.80 m/min; SPH: 20 K; solidus temperature = 1479ºC; (all temperatures in the graph are in ºC)
Fig. 5. Results with respect to distance from the meniscus: In part (a), lines (1) and (2)
illustrate the centreline and surface temperatures of a 220 x 1500 mm x mm Stomana slab;
lines (3) and (4) depict the shell thickness and the distance between the solidus and liquidus
temperatures; in part (b), the solid fraction f
S
, the local cooling-rate C
R
, and the rate of shell
growth dS/dt are presented; in part (c), the local solidification time and secondary dendrite
arm spacing are depicted, as well. Casting conditions: %C = 0.185; casting speed: 0.80
m/min; SPH: 20 K; solidus temperature = 1479ºC; (all temperatures in the graph are in ºC)
Two Phase Flow, Phase Change and Numerical Modeling
134
Fig. 4 presents the temperature distribution till solidus temperature inside a slab at two
different positions in the caster; parts (a) and (b) show results at about 8.0 m and 16.0 m
from the meniscus level in the mold, respectively. The following casting parameters were
selected in this case: %C=0.185, SPH= 20K, and u
c
= 0.8 m/min. It is interesting to note that
the shell grows faster along the direction of the smaller size, i.e., the thickness than the
width of the slab. Fig. 5 presents some more typical results for the same case. The
temperature in the centre is presented by line 1, and the temperature at the surface of the
slab is presented by line 2. The shell thickness S and the distance between liquidus and
solidus w are presented by dotted lines 3 and 4, respectively. In part (b) of Fig. 2 the rate of
shell growth (dS/dt), the cooling rate (C
R
), and the solid fraction (f
S
) in the final stages of
solidification are presented. Finally, in part (c) the local solidification time T
F
, and secondary
dendrite arm spacing λ
SDAS
are also presented. It is interesting to note that the rate of shell
growth is almost constant for the major part of solidification.
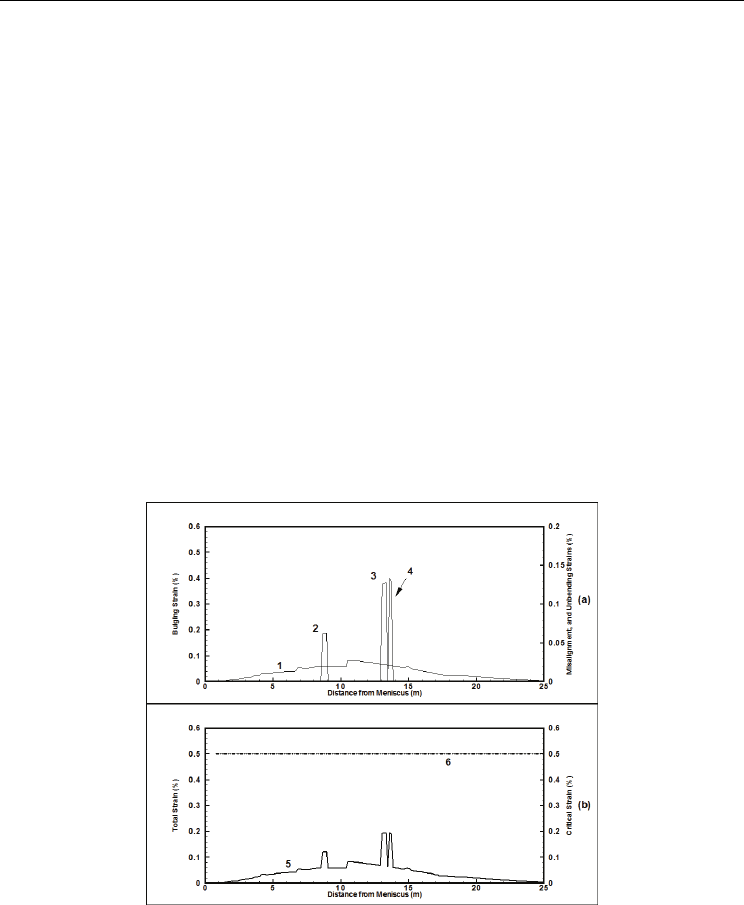
In part (a) of Fig. 6 line 1 depicts the bulging strain along the caster with the aforementioned
formulation. LHS axis is used to present the bulging strain, while the RHS axis in part (a)
presents the misalignment and unbending strains in a smaller scale. The strains due to the
applied misalignment values are depicted by lines 2 and 3 in part (a) of Fig. 6. Line 4
presents the strain from the first unbending point. The LHS axis in part (b) of Fig. 6
represents the total strain and is illustrated by line 5. In this case, the total strain is less than
the critical strain (as measured on the RHS axis and illustrated by straight line 6) throughout
the caster.
Fig. 6. In part (a), bulging strain (LHS axis), and misalignment and unbending strains (RHS
axis) are illustrated. Bulging strain is depicted by line (1); lines (2) and (3) depict the strains
resulting from 0.5 mm and 1.0 mm rolls-misalignment, respectively; line (4) shows the strain
from unbending at this position of the caster. In a similar manner, the total strain (LHS axis)
is presented in part (b); the critical strain (RHS axis) is also, included. Casting conditions:
220 x 1500 mm x mm Stomana slab; %C = 0.185; casting speed: 0.80 m/min; SPH: 20 K;
solidus temperature = 1479ºC
Modeling Solidification Phenomena in the Continuous Casting of Carbon Steels
135
Fig. 7 presents the temperature distribution till solidus temperature inside a slab at two
different positions in the caster; parts (a) and (b) show results at about 9.3 m and 20.0 m
from the meniscus level in the mold, respectively. The following casting parameters were
selected in this case: %C=0.185, SPH=40K, and u
c
= 0.8 m/min. It is interesting to note that
the shell grows faster along the direction of the smaller size, i.e., the thickness than the
width of the slab. Fig. 8 presents some more typical results for the same case. The
temperature in the centre is presented by line 1, and the temperature at the surface of the
slab is presented by line 2. The shell thickness S and the distance between liquidus and
solidus w are presented by dotted lines 3 and 4, respectively. In part (b) of Fig. 2 the rate of
shell growth (dS/dt), the cooling rate (C
R
), and the solid fraction (f
S
) in the final stages of
solidification are presented. Finally, in part (c) the local solidification time T
F
, and secondary
dendrite arm spacing λ
SDAS
are also presented. It is interesting to note that the rate of shell
growth is almost constant for the major part of solidification.
Fig. 7. Temperature distribution in sections of a 220 x 1500 mm x mm Stomana slab, at 9.3 m
for part (a) and 20 m for part (b) from the meniscus, respectively. %C = 0.185; casting speed:
0.80 m/min; SPH: 40 K; solidus temperature = 1479ºC; (all temperatures in the graph are in ºC)
In part (a) of Fig. 9 line 1 depicts the bulging strain along the caster with the aforementioned
formulation. LHS axis is used to present the bulging strain, while the RHS axis in part (a)
presents the misalignment and unbending strains in a smaller scale. The strains due to the
applied misalignment values are depicted by lines 2 and 3 in part (a) of Fig. 9. Line 4
presents the strain from the first unbending point, while line 5 presents the strain from the
second unbending point. The LHS axis in part (b) of Fig. 9 represents the total strain and is
illustrated by line 6. In this case, the total strain is less than the critical strain (as measured
on the RHS axis and illustrated by straight line 7) throughout the caster.
For the Sovel slab caster that normally casts slab sizes of 130x390 and 130x360 (mm x mm)
two chemical analyses for steel were examined depending on the selected carbon
Two Phase Flow, Phase Change and Numerical Modeling
136
concentrations, as presented on Table 3. For the cases presented in this study only the slab
size of 130x390 was examined.
%C %Si %Mn %P %S %Cu %Ni %Cr %V %Al T
liq
(°C) T
sol
(°C)
0.100 0.25 1.20 0.025 0.010 0.28 0.30 0.10 0.05 0.04 1516 1497
0.165 0.25 1.20 0.025 0.010 0.28 0.30 0.10 0.05 0.04 1511 1484
Table 3. Steel chemical analyses examined for Sovel
Fig. 8. Results with respect to distance from the meniscus: In part (a), lines (1) and (2)
illustrate the centreline and surface temperatures of a 220 x 1500 mm x mm Stomana slab;
lines (3) and (4) depict the shell thickness and the distance between the solidus and liquidus
temperatures; in part (b), the solid fraction f
S
, the local cooling-rate C
R
, and the rate of shell
growth dS/dt are presented; in part (c), the local solidification time and secondary dendrite
arm spacing are depicted, as well. Casting conditions: %C = 0.185; casting speed: 0.80
m/min; SPH: 40 K; solidus temperature = 1479ºC; (all temperatures in the graph are in ºC)
Fig. 10 presents the temperature distribution till solidus temperature inside a slab at two
different positions in the caster; parts (a) and (b) show results at about 3.3 m and 6.0 m from
the meniscus level in the mold, respectively. The following casting parameters were selected
in this case: %C=0.10, SPH= 20K, and u
c
= 1.1 m/min. It is interesting to note that the shell
grows faster along the direction of the smaller size, i.e., the thickness than the width of the
slab. Fig. 11 presents some more typical results for the same case. The temperature in the
centre is presented by line 1, and the temperature at the surface of the slab is presented by
line 2. The shell thickness S and the distance between liquidus and solidus w are presented
by dotted lines 3 and 4, respectively. In part (b) of Fig. 11 the rate of shell growth (dS/dt),
the cooling rate (C
R
), and the solid fraction (f
S
) in the final stages of solidification are
Modeling Solidification Phenomena in the Continuous Casting of Carbon Steels
137
presented. Finally, in part (c) the local solidification time T
F
, and secondary dendrite arm
spacing λ
SDAS
are also presented. It is interesting to note that the rate of shell growth is
almost constant for the major part of solidification.
Fig. 9. In part (a), bulging strain (LHS axis), and misalignment and unbending strains (RHS
axis) are illustrated. Bulging strain is depicted by line (1); lines (2) and (3) depict the strains
resulting from 0.5 mm and 1.0 mm rolls-misalignment, respectively; lines (4) and (5) show
the strain from unbending at these positions. In a similar manner, the total strain (LHS axis)
is presented in part (b) as line (6); the critical strain (RHS axis) is also included as line (7).
Casting conditions: 220 x 1500 mm x mm Stomana slab; %C = 0.185; casting speed: 0.80
m/min; SPH: 40 K; solidus temperature = 1479ºC
In part (a) of Fig. 12 line 1 depicts the bulging strain along the caster with the
aforementioned formulation. LHS axis is used to present the bulging strain, while the RHS
axis in part (a) presents the misalignment and unbending strains in a larger scale. The caster
radius is 9.0 m and unbending takes place at a point about 13.5 m apart from meniscus level
with a straightening radius of about 16.0 m. It seems that the computed unbending strains
are relatively low. Due to the small size of the produced slabs the design of the caster has a
relatively small number of rolls at large distances from each other. Roll pitches have values
from 2.5 m up to 3.0 m. In this way the caster is somewhat “forgiving” in the cases that
misalignment gets a bit out of hand. Actually, in this study relatively large misalignment
values from 20 mm up to 50 mm were examined. The strains due to the applied
misalignment values are depicted by line 2 in part (a) of Fig. 12, and seem to be low indeed.
For the Sovel caster, bulging strains were computed by the formulation presented in section
3.1.1; too high values for bulging strains were computed with the formulation presented by
equations (47) and (48). The LHS axis in part (b) of Fig. 12 represents the total strain and is
illustrated by line 3. In this case, the total strain is less than the critical strain (as measured
on the RHS axis and illustrated by straight line 4) throughout the caster.
Two Phase Flow, Phase Change and Numerical Modeling
138
Fig. 10. Temperature distribution in sections of a 130 x 390 mm x mm Sovel slab, at 3.3 m for
part (a) and 6.0 m for part (b) from the meniscus, respectively. %C = 0.10; casting speed: 1.1
m/min; SPH: 20 K; solidus temperature = 1497ºC; (all temperatures in the graph are in ºC)
Fig. 11. Results with respect to distance from the meniscus: In part (a), lines (1) and (2)
illustrate the centreline and surface temperatures of a 130 x 390 mm x mm Sovel slab; lines
(3) and (4) depict the shell thickness and the distance between the solidus and liquidus
temperatures; in part (b), the solid fraction f
S
, the local cooling-rate C
R
, and the rate of shell
growth dS/dt are presented; in part (c), the local solidification time and secondary dendrite
arm spacing are depicted, as well. Casting conditions: %C = 0.10; casting speed: 1.1 m/min;
SPH: 20 K; solidus temperature = 1497ºC; (all temperatures in the graph are in ºC)