Zdunkowski W., Trautmann T., Bott A. Radiation in the atmosphere: A course in Theoretical Meteorology
Подождите немного. Документ загружается.

1.2 The mean global radiation budget of the Earth 5
losses due to turbulent surface fluxes are uncertain within several percent since it is
very difficult to accurately assess the global amount of precipitation which implies
that the estimated sensible heat flux density is also quite uncertain. Only the sum
of the turbulent surface flux densities is reasonably certain.
Finally, we must study the budget of the atmosphere itself. Figure 1.1 reveals
that the atmosphere gains 67 W m
−2
by absorption of solar radiation, 102 W m
−2
by
turbulent surface fluxes, and additionally 350 W m
−2
resulting from long-wave radi-
ation emitted by the surface of the Earth and intercepted by atmospheric greenhouse
gases and clouds. The total of 519 W m
−2
must be re-emitted by the atmosphere.
As shown in the figure, the atmospheric greenhouse gases and the clouds emit
165 + 30 = 195 W m
−2
to space and 324 W m
−2
as back-radiation to the surface
of the Earth just balancing the atmospheric energy gain.
We also see that from the 390 W m
−2
emitted by the Earth’s surface only
350 W m
−2
are intercepted by the atmosphere. To account for the remaining
40 W m
−2
we recognize that these escape more or less unimpeded to space in the
so-called spectral window region as will be discussed later.
By considering the budget in Figure 1.1, we observe that only the reflected solar
radiation and the long-wave radiation emitted to space are actually verified by
measurements. However, the remaining budget components should also be taken
seriously since nowadays radiation models are quite accurate. Nevertheless, the
output of the models cannot be any more accurate than the input data. In future
days further refinements and improvements of the global energy budget can be
expected.
In order to calculate the global radiation budget, we must have some detailed
information on the absorption behavior of atmospheric trace gases and the physical
properties of aerosol and cloud particles. In a later chapter we will study the radi-
ative characteristics of spherical particles by means of the solution of Maxwell’s
equations of electromagnetic theory. Here we will only qualitatively present the
absorption spectrum of the most important greenhouse gases.
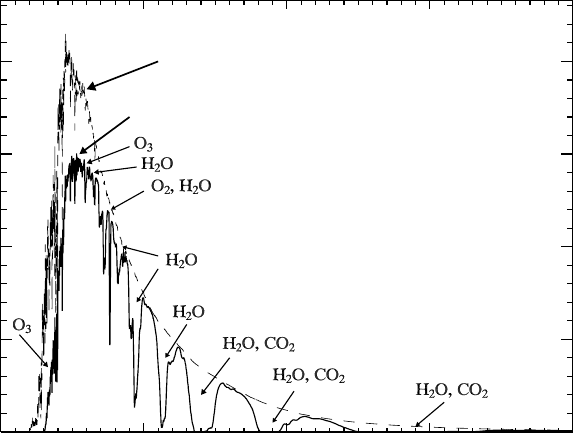
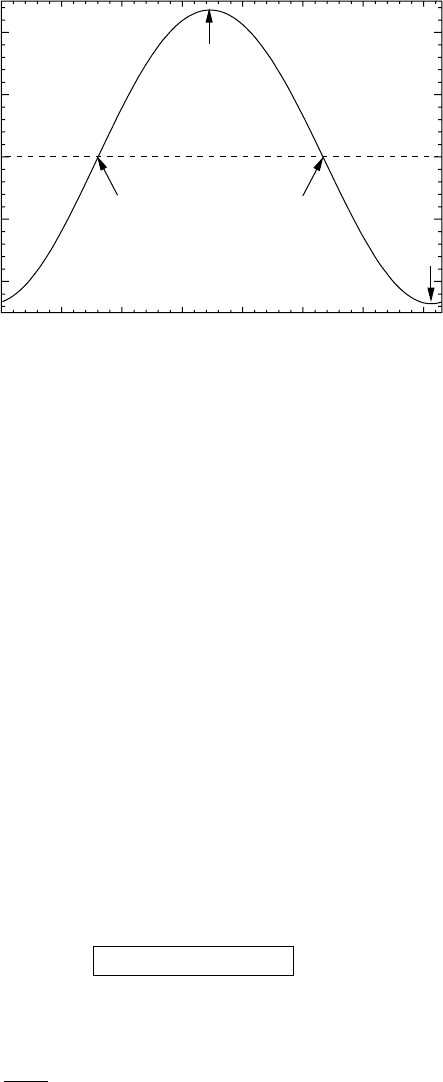
Figure 1.2 combines some important information regarding the solar spectrum.
The upper curve labeled TOA (top of the atmosphere) shows the extraterrestrial
incoming solar radiation after Coulson (1975). For wavelengths exceeding 1.4
µm
this curve coincides closely with a Planckian black body curve of 6000 K. The lower
curve depicts the total solar radiation reaching the Earth’s surface for a solar zenith
angle θ
0
= 60
◦
. The calculations were carried out with sufficiently high spectral res-
olution using the so-called Moderate Resolution Atmospheric Radiance and Trans-
mittance Model (MODTRAN; version 3.5; Anderson, 1996; Kneizys et al., 1996)
program package. All relevant absorbing trace gases shown in the figure are included
in the calculations. Not shown are the positions of the CO and CH
4
absorption bands
which are located in the solar spectrum and in the near infared spectral region of
6 Introduction
0 1 2 3 4
Wavelength (µm)
0
500
1000
1500
2000
Irradiance (W m
−2
µm
−1
)
TOA
surface
Fig. 1.2 Incoming solar flux density at the top of the atmosphere (TOA) and
at ground level. The solar zenith angle is θ
0
= 60
◦
, ground albedo A
g
= 0. The
spectral positions of major absorption bands of the trace gases are shown.
thermal radiation. A tabulation of bands of these two trace gases is given, for exam-
ple, in Goody (1964a). Since the radiation curve for ground level shows a high
spectral variability, it was artificially smoothed for better display to a somewhat
lower spectral resolution.
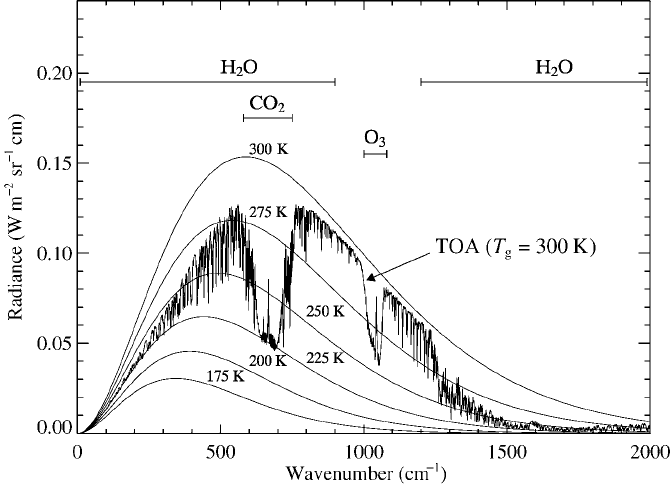
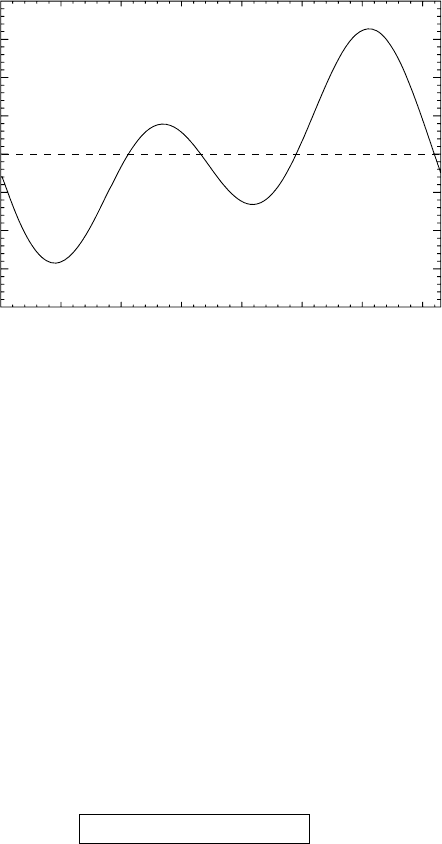
Figure 1.3 depicts the spectral distribution of the upwelling thermal radiance
as a function of the wave number (to be defined later) at a height of 60 km. For
comparison purposes the Planck black body radiance curves for several tempera-
tures are shown also. The maximum of the 300 K black body curve is located at
roughly 600 cm
−1
. The calculations were carried out with the same program pack-
age (MODTRAN) using a spectral resolution of 1 cm
−1
. All relevant absorbing and
emitting gases have been accounted for. The widths of the major infrared absorption
bands (H
2
O, CO
2
,O
3
) are also shown in the figure.
Kiehl and Trenberth (1997) produced similar curves for the solar and infrared
radiative fluxes per unit surface. However, in addition to the absorption by gases
shown in Figures 1.2 and 1.3, they also included the effects of clouds in their
calculations by assuming an effective droplet radius of 10
µm and suitable li-
quid water contents. Moreover, assumptions were made about the spatial distri-
butions of clouds. Their results indicate that water vapor is the most important
1.2 The mean global radiation budget of the Earth 7
Fig. 1.3 Upwelling infrared radiance at a height of 60 km for a clear sky mid-
latitude summer atmosphere.
gas absorbing 38 W m
−2
of solar radiation which is followed by O
3
(15Wm
−2
)
and O
2
(2 W m
−2
) while the effect of CO
2
may be ignored. Thus the greenhouse
gases absorb 55 W m
−2
. Figure 1.1, however, requires 67 W m
−2
. The 12 W m
−2
still
missing must be attributed to partial cloudiness and to spectral overlap effects, i.e.,
cloud droplets and gases absorb at the same wavelength. Handling clouds in the
radiative transfer problem is usually very difficult since in general water droplet
size distributions are unknown.
Finally, let us consider the gaseous absorption bands of the infrared spectrum.
In the calculations of Kiehl and Trenberth (1997) analogous to Figure 1.3, the
surface is assumed to emit black body radiation with a temperature of 15
◦
C. The
major absorbing gases are H
2
O, O
3
, and CO
2
. Of course, the same distribution of
absorbing gases and clouds as for solar radiation is assumed. Integration of the
infrared curve at the top of the atmosphere over the entire spectral region yields
235 W m
−2
as required by Figure 1.1.
We conclude this section by considering a simple example to obtain the effec-
tive emission temperature of the system Earth’s surface–atmosphere. As we have
discussed above, the cross-section of the Earth intercepts the solar energy π R
2
S
0
.
Since the global albedo is 31%, the rate of absorption is 1368(1− 0.31) =
944 W m
−2
. Assuming that the Earth emits black body radiation, we must apply the
8 Introduction
a
a
b
F
1
F
2
January 3rd
April 4th
July 4th
October 5th
Earth
Sun
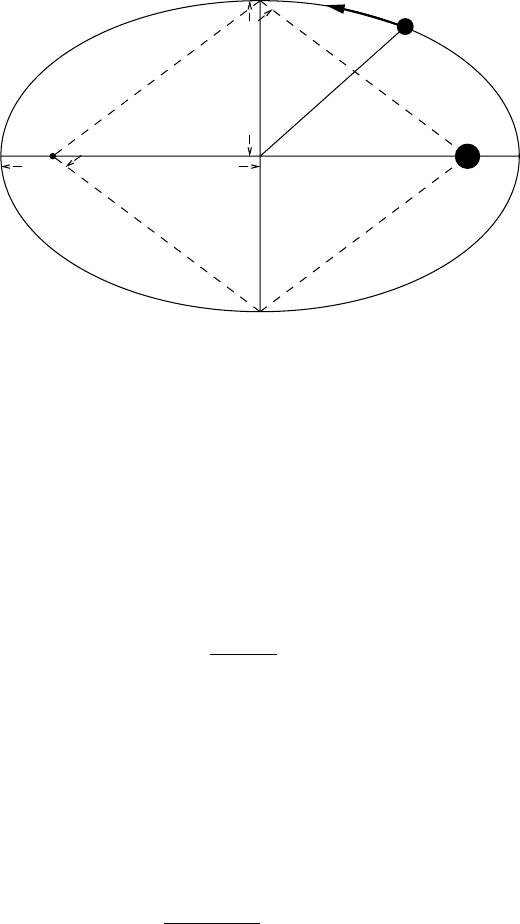
Fig. 1.4 Simplified elliptical geometry of the Earth’s orbit.
well-known Stefan–Boltzmann law so that the Earth’s surface emits 4π R
2
σ T
4
where σ is the Stefan–Boltzmann constant. Assuming steady-state conditions,
we have π R
2
× 944Wm
−2
= 4π R
2
σ T
4
from which we obtain the temperature
T = 254 K which resembles the effective emission temperature of our planet.
1.3 Solar–terrestrial relations
To a high degree of accuracy the Earth’s orbit around the Sun can be described by
an ellipse with eccentricity e =
√
a
2
− b
2
/a = 0.01673, where a and b are, respec-
tively, the semi-major and semi-minor axis of the ellipse, see Figure 1.4. The Sun’s
position is located in one of the two elliptical foci (F
1
, F
2
). For demonstration pur-
poses, the figure exaggerates the eccentricity of the elliptical orbit. The perihelion,
that is the shortest distance r
min
between Sun and Earth, occurs around January
3rd, while the aphelion, that is the largest distance r
max
between Sun and Earth, is
registered around July 4th. These times are not constant, but they vary from year to
year. Often the mean distance between the Earth and the Sun is approximated by
a =
r
min
+r
max
2
= 1.496 × 10
8
km (1.1)
The distances r
min
and r
max
are related to a and e via
r
min
=a(1 −e) = 1.471 × 10
8
km
r
max
=a(1 +e) = 1.521 × 10
8
km
(1.2)

1.3 Solar–terrestrial relations 9
Beginning with January 1st, i.e. Julian day number 1 of the year, a normal year
counts 365 days (for simplicity we will not take the occurrence of leap years into
account). A particular day of the year is then labelled with its corresponding Julian
day number J .
We introduce the rotation angle of the Earth beginning with the 1st of January
as
=
2π
365
(J − 1) (1.3)
where is expressed in radians.
During the course of the year the angular distance Sun–Earth, the solar declina-
tion δ, and the so-called equation of time E T change in a more or less harmonic
manner. In the following we will discuss simple expressions developed by Spencer
(1971) which are accurate enough to evaluate the quantities (a/r)
2
, δ, and ET,
where r is the actual distance between Sun and Earth. The term (a/r)
2
is given by
a
r
2
= 1.000110 + 0.034221 cos + 0.001280 sin
+ 0.000719 cos 2 + 0.000077 sin 2 (1.4)
with a maximum error of approximately 10
−4
.IfS
0
= 1368 W m
−2
is the solar
constant for the mean distance between Sun and Earth, the actual solar constant
varies as a function of J
S
0
(J ) = S
0
a
r(J )
2
(1.5)
According to (1.4) the maximum change of S
0
(J ) relative to S
0
has an amplitude
of approximately 3.3%.
The solar declination δ is defined as the angle between the Earth’s equatorial
plane and the actual position of the Sun as seen from the center of the Earth. The
Earth’s rotational axis and the normal to the Earth’s plane of the ecliptic make on
average an angle of ε = 23
◦
27
, δ amounts to +23
◦
27
and −23
◦
27
at summer sol-
stice (around June 21st) and winter solstice (around December 22nd), respectively.
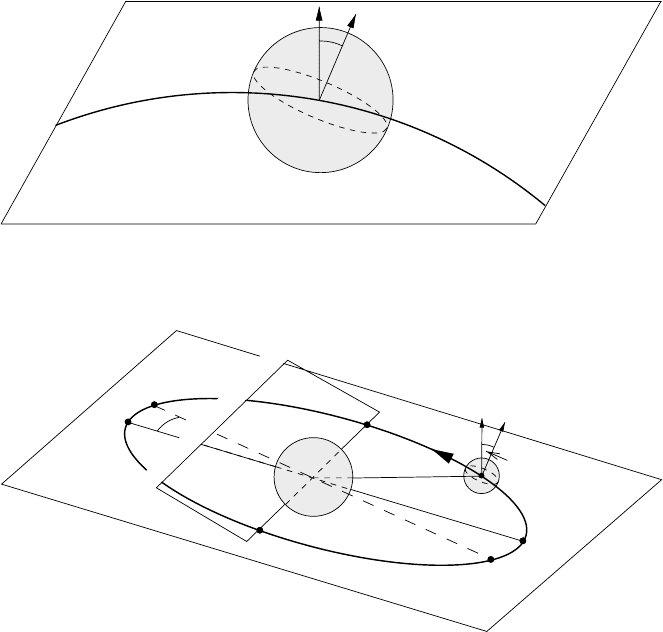
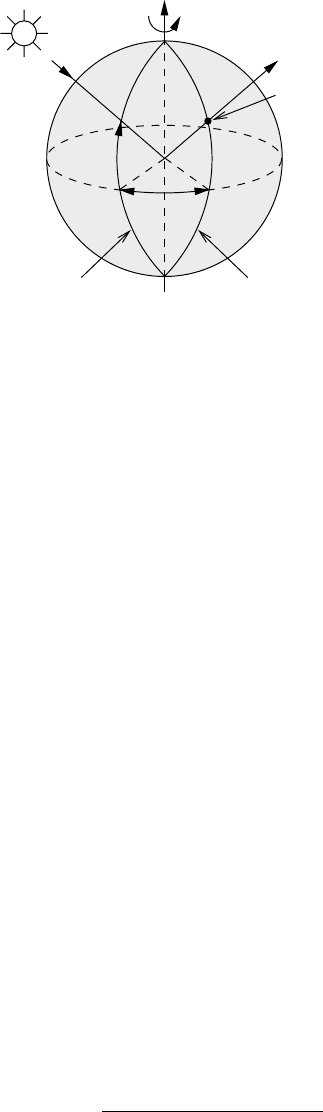
These relations are illustrated in Figure 1.5 and in the three-dimensional view of
the Sun–Earth geometry of Figure 1.6.
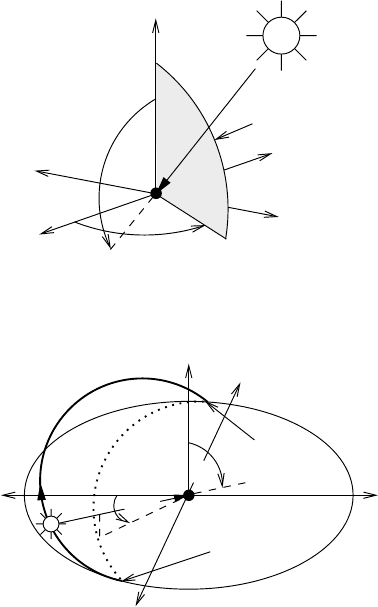
The equinox points are defined as the intersecting line (equinox line) between the
Earth’s plane of the ecliptic and the Sun’s equatorial plane. A second line which is
normal to the equinox line and which is located in the Earth’s plane of the ecliptic
intersects the Earth’s orbit in the points WS (winter solstice) and SS (summer
solstice). The perihelion P and the aphelion A, which both lie on the semi-major
axis of the Earth’s elliptical orbit, make an angle ψ = 11
o
08
with the solstice line.
10 Introduction
n
N
Equator
Earth’s ecliptic plane
Earth’s orbit
ε
Fig. 1.5 Relation between the Earth’s orbit, the normal vector n to the plane of the
ecliptic, the Earth’s rotational vector N and the angle of the ecliptic ε.
Earth
VE
AE
Sun
Earth’s ecliptic plane
Sun’s equatorial plane
A
SS
N
n
P
WS
ψ
ε
Fig. 1.6 Schematical view of the Sun–Earth geometry. P, perihelion; VE, vernal
equinox; SS, summer solstice; A, aphelion; AE, autumnal equinox; WS, winter
solstice; ε, angle of the ecliptic; ψ, angle between the distances (SS, WS) and
(A, P); N, vector along the rotational axis of the Earth; n, normal unit vector with
respect to the Earth’s plane of the ecliptic.
It should be observed that the vector N is fixed in direction pointing to the polar
star. At the solstices the vectors N, n and the line between the solstice points lie
in the same plane so that δ =±23
o
27
. At the equinox points (δ = 0
o
) the line
between the Earth and the Sun is at a right angle to the line (SS, WS).
The solar declination δ is a function of the Julian day number J . It can be
expressed as
δ = 0.006918 − 0.399912 cos + 0.070257 sin
− 0.006758 cos 2 + 0.000907 sin 2 (1.6)
with δ expressed in radians. Due to Spencer (1971) this approximate formula has
an error in δ less than 12
. Figure 1.7 depicts a plot of δ versus J .
1.3 Solar–terrestrial relations 11
0 50 100 150 200 250 300 350
−20
−10
0
10
20
Day of the year
WS
VE
SS
AE
Solar declinatio n ( )
˚
Fig. 1.7 Variation of the solar declination δ as a function of the Julian day J,
see (1.6). VE, vernal equinox; SS, summer solstice; AE, autumnal equinox; WS,
winter solstice.
1.3.1 The equation of time
In the following we assume that the period of the rotation of the Earth around the
North Pole is constant. The time interval between two successive passages of a
fixed star as seen from the local meridian of an observer on the Earth’s surface is
called a sidereal day. Due to the fact that the Earth moves around the Sun in an
elliptical orbit, the time interval between two successive passages of the Sun in the
local meridian, i.e. the so-called solar day, is about 4 min longer than the length of
the sidereal day.
For a practical definition of time, one introduces the so-called mean solar day
which is exactly divided into 24-h periods. Thus the local noon with respect to
the local mean time (LMT) is defined by the passage of a mean fictitious Sun
as registered from the Earth observer’s local meridian. Clearly, depending on the
Julian day J the real Sun appears somewhat earlier or later in the local meridian
than the fictitious Sun. The time difference between the noon of the true solar time
(TST) and the noon of the local mean time (LMT) is the so-called equation of
time E T
ET = TST − LMT
(1.7)
Following the analysis of Spencer (1971), a functional fit expression can be derived
for ET in the form
ET =
1440
2π
(0.000075 + 0.001868 cos − 0.032077 sin
− 0.014615 cos 2 − 0.040849 sin 2) (1.8)
12 Introduction
50 100 150 200 250 300 350
−20
−15
−10
−5
0
5
10
15
20
0
Day of the year
Equation of time
Fig. 1.8 Variation of the equation of time ET (in minutes) during the course of
the year as given by (1.8).
where ET is expressed in minutes and 1440 is the number of minutes per day. The
accuracy of this approximation is better than 35 s. The maximum time difference
between TST and LMT amounts to less than about ±15 min. Figure 1.8 depicts
the variation of ET during the course of the year. Note that the irregularities of the
Earth’s orbit around the Sun lead to a complicated shape of the functional form of
ET versus J .
Universal time U T ,orGreenwich mean time G MT , is defined as the LMT at
Greenwich’s (UK) meridian at 0
◦
in longitude. Since 24 h cover an entire rotation
of the Earth, LMT increases by exactly 1 h per 15
◦
in eastern longitude, i.e. 4 min
per degree of eastern longitude. Similarly, LMT decreases by 4 min if one moves
by one degree of longitude in the western direction. For the true solar time we thus
obtain the relation
TST = UT + 4λ + ET
(1.9)
where TST, UT, and ET are given in minutes and the longitude λ is in units of
degree (−180
◦
<λ≤ 180
◦
).
The hour angle of the Sun H is defined as the angle between the local observer’s
meridian and the solar meridian, see Figure 1.9. If H is expressed in degrees
longitude one obtains
H = 15(12 − TST) (1.10)
where TST has to be inserted in hours. Note that H > 0 in the morning and H < 0
in the afternoon.
1.3 Solar–terrestrial relations 13
Solar meridian
Local meridian
Local vertical
Observer
N
H
δ
Fig. 1.9 Relation between hour angle H , solar declination δ, the solar and the local
meridian.
The local standard time L ST is defined as the local mean time for a given merid-
ian being a multiple of 15
◦
away from the Greenwich meridian (0
◦
). Therefore, LST
and UT differ by an integral number of hours. For particular countries, differences
of 30 and 45 min relative to the standard time meridians have been introduced for
convenience. Note also that for locations with daylight saving time, the local mean
time differs by 1 to 2 h relative to LST.
1.3.2 Geographical coordinates and the solar position
A particular point P on the Earth’s surface is identified by the pair of geographi-
cal coordinates (λ, φ), where λ is the longitude and φ is the latitude. Note that φ
is counted positive in the northern hemisphere and negative in the southern hemi-
sphere. The coordinates of the Sun relative to P are defined by the solar zenith angle
ϑ
0
and the solar azimuth angle ϕ
0
. If the Sun is at the zenith we have ϑ
0
= 180
◦
,
and ϑ
0
= 90
◦
if it is at the horizon, see Figure 1.10. The solar height h is given by
h = ϑ
0
− π/2. The solar azimuth ϕ
0
is defined as the angle between the solar ver-
tical plane and a vertical plane of reference which is aligned with the north–south
direction. Here, ϕ
0
= 0
◦
if the Sun is exactly over the southern direction and ϕ
0
is
counted positive in the eastward direction. Figure 1.11 depicts the apparent track
of the Sun during the day.
The position angles (ϑ
0
,ϕ
0
) of the Sun are usually not measured directly and must
be determined from other known angles. Utilizing the laws of spherical trigonom-
etry it can be shown that the following relations are valid
(a) cos(π − ϑ
0
) = sin ϕ sin δ + cos ϕ cos δ cos H
(b) cos ϕ
0
=
cos(π − ϑ
0
) sin ϕ − sin δ
sin(π − ϑ
0
) cos ϕ
(1.11)
14 Introduction
N
E
S
W
Sun vertical
P
Zenith
ϕ
0
ϑ
0
Fig. 1.10 Coordinates defining the position of the Sun.
N
W
E
S
Sunrise
Sunset
P
Zenith
ϕ
0
ϑ
0
Fig. 1.11 Apparent solar track during the course of the day. The dotted curve marks
the projection of the solar path onto the horizontal plane.
At solar noon at any latitude we have H = 0. In this case we obtain from (1.11a)
(π − ϑ
0
) = ϕ − δ. At sunrise or sunset at any latitude ϑ
0
= 90
◦
and H = D
h
. The
term D
h
is also called the half-day length since it is half the time interval between
sunrise and sunset. Excepting the poles we find from (1.11a)
cos D
h
=−tan ϕ tan δ (1.12)
At the equator on all days and at the equinoxes (δ = 0) at all latitudes (with
ϕ =±90
◦
)wefindD
h
= 90
◦
or 6 h. The latitude of the polar night is found by
setting in (1.12) D
h
= 0 so that tan ϕ =−cot δ (with δ = 0) and ϕ(polar night) =
90
◦
−|δ| in the winter hemisphere.
The daily total solar radiation Q
s
incident on a horizontal surface at the top of
the atmosphere is found by integrating the incoming solar radiation over the length