Yang J., Nanni L. (eds.) State of the Art in Biometrics
Подождите немного. Документ загружается.

Optical Spatial-Frequency Correlation System for Fingerprint Recognition
89
sections of the fingerprint are different from each other in the transverse lines of the
fingerprint image.
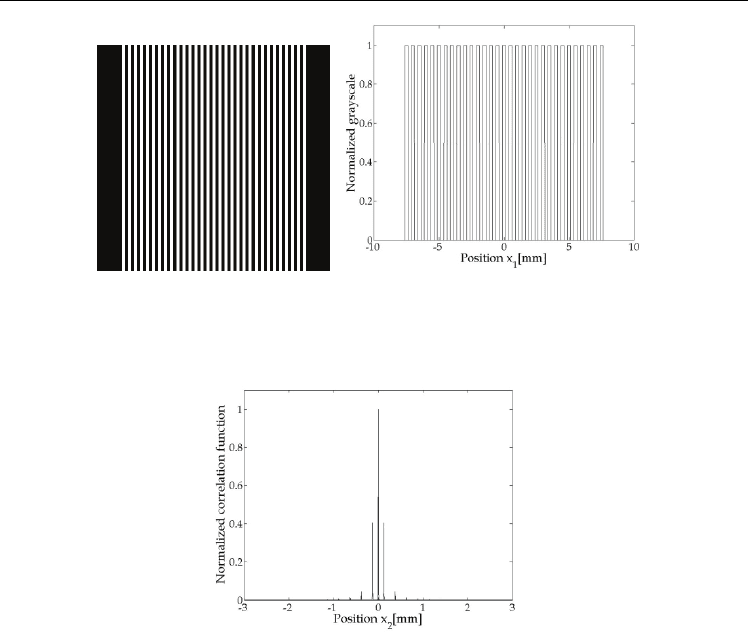
We regard the left side of Fig. 4 as the modeled fingerprint image in order to evaluate the
basic properties of our proposed system. The normalized grayscale distribution in the
transverse line of the modeled fingerprint image is expressed in terms of the 1D finite
rectangular wave shown in the right side of Fig.4. The period of ridges is 0.5mm and the
whole width of the fingertip is 15mm. The normalized grayscale distribution is intentionally
composed of 2048 (2
11
) pixels in order to obtain the correct results of the Fourier Transform.
Concretely, the ridge and valley in the distribution are composed of 25 pixels, respectively.
The interval of neighboring pixels is 0.01mm.
Now we consider the case that the normalized grayscale distributions of subject’s and
enrolled fingerprint images are the same as the 1D finite rectangular wave shown in the
right side of Fig. 4. This case corresponds to the recognition of his or her own. Then, the
spatial-frequency autocorrelation function between the subject’s and enrolled fingerprint
images can be obtained in the output plane P
2
in Fig. 1. We derived it numerically under the
conditions that
λ
=0.6328×10
mm and f=100mm. The obtained intensity distribution of
the spatial-frequency autocorrelation function was normalized by its maximum value. The
normalized intensity distribution is shown in Fig. 5. It has a sharp peak at the center of the
distribution and takes a value of 1. In general, the peak value denotes the degree of spatial-
frequency correlation and takes a value with a range from 0 to 1. The large value means high
spatial-frequency correlation and the small one does low spatial-frequency correlation. In
addition, in this figure, the second maximum value is 0.404 located at x
2
=±0.127mm which
is related strongly to a period of the normalized grayscale distribution of the modeled
fingerprint image, i.e., d =0.5mm and obtained by ±
λ
f/d.
In the following analyses, we evaluate the behavior of the peak value of the normalized
intensity distribution of the SCF between the subject’s and enrolled fingerprint images.
Moreover, we investigate whether our proposed optical system is valid for the fingerprint
recognition or not.
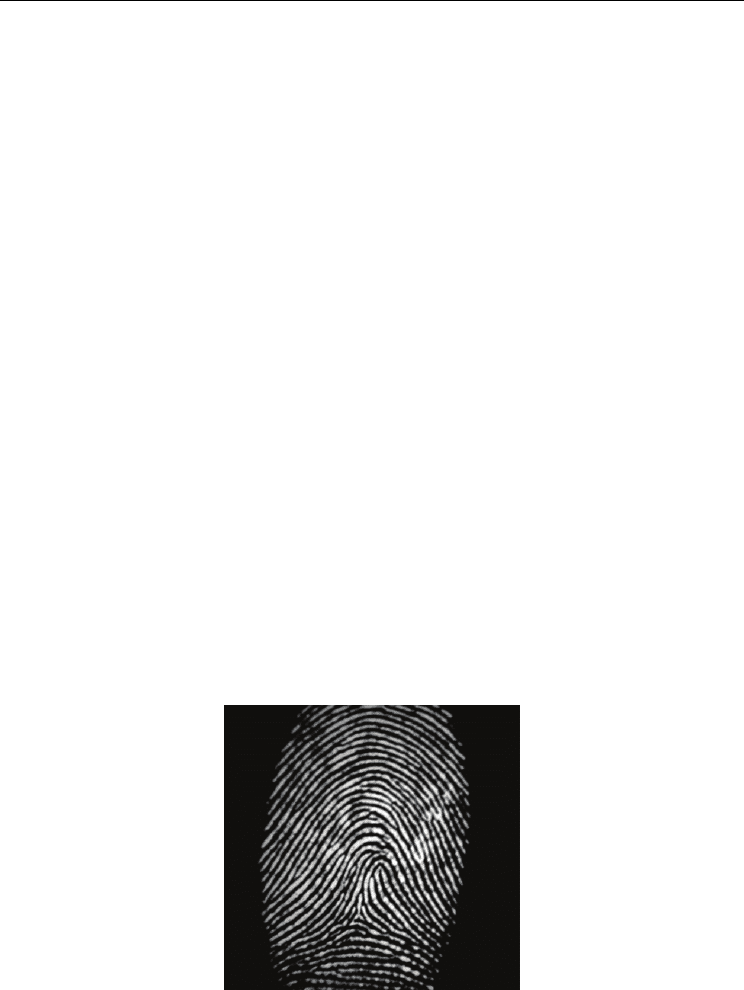
Fig. 3. Example of the fingerprint image used in the FVC2002. The black and white in the
image was reversed.
State of the Art in Biometrics
90
Fig. 4. Modeled fingerprint image (left) and the normalized grayscale distribution in a
transverse line of the image (right). The period is 0.5mm and the whole width of the
fingertip is 15mm.
Fig. 5. Normalized intensity distribution of the spatial-frequency autocorrelation function of
the 1D finite rectangular wave shown in the right side of Fig. 4. The second maximum value
is 0.404 located at x
2
=±0.127mm.
3.2.2 SCF between the modeled fingerprint image and the modified one
In the previous subsection, the normalized grayscale distributions of the subject’s and
enrolled fingerprint images were the same one which was regarded as the 1D finite
rectangular wave shown in the right side of Fig. 4. In this subsection, in order to investigate
the SCF in the case that the subject’s and enrolled fingerprint images are different from each
other, the modified modeled fingerprint images, i.e., the modified finite rectangular waves,
were used. The modified ones were produced by changing the positions of the ridges
randomly from the regular positions of the ridges in the original finite rectangular wave.
Concretely, the positions of ridges were changed obeying a Gaussian random statistics with
zero mean. Moreover, the standard deviation of the variation of the positions of the ridges
was normalized by a period of ridges of the original finite rectangular wave, 0.5mm. We call
it the normalized standard deviation of the positions of ridges, expressed in terms of
.
indicates the difference between the original and modified finite rectangular waves
quantitatively.

Optical Spatial-Frequency Correlation System for Fingerprint Recognition
91
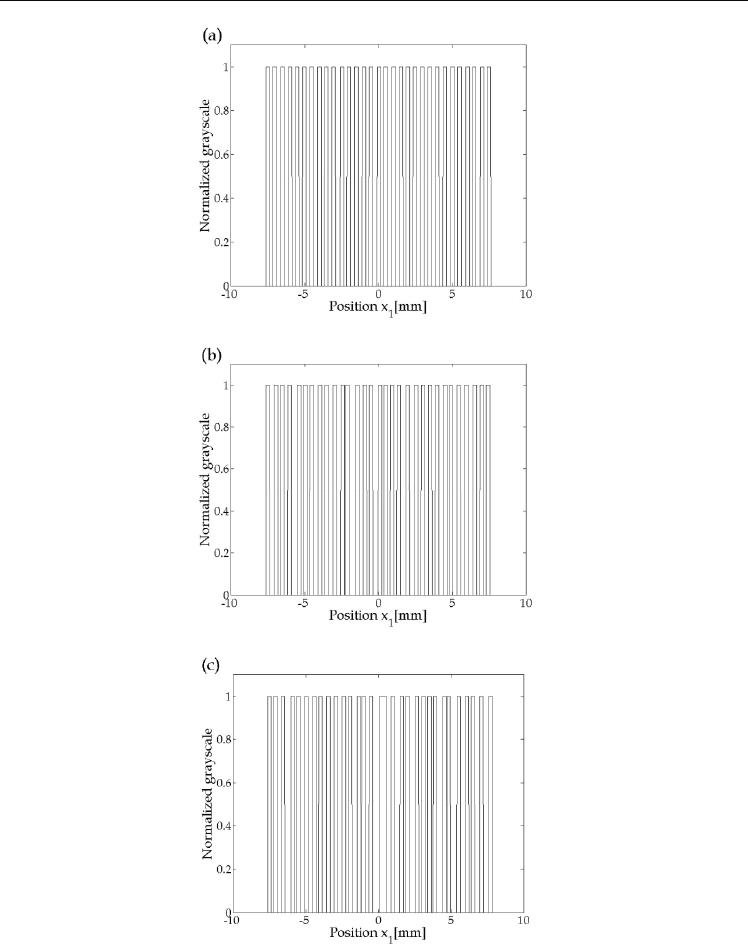
Fig. 6 shows several examples of the normalized grayscale distributions of the modified
modeled fingerprint images. Figs. 6(a), 6(b) and 6(c) correspond to the cases when the
normalized standard deviations
are 0.05, 0.1 and 0.2, respectively. Fig. 7 shows the
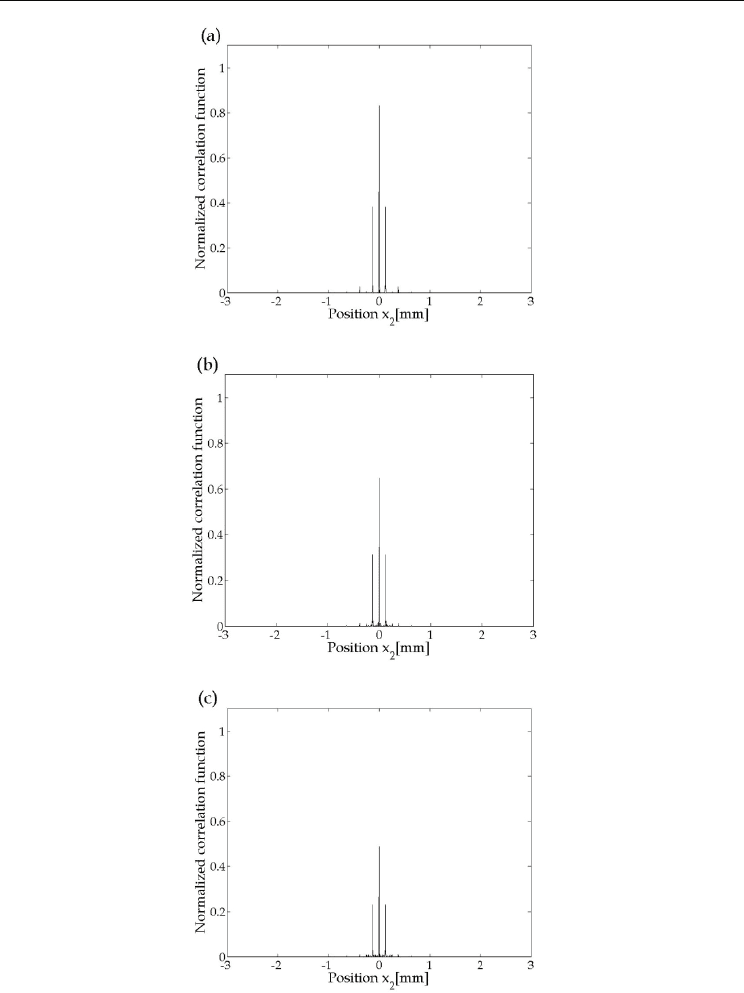
normalized intensity distributions of the SCFs between the original finite rectangular wave
shown in the right side of Fig. 4 and the modified ones shown in Figs. 6(a), 6(b) and 6(c).
Concretely, Figs. 7(a), 7(b) and 7(c) are the results obtained using Figs. 4 and 6(a), Figs. 4 and
6(b) and Figs. 4 and 6(c), respectively. The obtained intensity distributions of the SCFs were
normalized by the square root of the product of the peak value of the spatial-frequency
autocorrelation function of the original finite rectangular wave and the one of the spatial-
frequency autocorrelation function of the modified one. The peak values in Figs. 7(a), 7(b)
and 7(c) are 0.832, 0.648 and 0.489, respectively. This result indicates the fact that the spatial-
frequency correlation between the two fingerprint images gradually becomes low as the
difference between the two becomes large.
Next, in order to investigate the behavior of the peak value of the normalized intensity
distribution of the SCF, 1000 kinds of the modified modeled fingerprint images were used
for each value of
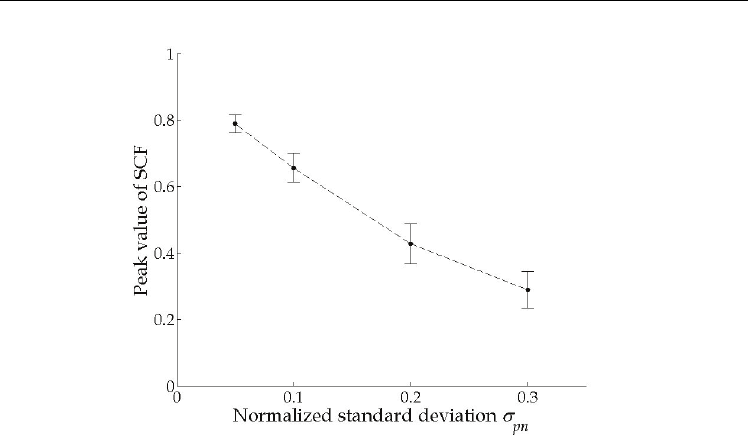
. Fig. 8 indicates the dependence of the peak value of the normalized
intensity distribution of the SCF on the normalized standard deviation of the positions of
ridges of the modified finite rectangular wave,
. The symbol of circle denotes the
averaged peak value of the normalized intensity distribution of the SCF and the error bar
does the standard deviation of the peak values. As shown in the figure, the averaged peak
values when
=0.05, 0.1, 0.2 and 0.3 are 0.789, 0.656, 0.428 and 0.290, respectively. In
addition, the standard deviations of the peak values when
=0.05, 0.1, 0.2 and 0.3 are
0.0261, 0.0431, 0.0604 and 0.0555, respectively. That is, the peak value of the normalized
intensity distribution of the SCF decreases with an increase in the normalized standard
deviation of the positions of the ridges,
. As a result, it was shown quantitatively that the
spatial-frequency correlation between the two fingerprint images becomes low as the
difference between the two becomes large.
In the next subsection, the effect of random noise added to the subject’s fingerprint image on
the peak value of the normalized intensity distribution of the SCF is investigated
quantitatively, in order to evaluate the effects of sweat, sebum and dust, etc., attached at the
fingertip on the fingerprint recognition.
3.2.3 SCF between the modeled fingerprint images with and without random noise
In this subsection, the effect of the random noise corresponding to sweat, sebum and dust,
etc., at the fingertip on the behavior of the peak value of the normalized intensity
distribution of the SCF is analyzed.
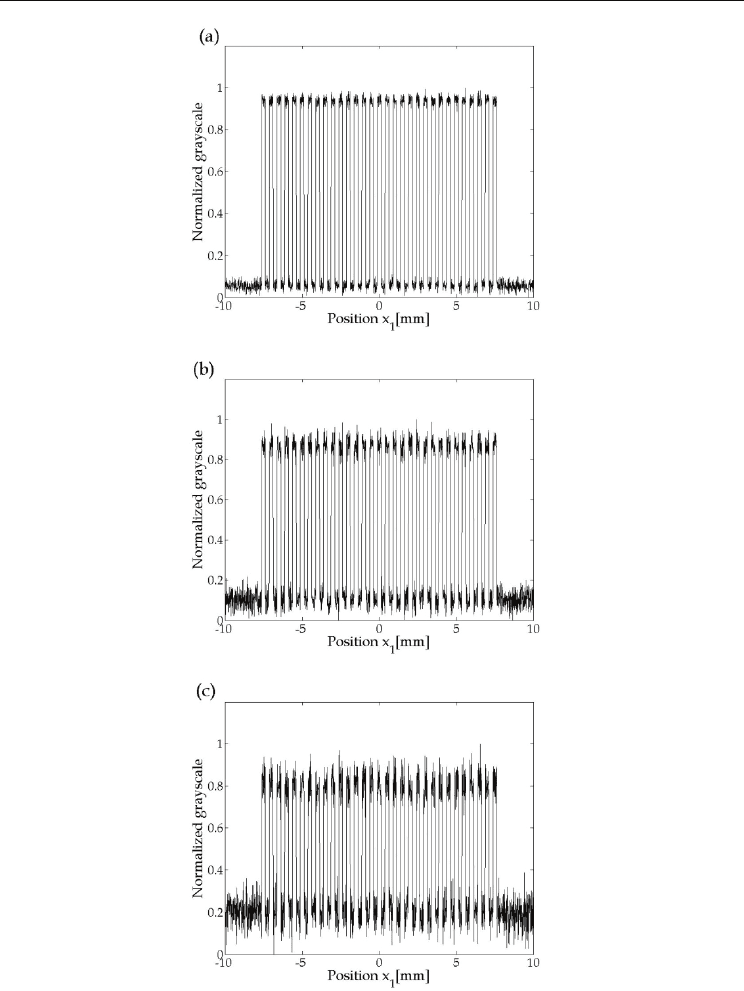
Fig. 9 shows several examples of the normalized grayscale distributions of the modeled
fingerprint images with random noise. Figs. 9(a), 9(b) and 9(c) correspond to the cases when
the standard deviations of the normalized grayscale,
, are 0.02, 0.05 and 0.1, respectively.
To obtain these figures, first, we added the Gaussian random noise with the averaged value
of 0 and the standard deviation of
to the original finite rectangular wave shown in the
right side of Fig. 4. Next, we renormalized the obtained wave so as to have a range from 0 to
1. The reason why the renormalization was performed is that the renormalization of the
grayscale of the fingerprint image would be conducted in the detecting process of a
fingerprint by use of an optical scanner.
State of the Art in Biometrics
92
Fig. 6. Normalized grayscale distributions of the modified modeled fingerprint images when
the normalized standard deviations of the positions of ridges,
, are (a)0.05, (b)0.1 and
(c)0.2, respectively.
is the standard deviation of the variation of the positions of the
ridges of the modified rectangular wave, normalized by a period of ridges of the original
rectangular wave, i.e., 0.5mm.
Optical Spatial-Frequency Correlation System for Fingerprint Recognition
93
Fig. 7. Normalized intensity distributions of the SCFs between the original finite rectangular
wave shown in the right side of Fig. 4 and the modified ones shown in Figs. 6(a), 6(b) and
6(c). The peak values in Figs. 7(a), 7(b) and 7(c) are 0.832, 0.648 and 0.489, respectively.
State of the Art in Biometrics
94
Fig. 8. Dependence of the peak value of the normalized intensity distribution of the SCF on
the normalized standard deviation of the positions of ridges of the modified finite
rectangular wave,
. The averaged peak values for
of 0.05, 0.1, 0.2 and 0.3 are 0.789,
0.656, 0.428 and 0.290, respectively.
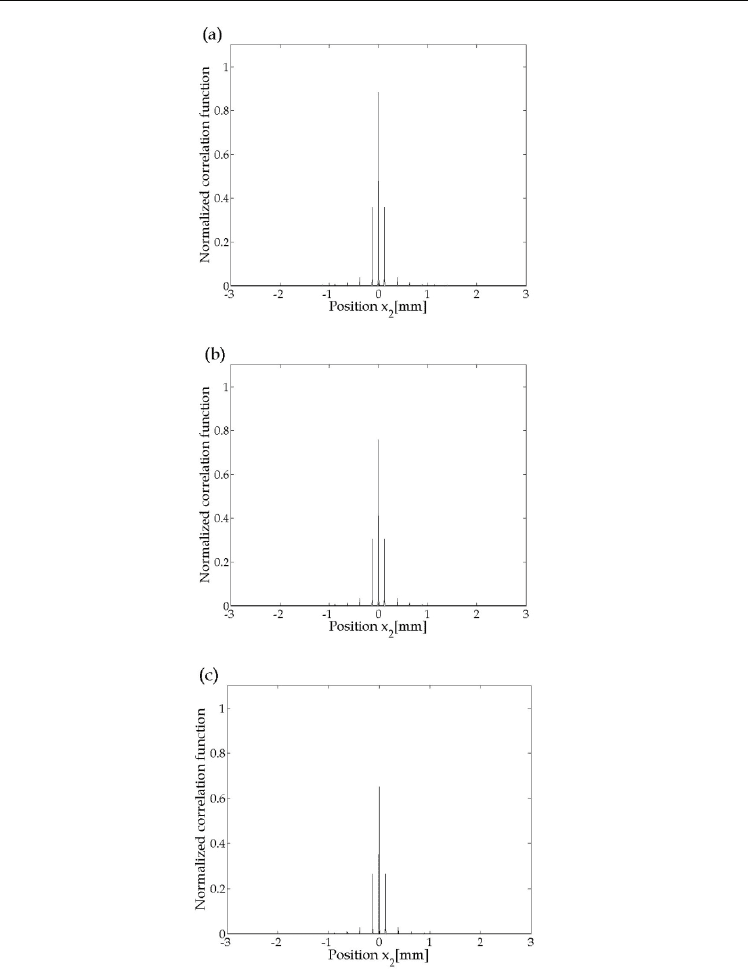
Fig. 10 shows the normalized intensity distributions of the SCFs between the original finite
rectangular wave shown in the right side of Fig. 4 and the ones with the Gaussian random
noise shown in Figs. 9(a), 9(b) and 9(c). Concretely, Figs. 10(a), 10(b) and 10(c) are the results
obtained using Figs. 4 and 9(a), Figs. 4 and 9(b) and Figs. 4 and 9(c), respectively. The peak
values in Figs. 10(a), 10(b) and 10(c) are 0.885, 0.759 and 0.652, respectively. This result
indicates that the spatial-frequency correlation between the two fingerprint images
gradually becomes low as the added random noise becomes large.
Next, in order to investigate the behavior of the peak value of the normalized intensity
distribution of the SCF, 1000 kinds of the modeled fingerprint images with the Gaussian
random noise were used for each value of
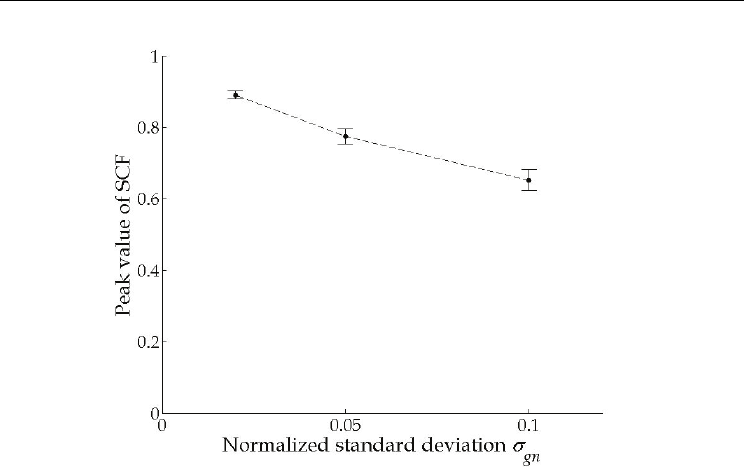
. Fig. 11 indicates the dependence of the peak
value of the normalized intensity distribution of the SCF on the normalized standard
deviation of the added random noise,
. The symbol of circle denotes the averaged peak
value and the error bar does the standard deviation of the peak values. As shown in the
figure, the averaged peak values when
=0.02, 0.05 and 0.1 are 0.891, 0.775 and 0.653,
respectively. In addition, the standard deviations of the peak values when
=0.02, 0.05
and 0.1 are 0.0114, 0.0216 and 0.0294, respectively. That is, the peak value of the normalized
intensity distribution of the SCF decreases with an increase in the normalized standard
deviation of the added random noise,
. As a result, it was shown quantitatively that the
spatial-frequency correlation between the two fingerprint images becomes low as the added
random noise becomes large.
In the next subsection, we analyze the recognition accuracy of the OSC system by use of the
modeled fingerprint images on the basis of the FAR, FRR and MER.
Optical Spatial-Frequency Correlation System for Fingerprint Recognition
95
Fig. 9. Normalized grayscale distributions of the modeled fingerprint images with the
Gaussian random noise when the standard deviations of the normalized grayscale,
, are
(a)0.02, (b)0.05 and (c)0.1, respectively.
State of the Art in Biometrics
96
Fig. 10. Normalized intensity distributions of the SCFs between the original finite
rectangular wave shown in the right side of Fig. 4 and the ones with the Gaussian random
noise shown in Figs. 9(a), 9(b) and 9(c). The peak values in Figs. 10(a), 10(b) and 10(c) are
0.885, 0.759 and 0.652, respectively.
Optical Spatial-Frequency Correlation System for Fingerprint Recognition
97
Fig. 11. Dependence of the peak value of the normalized intensity distribution of the SCF on
the normalized standard deviation of the added random noise,
. The averaged peak
values for
of 0.02, 0.05 and 0.1 are 0.891, 0.775 and 0.653, respectively.
3.2.4 Recognition accuracy for the modeled fingerprint images
First, in order to derive the impostor distribution, for example, we paid attention to the
result for
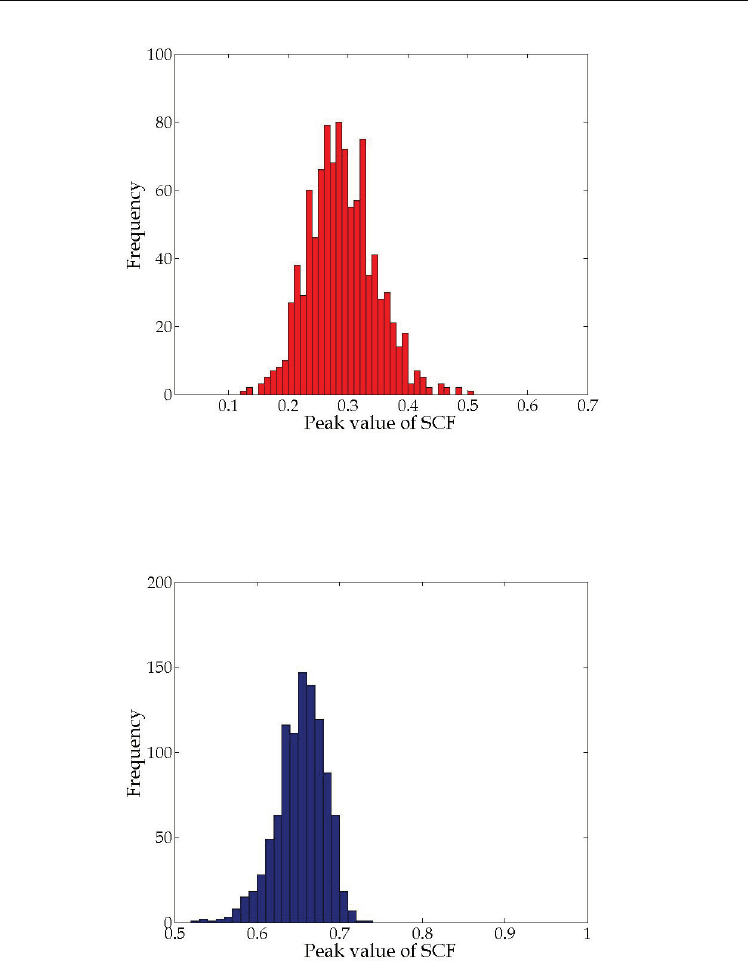
=0.3 in Fig. 8. Fig. 12 indicates the histogram of the peak value of normalized
intensity distribution of the SCF between the original finite rectangular wave and the
modified one with
=0.3. The averaged peak value was 0.290 and the standard deviation
of the peak values was 0.0555 as already described in subsection 3.2.2.
Next, in order to derive the genuine distribution, for example, we paid attention to the result
for
=0.1 in Fig. 11. Fig. 13 indicates the histogram of the peak value of normalized
intensity distribution of the SCF between the original finite rectangular waves with and
without the Gaussian random noise having the averaged value of 0 and
=0.1. The
averaged peak value was 0.653 and the standard deviation of the peak values was 0.0294 as
already described in subsection 3.2.3.
From the frequency distributions shown in Figs. 12 and 13, the impostor and genuine
distributions shown in Fig. 2 can be obtained by fitting the normalized Gaussian
distributions to these frequency distributions. Fig. 14 is the result. The left-side red and
right-side blue curves correspond to the impostor and genuine distributions, respectively. In
this figure, the MER where the FAR and FRR take the same value is 9.34 × 10
% when the
authentication threshold is 0.527. As a result, it was found that the recognition accuracy of
the OSC system is extremely high.
In the next subsection, we analyze the recognition accuracy of the OSC system by use of real
fingerprint images on the basis of the FAR, FRR and MER.
State of the Art in Biometrics
98
Fig. 12. Histogram of the peak value of the normalized intensity distribution of the SCF
between the original finite rectangular wave and the modified one with
=0.3. The
averaged peak value is 0.290 and the standard deviation of the peak values is 0.0555.
Fig. 13. Histogram of the peak value of the normalized intensity distribution of the SCF
between the original finite rectangular waves with and without the Gaussian random noise
having the averaged value of 0 and
=0.1. The averaged peak value is 0.653 and the
standard deviation of the peak values is 0.0294.
