Wooldridge J. Introductory Econometrics: A Modern Approach (Basic Text - 3d ed.)
Подождите немного. Документ загружается.


4.4 Are rent rates influenced by the student population in a college town? Let rent
be the average monthly rent paid on rental units in a college town in the United States. Let
pop denote the total city population, avginc the average city income, and pctstu the student
population as a percentage of the total population. One model to test for a relationship is
log(rent)
0
1
log( pop)
2
log(avginc)
3
pctstu u.
(i) State the null hypothesis that size of the student body relative to the pop-
ulation has no ceteris paribus effect on monthly rents. State the alternative
that there is an effect.
(ii) What signs do you expect for
1
and
2
?
(iii) The equation estimated using 1990 data from RENTAL.RAW for 64 col-
lege towns is
log(rent) (.043) (.066) log(pop) (.507) log(avginc) (.0056) pctstu
(.844) (.039) log(pop) (.081) log(avginc) (.0017) pctstu
n 64, R
2
.458.
What is wrong with the statement: “A 10% increase in population is asso-
ciated with about a 6.6% increase in rent”?
(iv) Test the hypothesis stated in part (i) at the 1% level.
4.5 Consider the estimated equation from Example 4.3, which can be used to study the
effects of skipping class on college GPA:
colGPA (1.39) (.412) hsGPA (.015) ACT (.083) skipped
(.33) (.094) hsGPA (.011) ACT (.026) skipped
n 141, R
2
.234.
(i) Using the standard normal approximation, find the 95% confidence inter-
val for
hsGPA
.
(ii) Can you reject the hypothesis H
0
:
hsGPA
.4 against the two-sided alter-
native at the 5% level?
(iii) Can you reject the hypothesis H
0
:
hsGPA
1 against the two-sided alter-
native at the 5% level?
4.6 In Section 4.5, we used as an example testing the rationality of assessments of hous-
ing prices. There, we used a log-log model in price and assess [see equation (4.47)]. Here,
we use a level-level formulation.
(i) In the simple regression model
price
0
1
assess u,
the assessment is rational if
1
1 and
0
0. The estimated equation is
price 14.47) (.976) assess
pri
ˆ
ce (16.27) (.049) assess
n 88, SSR 165,644.51, R
2
.820.
First, test the hypothesis that H
0
:
0
0 against the two-sided alterna-
tive. Then, test H
0
:
1
1 against the two-sided alternative. What do
you conclude?
Chapter 4 Multiple Regression Analysis: Inference 169

(ii) To test the joint hypothesis that
0
0 and
1
1, we need the SSR in
the restricted model. This amounts to computing
n
i1
(price
i
assess
i
)
2
,
where n 88, since the residuals in the restricted model are just price
i
assess
i
. (No estimation is needed for the restricted model because both
parameters are specified under H
0
.) This turns out to yield SSR
209,448.99. Carry out the F test for the joint hypothesis.
(iii) Now, test H
0
:
2
0,
3
0, and
4
0 in the model
price
0
1
assess
2
lotsize
3
sqrft
4
bdrms u.
The R-squared from estimating this model using the same 88 houses
is .829.
(iv) If the variance of price changes with assess, lotsize, sqrft, or bdrms, what
can you say about the F test from part (iii)?
4.7 In Example 4.7, we used data on nonunionized manufacturing firms to estimate the
relationship between the scrap rate and other firm characteristics. We now look at this
example more closely and use all available firms.
(i) The population model estimated in Example 4.7 can be written as
log(scrap)
0
1
hrsemp
2
log(sales)
3
log(employ) u.
Using the 43 observations available for 1987, the estimated equation is
log(scrap) (11.74) (.042) hrsemp (.951) log(sales) (.992) log(employ)
log(sˆcrap) (4.57) (.019) hrsemp (.370) log(sales) (.360) log(employ)
n 43, R
2
.310.
Compare this equation to that estimated using only the 29 nonunionized
firms in the sample.
(ii) Show that the population model can also be written as
log(scrap)
0
1
hrsemp
2
log(sales/employ)
3
log(employ) u,
where
3
2
3
. [Hint: Recall that log(x
2
/x
3
) log(x
2
) log(x
3
).]
Interpret the hypothesis H
0
:
3
0.
(iii) When the equation from part (ii) is estimated, we obtain
log(scrap) (11.74) (.042) hrsemp (.951) log(sales/employ) (.041) log(employ)
(4.57) (.019) hrsemp (.370) log(sales/employ) (.205) log(employ)
n 43, R
2
.310.
Controlling for worker training and for the sales-to-employee ratio, do big-
ger firms have larger statistically significant scrap rates?
(iv) Test the hypothesis that a 1% increase in sales/employ is associated with
a 1% drop in the scrap rate.
4.8 Consider the multiple regression model with three independent variables, under the
classical linear model assumptions MLR.1 through MLR.6:
y
0
1
x
1
2
x
2
3
x
3
u.
170 Part 1 Regression Analysis with Cross-Sectional Data

You would like to test the null hypothesis H
0
:
1
3
2
1.
(i) Let
ˆ
1
and
ˆ
2
denote the OLS estimators of
1
and
2
. Find Var(
ˆ
1
3
ˆ
2
)
in terms of the variances of
ˆ
1
and
ˆ
2
and the covariance between them.
What is the standard error of
ˆ
1
3
ˆ
2
?
(ii) Write the t statistic for testing H
0
:
1
3
2
1.
(iii) Define
1
1
3
2
and
ˆ
1
ˆ
1
3
ˆ
2
. Write a regression equation
involving
0
,
1
,
2
, and
3
that allows you to directly obtain
ˆ
1
and its
standard error.
4.9 In Problem 3.3, we estimated the equation
sleep (3,638.25) (.148) totwrk (11.13) educ (2.20) age
(112.28) (.017) totwrk (5.88) educ (1.45) age
n 706, R
2
.113,
where we now report standard errors along with the estimates.
(i) Is either educ or age individually significant at the 5% level against a two-
sided alternative? Show your work.
(ii) Dropping educ and age from the equation gives
sleep (3,586.38) (.151) totwrk
(38.91) (.017) totwrk
n 706, R
2
.103.
Are educ and age jointly significant in the original equation at the 5%
level? Justify your answer.
(iii) Does including educ and age in the model greatly affect the estimated
tradeoff between sleeping and working?
(iv) Suppose that the sleep equation contains heteroskedasticity. What does this
mean about the tests computed in parts (i) and (ii)?
4.10 Regression analysis can be used to test whether the market efficiently uses infor-
mation in valuing stocks. For concreteness, let return be the total return from holding
a firm’s stock over the four-year period from the end of 1990 to the end of 1994. The
efficient markets hypothesis says that these returns should not be systematically related
to information known in 1990. If firm characteristics known at the beginning of the
period help to predict stock returns, then we could use this information in choosing
stocks.
For 1990, let dkr be a firm’s debt to capital ratio, let eps denote the earnings
per share, let netinc denote net income, and let salary denote total compensation for
the CEO.
(i) Using the data in RETURN.RAW, the following equation was estimated:
return (14.37) (.321) dkr (.043) eps (.0051) netinc (.0035) salary
(6.89) (.201) dkr (.078) eps (.0047) netinc (.0022) sal
n 142, R
2
.0395.
Test whether the explanatory variables are jointly significant at the 5%
level. Is any explanatory variable individually significant?
Chapter 4 Multiple Regression Analysis: Inference 171

(ii) Now, reestimate the model using the log form for netinc and salary:
return 36.30) (.327) dkr (.069) eps (4.74) log(netinc) (7.24) log(salary)
(39.37) (.203) (.080) (3.39) (6.31)
n 142, R
2
.0330.
Do any of your conclusions from part (i) change?
(iii) How come we do not also use the logs of dkr and eps in part (ii)?
(iv) Overall, is the evidence for predictability of stock returns strong or weak?
4.11 The following table was created using the data in CEOSAL2.RAW:
Dependent Variable: log(salary)
Independent Variables (1) (2) (3)
log(sales) .224 .158 .188
(.027) (.040) (.040)
log(mktval)
—
.112 .100
(.050) (.049)
profmarg
—
.0023 .0022
(.0022) (.0021)
ceoten
——
.0171
(.0055)
comten
——
.0092
(.0033)
intercept 4.94 4.62 4.57
(0.20) (0.25) (0.25)
Observations 177 177 177
R-Squared .281 .304 .353
The variable mktval is market value of the firm, profmarg is profit as a percentage of sales,
ceoten is years as CEO with the current company, and comten is total years with the
company.
(i) Comment on the effect of profmarg on CEO salary.
(ii) Does market value have a significant effect? Explain.
(iii) Interpret the coefficients on ceoten and comten. Are the variables statisti-
cally significant?
(iv) What do you make of the fact that longer tenure with the company, hold-
ing the other factors fixed, is associated with a lower salary?
172 Part 1 Regression Analysis with Cross-Sectional Data

COMPUTER EXERCISES
C4.1 The following model can be used to study whether campaign expenditures affect
election outcomes:
voteA
0
1
log(expendA)
2
log(expendB)
3
prtystrA u,
where voteA is the percentage of the vote received by Candidate A, expendA and expendB are
campaign expenditures by Candidates A and B, and prtystrA is a measure of party strength
for Candidate A (the percentage of the most recent presidential vote that went to A’s party).
(i) What is the interpretation of
1
?
(ii) In terms of the parameters, state the null hypothesis that a 1% increase
in A’s expenditures is offset by a 1% increase in B’s expenditures.
(iii) Estimate the given model using the data in VOTE1.RAW and report the
results in usual form. Do A’s expenditures affect the outcome? What
about B’s expenditures? Can you use these results to test the hypothesis
in part (ii)?
(iv) Estimate a model that directly gives the t statistic for testing the hypoth-
esis in part (ii). What do you conclude? (Use a two-sided alternative.)
C4.2 Use the data in LAWSCH85.RAW for this exercise.
(i) Using the same model as Problem 3.4, state and test the null hypothesis
that the rank of law schools has no ceteris paribus effect on median start-
ing salary.
(ii) Are features of the incoming class of students—namely, LSAT and
GPA—individually or jointly significant for explaining salary? (Be sure
to account for missing data on LSAT and GPA.)
(iii) Test whether the size of the entering class (clsize) or the size of the
faculty ( faculty) needs to be added to this equation; carry out a single
test. (Be careful to account for missing data on clsize and faculty.)
(iv) What factors might influence the rank of the law school that are not
included in the salary regression?
C4.3 Refer to Problem 3.14. Now, use the log of the housing price as the dependent
variable:
log(price)
0
1
sqrft
2
bdrms u.
(i) You are interested in estimating and obtaining a confidence interval for
the percentage change in price when a 150-square-foot bedroom is
added to a house. In decimal form, this is
1
150
1
2
. Use the data
in HPRICE1.RAW to estimate
1
.
(ii) Write
2
in terms of
1
and
1
and plug this into the log(price) equation.
(iii) Use part (ii) to obtain a standard error for
ˆ
1
and use this standard error
to construct a 95% confidence interval.
C4.4 In Example 4.9, the restricted version of the model can be estimated using all 1,388
observations in the sample. Compute the R-squared from the regression of bwght on cigs,
Chapter 4 Multiple Regression Analysis: Inference 173

parity, and faminc using all observations. Compare this to the R-squared reported for the
restricted model in Example 4.9.
C4.5 Use the data in MLB1.RAW for this exercise.
(i) Use the model estimated in equation (4.31) and drop the variable rbisyr.
What happens to the statistical significance of hrunsyr? What about the
size of the coefficient on hrunsyr?
(ii) Add the variables runsyr (runs per year), fldperc (fielding percentage),
and sbasesyr (stolen bases per year) to the model from part (i). Which
of these factors are individually significant?
(iii) In the model from part (ii), test the joint significance of bavg, fldperc,
and sbasesyr.
C4.6 Use the data in WAGE2.RAW for this exercise.
(i) Consider the standard wage equation
log(wage)
0
1
educ
2
exper
3
tenure u.
State the null hypothesis that another year of general workforce experi-
ence has the same effect on log(wage) as another year of tenure with the
current employer.
(ii) Test the null hypothesis in part (i) against a two-sided alternative, at the
5% significance level, by constructing a 95% confidence interval. What
do you conclude?
C4.7 Refer to the example used in Section 4.4. You will use the data set TWOYEAR.RAW.
(i) The variable phsrank is the person's high school percentile. (A higher
number is better. For example, 90 means you are ranked better than 90 per-
cent of your graduating class.) Find the smallest, largest, and average
phsrank in the sample.
(ii) Add phsrank to equation (4.26) and report the OLS estimates in the usual
form. Is phsrank statistically significant? How much is 10 percentage
points of high school rank worth in terms of wage?
(iii) Does adding phsrank to (4.26) substantively change the conclusions on the
returns to two- and four-year colleges? Explain.
(iv) The data set contains a variable called id. Explain why if you add id to
equation (4.17) or (4.26) you expect it to be statistically insignificant.
What is the two-sided p-value?
C4.8 The data set 401KSUBS.RAW contains information on net financial wealth
(nettfa), age of the survey respondent (age), annual family income (inc), family size (fsize),
and participation in certain pension plans for people in the United States. The wealth and
income variables are both recorded in thousands of dollars. For this question, use only the
data for single-person households (so fsize 1).
(i) How many single-person households are there in the data set?
(ii) Use OLS to estimate the model
nettfa
0
1
inc
2
age u,
174 Part 1 Regression Analysis with Cross-Sectional Data

and report the results using the usual format. Be sure to use only the single-
person households in the sample. Interpret the slope coefficients. Are there
any surprises in the slope estimates?
(iii) Does the intercept from the regression in part (ii) have an interesting
meaning? Explain.
(iv) Find the p-value for the test H
0
:
2
1 against H
0
:
2
1. Do you reject
H
0
at the 1% significance level?
(v) If you do a simple regression of nettfa on inc, is the estimated coeffi-
cient on inc much different from the estimate in part (ii)? Why or why
not?
C4.9 Use the data in DISCRIM.RAW to answer this question. (See also Computer
Exercise C3.8 in Chapter 3.)
(i) Use OLS to estimate the model
log(psoda) b
0
b
1
prpblck b
2
log(income) b
3
prppov u,
and report the results in the usual form. Is
ˆ
1
statistically different from
zero at the 5% level against a two-sided alternative? What about at the
1% level?
(ii) What is the correlation between log(income) and prppov? Is each vari-
able statistically significant in any case? Report the two-sided p-values.
(iii) To the regression in part (i), add the variable log(hseval). Interpret its
coefficient and report the two-sided p-value for H
0
: b
log(hseval)
0.
(iv) In the regression in part (iii), what happens to the individual statistical
significance of log(income) and prppov? Are these variables jointly sig-
nificant? (Compute a p-value.) What do you make of your answers?
(v) Given the results of the previous regressions, which one would you
report as most reliable in determining whether the racial makeup of a zip
code influences local fast-food prices?
Chapter 4 Multiple Regression Analysis: Inference 175


Multiple Regression Analysis:
OLS Asymptotics
I
n Chapters 3 and 4, we covered what are called finite sample, small sample, or exact
properties of the OLS estimators in the population model
y
0
1
x
1
2
x
2
...
k
x
k
u.
(5.1)
For example, the unbiasedness of OLS (derived in Chapter 3) under the first four Gauss-
Markov assumptions is a finite sample property because it holds for any sample size n
(subject to the mild restriction that n must be at least as large as the total number of param-
eters in the regression model, k 1). Similarly, the fact that OLS is the best linear unbi-
ased estimator under the full set of Gauss-Markov assumptions (MLR.1 through MLR.5)
is a finite sample property.
In Chapter 4, we added the classical linear model Assumption MLR.6, which states that
the error term u is normally distributed and independent of the explanatory variables. This
allowed us to derive the exact sampling distributions of the OLS estimators (conditional on
the explanatory variables in the sample). In particular, Theorem 4.1 showed that the OLS
estimators have normal sampling distributions, which led directly to the t and F distributions
for t and F statistics. If the error is not normally distributed, the distribution of a t statistic
is not exactly t, and an F statistic does not have an exact F distribution for any sample size.
In addition to finite sample properties, it is important to know the asymptotic prop-
erties or large sample properties of estimators and test statistics. These properties are
not defined for a particular sample size; rather, they are defined as the sample size grows
without bound. Fortunately, under the assumptions we have made, OLS has satisfactory
large sample properties. One practically important finding is that even without the nor-
mality assumption (Assumption MLR.6), t and F statistics have approximately t and F dis-
tributions, at least in large sample sizes. We discuss this in more detail in Section 5.2, after
we cover consistency of OLS in Section 5.1.
5.1 Consistency
Unbiasedness of estimators, although important, cannot always be achieved. For example,
as we discussed in Chapter 3, the standard error of the regression,
ˆ, is not an unbiased esti-
mator for
, the standard deviation of the error u in a multiple regression model. Although
Chapter 5 Multiple Regression Analysis: OLS Asymptotics 177
the OLS estimators are unbiased under MLR.1 through MLR.4, in Chapter 11 we will find
that there are time series regressions where the OLS estimators are not unbiased. Further, in
Part 3 of the text, we encounter several other estimators that are biased yet useful.
Although not all useful estimators are unbiased, virtually all economists agree that
consistency is a minimal requirement for an estimator. The Nobel Prize–winning econo-
metrician Clive W. J. Granger once remarked: “If you can’t get it right as n goes to infin-
ity, you shouldn’t be in this business.” The implication is that, if your estimator of a par-
ticular population parameter is not consistent, then you are wasting your time.
There are a few different ways to describe consistency. Formal definitions and results
are given in Appendix C; here, we focus on an intuitive understanding. For concreteness, let
ˆ
j
be the OLS estimator of
j
for some j. For each n,
ˆ
j
has a probability distribution (rep-
resenting its possible values in different random samples of size n). Because
ˆ
j
is unbiased
under Assumptions MLR.1 through MLR.4, this distribution has mean value
j
. If this esti-
mator is consistent, then the distribution of
ˆ
j
becomes more and more tightly distributed
around
j
as the sample size grows. As n tends to infinity, the distribution of
ˆ
j
collapses to
the single point
j
. In effect, this means that we can make our estimator arbitrarily close to
j
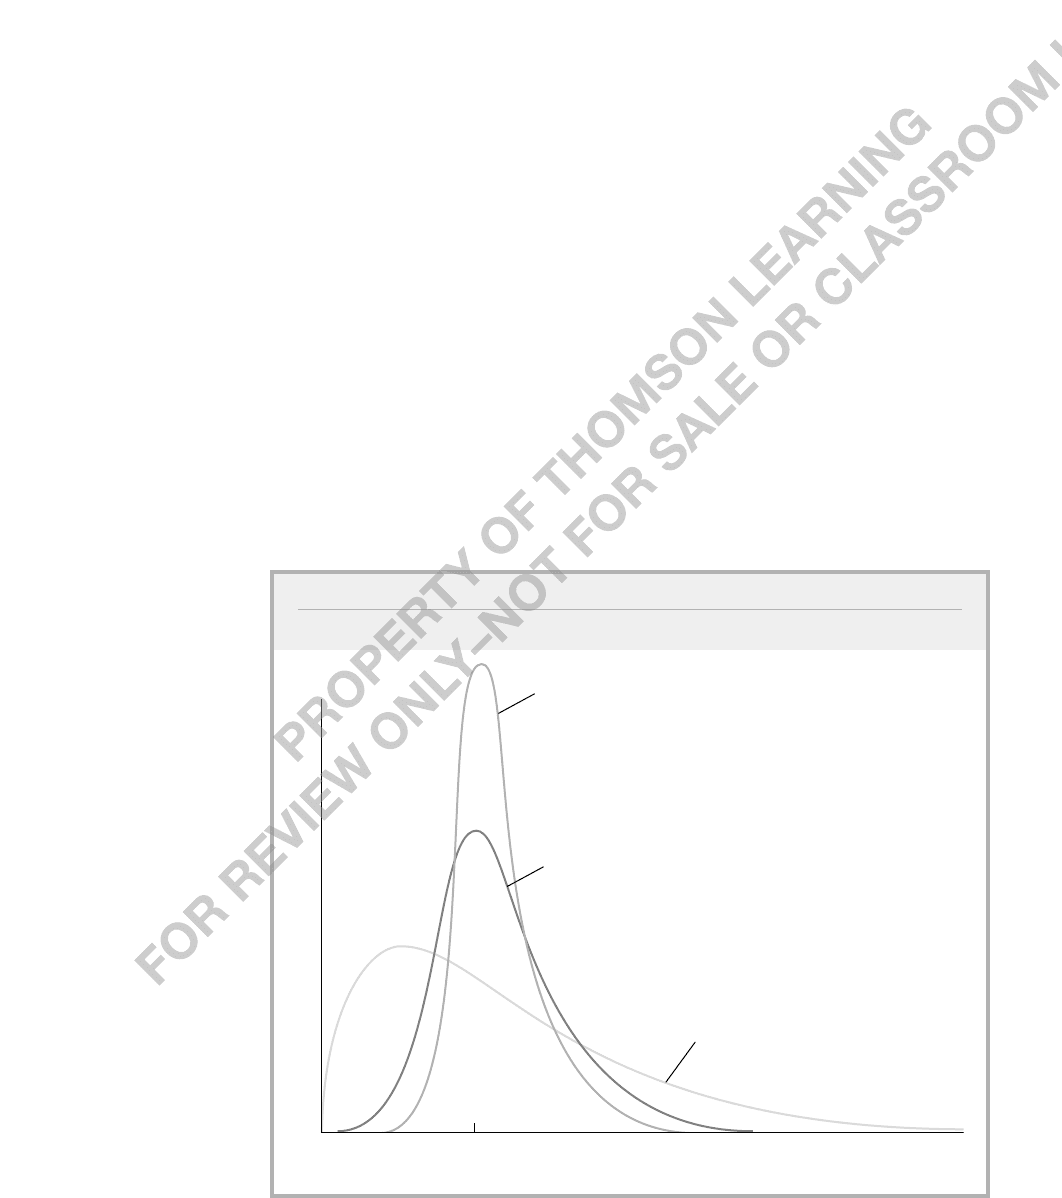
if we can collect as much data as we want. This convergence is illustrated in Figure 5.1.
b
1
b
1
f
b
1
n
3
n
2
n
1
ˆ
ˆ
FIGURE 5.1
Sampling distributions of
ˆ
1
for sample sizes n
1
n
2
n
3
.