U.S. Army Corps of Engineers. Engineering and Design Slope Stability
Подождите немного. Документ загружается.


EM 1110-2-1902
31 Oct 03
F-11
2
iwi
1
Uh
2
=γ (F-8)
and
2
i1 w i1
1
Uh
2
++
=γ (F-9)
where h
i
and h
i+1
are the heights determined in Step 4.
(6) The average height of water, h
s
, above the top of the slice is determined (Column 12 in Figure F-5b).
The height is used to compute the average water pressure and eventually the total force on the top of the slice
(See Columns 13 and 16 in Figure F-5b). It is best to select the interslice boundaries so that a boundary is
located at the point where the surface of the water outside the slope meets the slope. If this is done, the water
pressures will vary linearly across each slice, and the average height of water is equal to the height of water
above the midpoint of the slice.
(7) The average water pressure on the top of the slice, p
avg
, is computed by multiplying the height of
water, h
s
, by the unit weight of water (Column 13 in Figure F-5b).
(8) The inclination of the top of the slice, β, is determined (Column 14 in Figure F-5b). This is the same
as the inclination of the slope above the slice.
(9) The length of the top of the slice,
R
top
, is determined (Column 15 in Figure F-5b). The length can be
computed from the relationship,
R
top
= b/cos β.
(10) The water load on the top of the slice, P, is computed by multiplying the average water pressure, p
avg
,
by the length of the top of the slice,
R
top
(Column 16 in Figure F-5b).
(11) The length of the base of the slice, ∆
R, is computed from the relationship,
b
/cos∆= αA (Column 18 in
Figure F-5b).
(12) The pore water pressure is computed by multiplying the piezometric head at the center of the base of
the slice by the unit weight of water: u = γ
w
h
p
(Column 19 in Figure F-5b). For complex seepage conditions,
or where a seepage analysis has been conducted using numerical methods, it may be more convenient to
determine the pore water pressure directly, rather than evaluating the piezometric head and converting to pore
pressure. In such cases, the pore water pressures are entered in Column 19.
(13) The cohesion and friction angle are determined for each slice depending on the soil at the bottom of
the slice (Columns 20 and 21 in Figure F-5b). The shear strength parameters, c' and φ', are those for the soil
at the bottom of the slice and do not depend on the soils located in the upper portions of the slice.
(14) The inclination, θ, of the interslice forces is determined. If the computations are being performed to
check an analysis performed using Spencer’s Method, the interslice force inclination determined from
Spencer’s Method should be used. Otherwise, the interslice force inclination should be assumed in
accordance with the guidelines and discussion presented in Appendix C.
(15) A trial value is assumed for the factor of safety, and interslice forces are calculated, slice-by-slice, to
determine the force imbalance or “error of closure.” The steps for this portion of the computations are the

EM 1110-2-1902
31 Oct 03
F-12
same as those described for analyses with no water pressures, except the following equation for interslice
forces is used:
() () ()( )
()
()
ii1
i1 i
tan ' cos tan ' sin tan '
W sin U U cos P sin cos c ' u tan '
FFFF
ZZ
tan ' sin
cos
F
+
+
φ
α
φ
α
φ
∆
α− + − α+ + α−β − α−β − − φ
=+
φα−θ
α−θ +
⎡⎤⎡⎤⎡ ⎤
⎢⎥⎢⎥⎢ ⎥
⎣⎦⎣⎦⎣ ⎦
A
(F-10)
(16) If the force computed for the last slice, Z
i+1
, is not sufficiently close to zero, a new trial value is
assumed for the factor of safety and the process is repeated. By plotting the force imbalance, Z
i+1
, for the last
slice versus the factor of safety, the value of the factor of safety that satisfies equilibrium can usually be found
to an acceptable degree of accuracy in about three trials (Figure F-5c).
F-4. Modified Swedish Method – Graphical Solution
Graphical solution for the factor of safety by the Modified Swedish Method requires a trial and error process
of assuming values for the factor of safety and constructing force equilibrium polygons until “closure” (force
equilibrium) is established. Detailed steps are presented below for a total stress analysis of a slope with no
water and for an effective stress analysis of a slope with water internal seepage and external water loads.
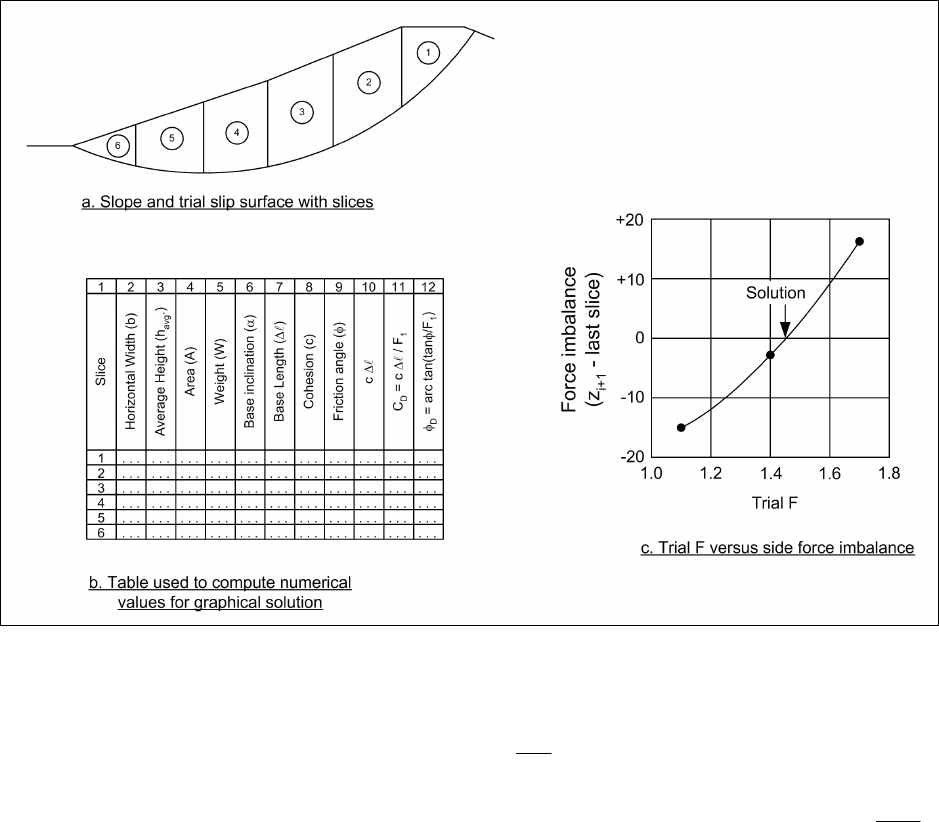
a. Slope without seepage or external water loads – total stress analyses. The graphical solution
procedure using total stresses and no water pressures is illustrated in Figures F-6 and F-7. The calculations
required to determine the magnitudes of the forces in the force polygons are shown in tabular form in
Figure F-6; and the force polygons are shown in Figure F-7. The steps for determining the factor of safety
once a trial shear surface is selected are as follows:
(1) For each slice the width, b, and the average height, h
avg.
, are determined (Columns 2 and 3 in
Figure F-6b).
(2) The area of the slice, A, is computed by multiplying the width, b, by the average height, h
avg.
, of each
slice (Column 4 in Figure F-6b).
(3) The slice weight, W, is computed by multiplying the area of the slice, A, by the total unit weight of
soil, γ: W = γA (Column 5 in Figure F-6b). If the slice crosses zones having different unit weights, the slice is
subdivided vertically into subareas, and the weights of the subareas are summed to compute the total slice
weight.
(4) The base length, ∆
A, for each slice is determined (Column 7 in Figure F-6). The base length may
either be measured from a scaled drawing of the slope or computed by dividing the slice width, b, by the
cosine of the inclination angle, α, of the base of the slice, i.e.,
b
/cos∆= αA .
(5) The cohesion value, c, and friction angle, φ, are determined for the base of each slice (Columns 8 and
9 in Figure F-6b). The shear strength parameters are those for the soil at the bottom of the slice; they do not
depend on the soils in the upper portions of the slice.
(6) The available force resulting from cohesion is calculated by multiplying the cohesion value, c, by the
length of the base of the slice, ∆
A (Column 10 in Figure F-6b).
(7) A trial value, F
1
, is assumed for the factor of safety.
EM 1110-2-1902
31 Oct 03
F-13
Figure F-6. Modified Swedish Method - graphical solution with no water - slope and numerical table
(8) The “developed” force from cohesion, C
D
, is calculated by dividing the available force computed in
Step 6 by the assumed value for the factor of safety:
D
1
c
C
F
∆
=
A
(Column 11 in Figure F-6b).
(9) The “developed” friction angle, φ
D
, is calculated from the relationship,
D
1
tan
arctan
F
⎛⎞
φ
φ=
⎜⎟
⎝⎠
(Column 12 in Figure F-6b).
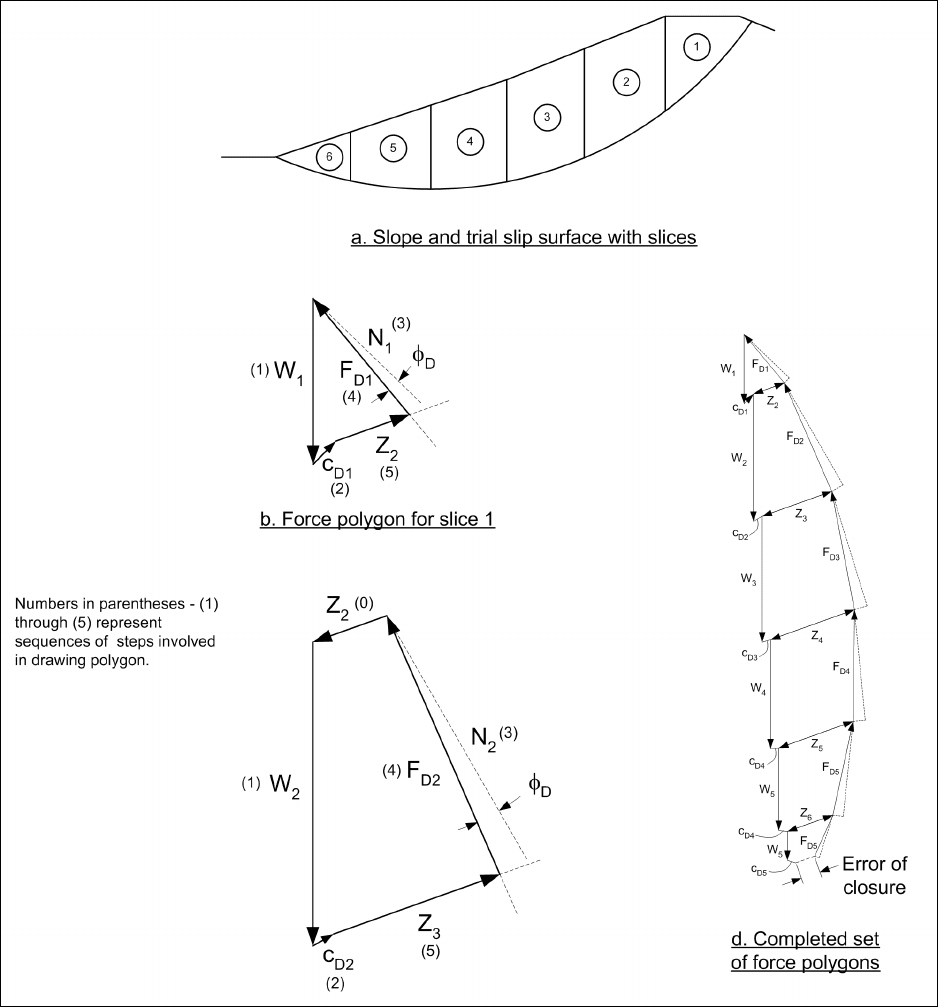
(10) A suitable scale for force is selected and a vector representing the weight of the slice, W
1
, is drawn
vertically downward to start the equilibrium force polygons. The force polygons are illustrated in Figure F-7.
Steps 11 through 17, which follow, are used to complete the forces in the force polygons, and to check for
equilibrium. All vectors are drawn using the same force scale.
(11) A vector representing the developed cohesion force on the first slice, C
D1
, is drawn in a direction
parallel to the base of the first slice, extending from the tip of the weight vector drawn in Step 10.
(12) A line is drawn from the start (tail) of the weight vector in a direction perpendicular to the base of the
slice. This line is shown as a broken line labeled N
1
in Figure F-7b.
(13) A second line is drawn from the start (tail) of the weight vector so that the angle between the new
line and line representing the normal vector (N
1
) is equal to the developed friction angle, φ
D
. The new line
should be drawn such that the component of the vector parallel to the bottom of the slice acts in the direction
of the resisting shear force, i.e., clockwise from the normal vector in the case of a left-facing slope. This
EM 1110-2-1902
31 Oct 03
F-14
Figure F-7. Modified Swedish method - graphical solution with no water - force polygons
vector is labeled F
D1
in Figure F-7b. If the soil at the bottom of the slice has φ = 0, the lines drawn in Steps 11
and 12 are the same, i.e., the vectors N
1
and F
D1
are the same.
(14) A line is drawn from the tip (end) of the developed cohesion vector, in the direction assumed for the
interslice forces. This line is labeled Z
2
in Figure F-7b. If the computations are being performed to check
computations that were performed using Spencer’s Method, the interslice force inclination should be the one
calculated in Spencer’s Method. Otherwise, the interslice force inclination should be assumed in accordance
with the guidelines and discussion presented in Appendix C.
EM 1110-2-1902
31 Oct 03
F-15
(15) The intersection between the line directions drawn in Step 13 (F
D
) and Step 14 (Z
2
) is found. This
defines the magnitudes of the forces F
D1
and Z
2
.
(16) The process continues by drawing the equilibrium force polygon for the next slice. A vector
representing the weight of the slice is drawn vertically downward from the point where the cohesion and
interslice force vectors, C
D1
and Z
2
, intersect. The force polygon for the second slice is shown in Figure F-7c.
Closure of the force polygon is used to determine the magnitude of the forces F
D2
and Z
3
for the second slice.
(17) Force polygons are drawn consecutively, slice-by-slice, for all of the remaining slices. If the trial
value of factor of safety is not the correct value, the force polygon for the last slice will not close. The error
of closure is a measure of the inaccuracy in the assumed factor of safety. Additional trial values for the factor
of safety are assumed until the force polygons close with an acceptable degree of accuracy. By plotting the
error of closure versus the assumed values of factor of safety as shown in Figure F-6c, the correct value of
factor of safety can usually be determined within a few trials.
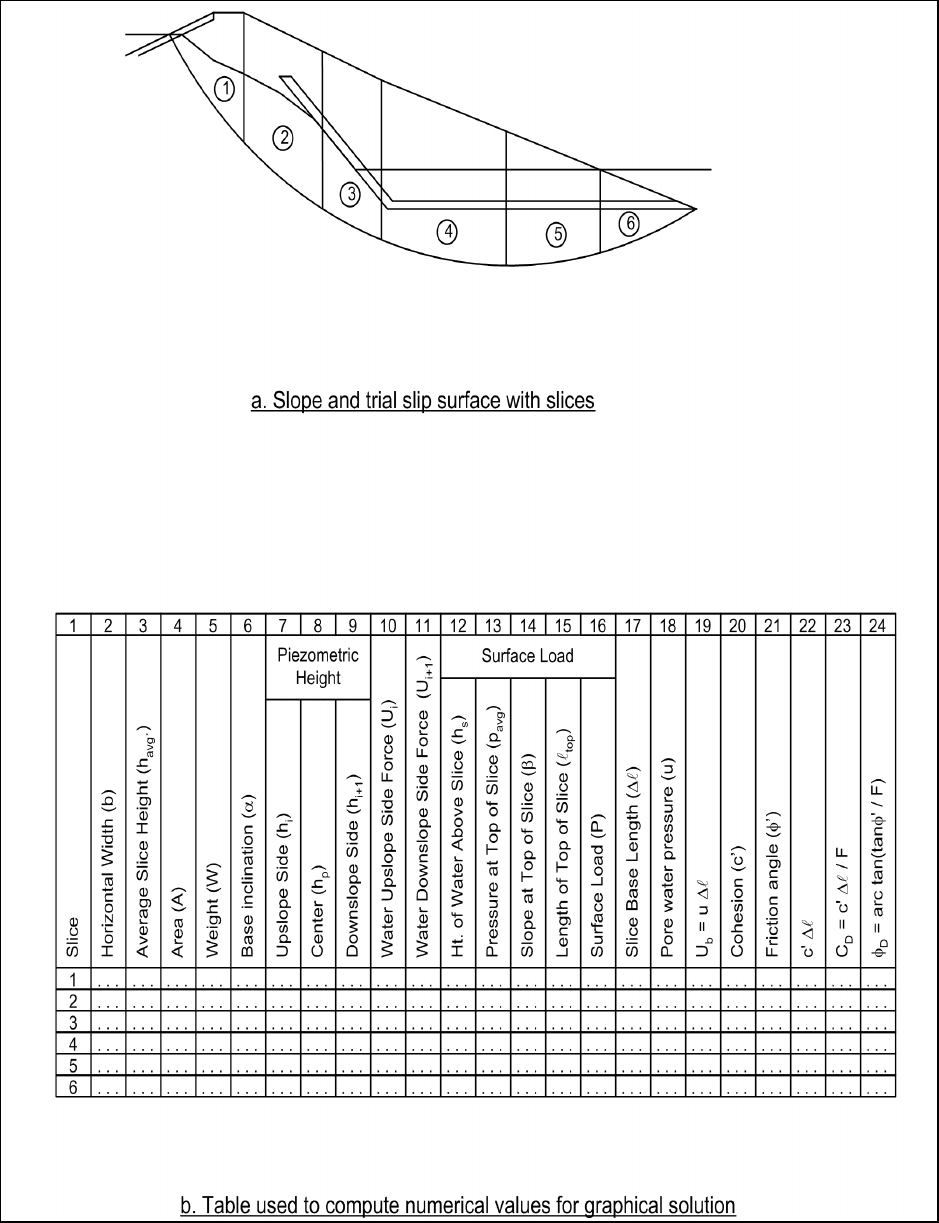
b. Slope with seepage or external water loads – effective stress analyses. The graphical solution
procedure for slopes where the shear strength is expressed in terms of effective stresses and where there are
pore water pressures and external water loads are illustrated in Figures F-8 and F-9. The calculations
required to determine the magnitudes of the forces in the force polygons are shown in tabular form in Figure
F-8; and the force polygons are shown in Figure F-9. The steps for determining the factor of safety once a
trial shear surface is selected are as follows:
(1) The width, b, average height, h
avg.
, and length of the slice base, ∆A, are determined for each slice
(Columns 2, 3, and 17 in Figure F-8b).
(2) The area of the slice is computed by multiplying the width, b, by the average height, h
avg.
(Column 4
in Figure F-8b).
(3) The weight, W, of the slice is computed by multiplying the area by the total unit weight of soil: W =
γA (Column 5 in Figure F-8b). If the slice crosses zones having different unit weights, the slice is subdivided
vertically into subareas, and the weights of the subareas are summed to compute the total slice weight.
(4) The water loads on the sides and top of the slice are computed (Columns 7 thorough 16 in Figure 7b).
The water loads are computed as described in Steps (4) through (10) in Section F-3b.
(5) The pore water pressure is computed by multiplying the piezometric head at the center of the base of
the slice by the unit weight of water: u = γ
w
h
p
(Column 18 in Figure F-8b). For complex seepage conditions,
or where a seepage analysis has been conducted using numerical methods, it may be more convenient to
determine the pore water pressure directly, rather than evaluating the piezometric head and converting to pore
pressure. In such cases the pore water pressures determined directly are entered in Column 18.
(6) The force, U
b
, produced by the water pressure on the bottom of the slice is computed by multiplying
the length of the base of the slice, ∆
A, by the pore water pressure, u (Column 19 in Figure F-8b).
(7) The “available” force resulting from cohesion is computed by multiplying the cohesion., c', by the
length of the base of the slice, ∆
A, (Column 22 in Figure F-8b).
(8) A trial value for the factor of safety, F, is assumed, and the developed cohesion force, C
D
, is
computed by dividing the available cohesion force by the factor of safety: C
D
= c' ∆A / F (Column 23 in
EM 1110-2-1902
31 Oct 03
F-16
Figure F-8. Modified Swedish Method – graphical solution with water – slope and table of numerical values
EM 1110-2-1902
31 Oct 03
F-17
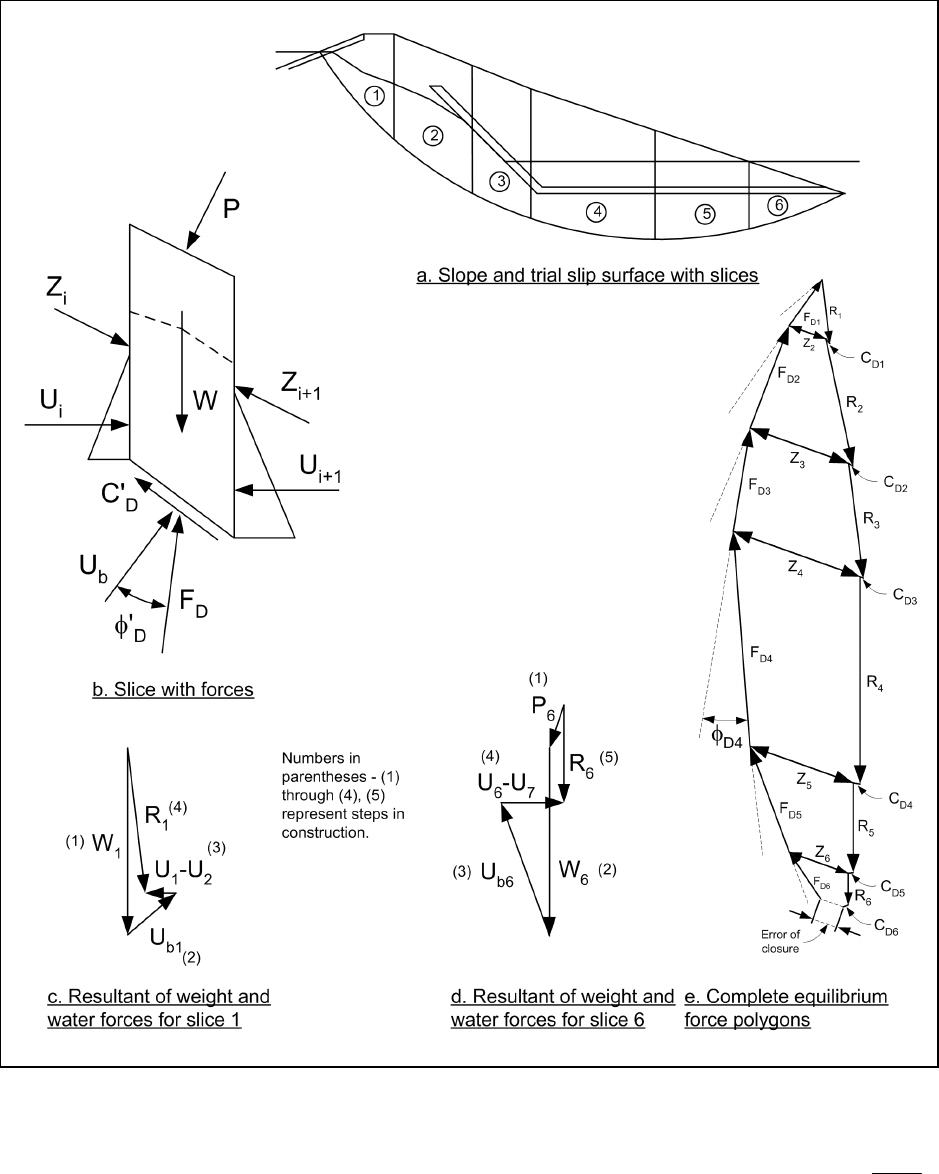
Figure F-9. Modified Swedish Method – graphical solution with water – force polygons
Figure F-8b). The developed friction angle, φ
D
, is computed from the relationship,
D
1
tan '
arctan
F
⎛⎞
φ
φ=
⎜⎟
⎝⎠
(Column 24 in Figure 8b). The trial force equilibrium polygons can now be constructed as described in the
following steps.
EM 1110-2-1902
31 Oct 03
F-18
(9) The resultant force from the weight of the slice and any water pressures on the top, sides, and bottom
of the slice are determined for each slice separately. The first step in determining this resultant involves
drawing a vector representing the water load on the top of the slice, as shown for the last slice in Figure F-9d.
This water force vector, and all subsequent vectors, are drawn to the same scale.
(10) The second step in determining the resultant is to draw a vector representing the weight of the slice
vertically downward from the tip of the vector representing the water loads on the top of the slice drawn in
Step 9. See Figures F-9c and F-9d, for the first and last slices. If there are no external water loads, the weight
vector is drawn from any convenient starting point, as in Figure F-9c.
(11) A vector representing the force, U
b
, resulting from water pressures on the bottom of the slice is
drawn extending from the tip of the weight vector in a direction perpendicular to the base of the slice (See U
b1
and U
b6
in Figures F-9c and F-9d).
(12) A vector representing the difference between the forces from water pressures on the upslope and
downslope sides of the slice, U
i
– U
i+1
, is drawn horizontally, starting at the tip of the vector drawn in Step 11
(See U
1
-U
2
and U
6
-U
7
in Figures F-9c and F-9d).
(13) A vector, R, is drawn from the start of the vector representing the water loads, P, on the top of the
slice, to the tip of the vector that was drawn in Step 12 to represent the water loads on the sides of the slice
(See vector R
6
in Figure F-9d). If there is no water load on the top of the slice, the vector is drawn starting at
the point where the weight vector, W, was started (Figure F-9c). The R-vector closes the force polygon for
the known water and gravity forces (Figures F-9c and F-9d). The R-vector represents the resultant force
produced by the slice weight and water pressures on the top, sides, and bottom of the slice. Steps 9 through
13 are carried out for each slice individually.
(14) The set of force polygons for the entire slope are begun by drawing a vector representing the force,
R
1
, for the first slice, beginning at a convenient starting point, as shown in Figure F-9e.
(15) A vector representing the developed cohesion force, C
D1
, is drawn in a direction parallel to the base
of the first slice, extending from the tip of the resultant force vector, R
1
, drawn in Step 14.
(16) A line is drawn from the start (tail) of the resultant force vector (R
1
) in a direction perpendicular to
the base of the slice. This line is shown as a broken line in Figure F-9e.
(17) A second line is drawn from the start (tail) of the resultant force vector (R
1
) such that the new line
makes an angle equal to the developed friction angle, φ
D
, with the vector drawn in Step 16. The new line
should be drawn so that the component of the vector parallel to the bottom of the slice (the shear component)
acts in the direction of the resisting shear force, i.e., counter-clockwise from the normal vector in the case of a
right-facing slope like the one shown in Figure F-9. This vector is labeled F
D1
in Figure F-9e.
(18) A line is drawn from the tip (end) of the developed cohesion vector, in the direction assumed for the
interslice forces. This line is labeled Z
2
in Figure F-9e. If hand calculations are being performed to check
computations that were performed with Spencer’s Method, the side force inclination should be the one found
with Spencer’s Method. Otherwise, the side force inclination should be assumed in accordance with the
guidelines and discussion presented in Appendix C.
(19) The intersection between the two line directions drawn in Steps 17 and 18 is found. This determines
the magnitude of the forces F
D1
and Z
2
.
EM 1110-2-1902
31 Oct 03
F-19
(20) The process described above in Steps 14 through 19 is continued for the next slice, where a vector
representing the resultant force, R
2
, for the second slice is drawn from the point where the developed cohesion
vector, C
D1
, and interslice vector, Z
2
, intersect. The force polygon for the second slice is shown in
Figure F-9e. Closure of the force polygon is used to determine the magnitude of the forces F
D2
and Z
3
for the
second slice.
(21) Force polygons are drawn slice-by-slice for the remaining slices. If the trial value of factor of safety
is not the correct value, the force polygon for the last slice will not close. This error of closure is a measure of
the inaccuracy in the assumed value for the factor of safety. Additional trial values are assumed for the factor
of safety until the equilibrium force polygons close with an acceptable degree of accuracy. By plotting the
error of closure versus the assumed values of factor of safety as shown in Figure F-6c, the correct value of
factor of safety can usually be determined within a few trials.
F-5. End-of-Construction (Short-Term Stability) Example
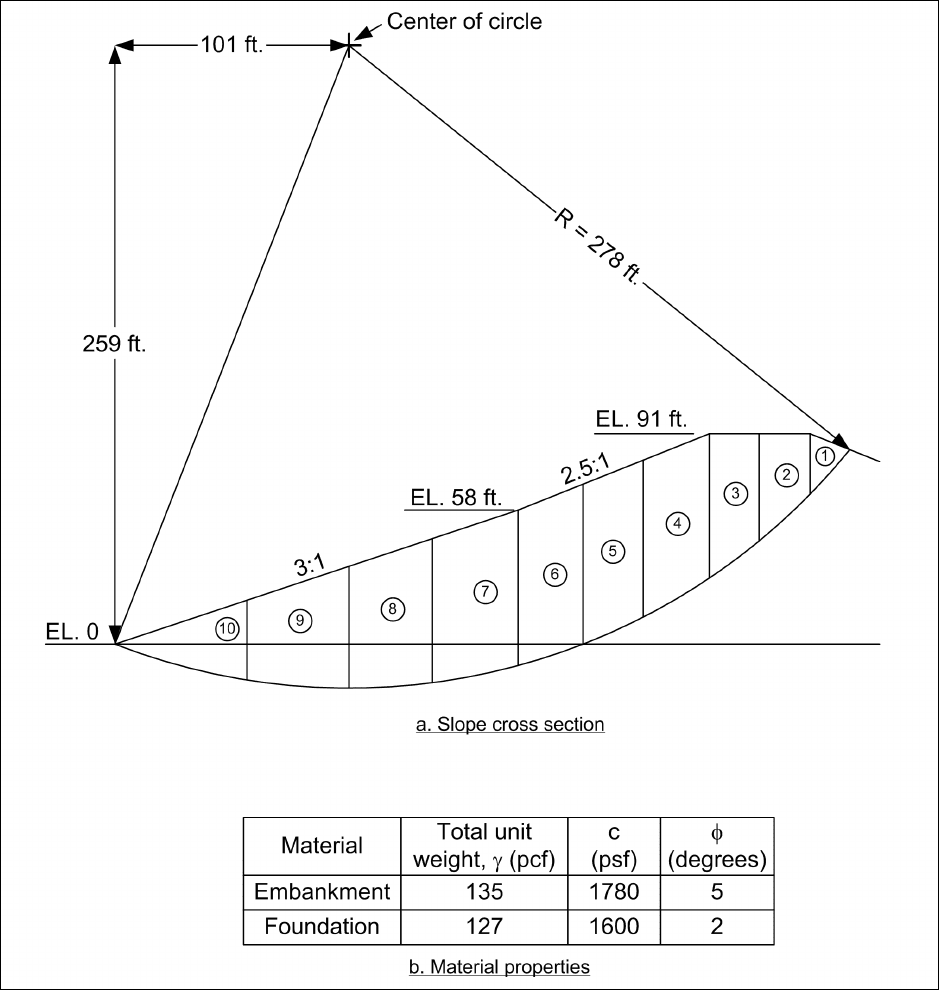
Example calculations are presented for stability at the end of construction of the embankment shown in
Figure F-10. The embankment cross section contains two materials -- the embankment soil and the
foundation soil. Both soils are fine-grained and undrained during construction.
a. Shear Strengths. Because the soils in this case are do not drain during construction, undrained shear
strengths are used for both. For the embankment, samples would be prepared by compacting representative
samples of the fill material at appropriate densities and moisture contents. For the natural foundation soil,
undisturbed samples would be obtained for testing. The shear strengths would be determined using
Unconsolidated-Undrained (UU or Q) triaxial compression tests. If the natural soil was saturated,
Consolidated-Undrained (CU or R) or field vane shear tests could also be used to estimate undrained shear
strengths, as described in Appendix D.
(1) Compacted, fined-grained fills are always partly saturated at the end of construction. The foundation
soil in this example is also assumed to be partly saturated. Thus, the shear strengths of both soils are
characterized by total stress friction angles greater than zero. If the foundation soil was saturated, its total
stress friction angle, φ, would be equal to zero.
(2) If the embankment contained zones of free-draining soils, their strengths would be characterized
using effective stress shear strength parameters.
b. Water pressures. For the example problem illustrated in Figure F-10, all water pressures are zero,
because there is no external water. If external water exists, the external water loads would be computed and
included in the analysis in the same way they are included in the example described previously where there
was water outside the slope. External water loads must always be included, regardless of whether the shear
strength is represented using total or effective stresses. Because the strengths are characterized in terms of
total stresses, pore water pressures within the slope are not included. However, if the embankment contained
free-draining soils being characterized in terms of effective stress, pore water pressures would be included in
the analysis for these materials.
c. Unit weights. Total unit weights are used for all soils. Total unit weights should always be used,
regardless of whether the shear strength is represented using total or effective stresses. The total unit weights
for the example problem are shown in Figure F-10b.
d. Simplified Bishop Method. Calculations using the Simplified Bishop Method for the example are
illustrated in Figure F-11. Slices 6 through 10 contain both embankment and foundation soils, and these
slices were divided into two portions for calculating the slice weights. The average height in each soil was
EM 1110-2-1902
31 Oct 03
F-20
Figure F-10. Slope used for example calculations for end-of-construction stability condition
determined and used to compute the area and weight for that portion of the slice. The weights of two parts of
the slices were then added to compute the total slice weight. The bottoms of slices 1 through 5 are located in
the embankment soil and were assigned the shear strength properties of the embankment. The bottoms of
slices 6 though 10 are located in the foundation, and these slices were assigned the shear strength properties of
the foundation soil. Computations for the final value of the factor of safety (F = 1.33) are shown in
Columns 14 and 15 of the table in Figure F-11. Computations were also performed for three trial values for
the factor of safety: 1.0, 1.5, and 2.0. The computed values for each trial value are plotted versus the assumed
values in Figure F-11d. As can be seen in this figure, the computed value of F varied only slightly with
changes in the assumed value.
