Tong W. Wind Power Generation and Wind Turbine Design
Подождите немного. Документ загружается.

Fundamentals of Wind Energy 45
[44] Betz, A., Das maximum der theoretisch möglichen ausnützung des windes
durch windmotoren. Zeitschrift für das gesamte Turbinewesen , pp. 307–309,
September 20, 1920.
[45] Cabezon, D., Marti, I., Isidro, M.J.S. & Perez, I., Comparison of meth-
ods for power curve modelling, Global Windpower 2004, Chicago, Illinois,
2004.
[46] Gottschall, J. & Peinke, J., How to improve the estimation of power curves
for wind turbines. Environmental Research Letters , 3(1) , paper No. 015005,
2008.
[47] IEC 61400-12-1. Power performance measurements of grid connected wind
turbines, 2005.
[48] Anahua, E., Barth, St. & Peinke, J., Markovian power curves for wind
turbine. Wind Energy , 11(3) , pp. 219–232, 2007.
[49] Ragheb, M., Optimal rotor tip speed ratio, 2009, https://netfi les.uiuc.
edu/mragheb/www/NPRE%20475%20Wind%20Power%20Systems/
Optimal%20Rotor%20Tip%20Speed%20Ratio.pdf
[50] Renewable Energy Research Laboratory/University of Massachusetts
at Amherst. Wind power: capacity factor, intermittency, and what hap-
pens when the wind doesn’t blow? http://www.ceere.org/rerl/about_wind/
RERL_Fact_Sheet_2a_Capacity_Factor.pdf
[51] Brandt, K. & Zeumer, J., Wind power plant comprising a rotor blade adjust-
ing device, US Patent 7,256,509, 2007.
[52] Setec. Pitch-system including pitch-master and pitch-drive, http://www.
setec-dresden.com/index.php?id=22
[53] Weitkamp, R., Lütze, H., Riesberg, Riesberg, A. & Anemüller, J., Means for
adjusting the rotor blade of a wind power plant rotor, US Patent 6,783,326,
2004.
[54] Hildingsson, S. & Westin, T., Yawing system for adjusting a wind turbine
into a required wind direction by turbine the turbine about a yawing axle,
US Patent 5,990,568, 1999.
[55] Kaz´miekowski, M.P., Krishnan, R. & Blaabjerg, F., Control in Power
Electronics , Academic Press, 2002.
[56] Danish Wind Industry Association. Power control of wind turbines, http://
www.windpower.org/en/tour/wtrb/powerreg.htm
[57] National Academy of Sciences. Environmental impacts of wind-energy
projects, National Research Council, 2007.
[58] Sovacool, B.K., Contextualizing avian mortality: a preliminary appraisal of
bird and bat fatalities from wind, fossil-fuel, and nuclear electricity. Energy
Policy , 37 , pp. 2241–2248, 2009.
[59] Canadian Wind Energy Association. Birds, bats and wind energy, http://
www.canwea.ca/images/uploads/File/NRCan_-_Fact_Sheets/6_wildlife.pdf
[60] Wind farms & visual aesthetics, http://www.countrysideenergyco-op.ca/
fi les/cec_fl yer_windfarm_visual_aesthetics_20060713a_w.pdf
[61] Gipe, P., Design as if people matter: aesthetic guidelines for the wind industry,
http://www.wind-works.org/articles/design.html
46 Wind Power Generation and Wind Turbine Design
[62] Ramakrishnan, R., Wind turbine facilities noise issues, Alolos Engi-
neering Corporation, http://www.ene.gov.on.ca/envision/env_reg/er/
documents/2008/Noise%20Report.pdf
[63] Vijgen, P.M.H.W., Howard, F.G., Bushnell, D.M. & Holmes, B.J., Serrated
trailing edges for improving lift and drag characteristics of lifting surface,
US patent 5,088,665, 1992.
[64] Dassen, A.G.M. & Hagg, F., Wind turbine, US patent 5,533,865, 1996.
[65] Shibara, M., Furukawa, T., Hayashi, Y. & Kata, E., Wind turbine provided
with nacelle, US patent 6,830,436, 2004.
[66] Godsk, K. & Nielsen, T., A pitch controlled wind turbine blade, a wind
turbine and use hereof, WO/2006/122574, 2006.
[67] Gil, A.M. & Rueda, L.M.G., Wind turbine blade with anti-noise devices,
US patent application 20,080,298,967, 2008.
[68] Oerlemans, S., Fisher, M., Maeder, T. & Kögler, K., Reduction of wind
turbine noise using optimized airfoils and trailing-edge serrations. AIAA
Journal , 47(6 ), 2009.
[69] Kögler, K., Herr, S. & Fisher, M., Wind turbine blades with trailing edge
serrations, US patent application, US20090074585, 2009.
[70] Jones, L.E., Integrating variable renewable generation in utility operations.
Utility/T&D , Vol. 14.04, April 2009.
[71] European Wind Energy Association. Wind energy – the facts, part II: Grid
integration, 2009, http://www.wind-energy-the-facts.org/en
[72] Bagepalli, B., Barnes, G.R., Gadre A.D., Jansen, P.L., Bouchard Jr., C.G.,
Jarczynski, E.D. & Garg, J., Wind turbine generators having wind assisted
cooling systems and cooling methods, US Patent 7,427,814, 2008.
[73] Fischer, T. & Vilsbøll, N., Offshore wind turbine with liquid-cooling, US
Patent 6,520737, 2003.
[74] University of Colorado at Boulder. Electrical energy storage, http://www.
colorado.edu/engineering/energystorage/intro.html
[75] Daniel, C., Materials and processing for lithium-ion batteries. JOM , 60(9) ,
pp. 43–48, 2008.
[76] Wen, Z.Y., Cao, J.D., Gu, Z.H., Xu, X.H., Zhang, F.L. & Lin, Z.X.,
Research on sodium sulphur battery for energy storage. Solid State Ionics ,
179 , 2008.
[77] Tamakoshi, T. & Atsumi, S., Operational guidance device of sodium-
sulphur battery, US Patent Application 20,080,206,626, 2008.
[78] US Department of Energy, Offi ce of Science. Basic research needs for
electrical energy storage, 2007, http://www.er.doe.gov/bes/reports/fi les/
EES_rpt.pdf
[79] Kensche, C.W., Fatigue of components for wind turbines. International
Journal of Fatigue , 28(10) , pp. 1363–1374, 2006.
[80] EWEA, Wind power economics, http://www.ewea.org/fi leadmin/ewea_
documents/documents/press_releases/factsheet_economy2.pdf
[81] Wald, M.L., Cost works against alternative and renewable energy sources
in time of recession, The New York Times , March 28, 2009, http://www.
nytimes.com/2009/03/29/business/energy-environment/29renew.html
Fundamentals of Wind Energy 47
[82] Logan, J. & Kaplan, S.M., Wind power in the United States: technol-
ogy, economic, and policy issues, 2008, http://www.fas.org/sgp/crs/misc/
RL34546.pdf
[83] Enercon, Installing giant windmills, Windblatt Magazine, Issue 4, 2008.
[84] Sievert, T., World’s largest offshore wind energy turbine to be developed in
North England, http://www.windfair.net/press/4254.html
[85] Echavarria, E., Hahn, B. & van Bussel, G.J.W., Reliability of wind turbine
technology through time. Journal of Solar Energy Engineering , 130(3 ),
2008.
[86] PESWiki, PowerPedia: Wind turbine, http://peswiki.com/index.php/
PowerPedia:Wind_Turbine
[87] Brown, D.A. & Hefner, R.E., Corrosion protection for wind turbine unites
in a marine environment, US Patent 7,230,347, 2007.
[88] Thick, J., Offshore corrosion protection of wind farms, http://www.2004ewec.
info/fi les/23_1400_jamesthick_01.pdf
[89] Bang, D., Polinder, H., Shrestha, G. & Ferreira, J.A., Review of generator
systems for direct-drive wind turbines. Proc. of the 2008 European Wind
Energy Conf. , Brussels, April 2008.
[90] Polinder, H., Bang, D., van Rooij, R.P.J.O.M., McDonald, A.S. & Mueller,
M.A., 10MW wind turbine direct drive generator design with pitch and ac-
tive stall control. Proc. of International Electric Machines & Drives Conf. ,
IEEE International, 2007.
[91] De Vries, E., Siemens tests its direct drive: will direct drive bring down the
cost of energy from large-scale turbines? Renewable Energy World Maga-
zine , 11(5 ), 2008.
[92] Hau, E., Wind Turbines: Fundamentals, Technologies, Application, Eco-
nomics , 2nd edition, Springer, 2005.
[93] Scherer, R., Blade design aspects. Renewable Energy , 16(1 ), pp. 1272–
1277, Elsevier Science, 1999.
[94] Hillmer, H., Borstelmann, T., Schaffarczyk, P.A. & Dannenberg, L., Aero-
dynamic and structural design of multiMW wind turbine blades beyond
5MW. Journal of Physics: Conference Series 75 , 2007.
[95] Sandia National Laboratories. More effi cient wind turbine blade designed,
http://www.sciencedaily.com/releases/2007/03/070319180042.htm
[96] Purdue University. ‘Smart turbine blades’ to improve wind power, http://
esciencenews.com/articles/2009/05/01/smart.turbine.blades.improve.wind.
power
[97] Engström, S., Hernnäs, B., Parkegren, C. & Waernulf, S., Development of
NewGen – a new type of direct-drive generator. Proc. of Nordic Wind Power
Conf. , Espoo, Finland, May 2006.
[98] Lee, K., Sclavounos, P.D. & Wayman, E.N., Floating wind turbines. 20th
Workshop on Water Waves and Floating Bodies , Spitsbergen, Norway,
2005.
[99] Sclavounos, P.D., Tracy, C. & Lee, S., Floating offshore wind turbines:
responses in a seastate, Pareto optimal designs and economic assessment,
MIT.
48 Wind Power Generation and Wind Turbine Design
[100] Adam, D., Floating wind turbines poised to harness ocean winds,
http://www.guardian.co.uk/environment/2008/jul/16/windpower.
renewableenergy
[101] Sway, Principles of concept, http://sway.no/index.php?id=16
[102] Vanderover, J.S. & Visser, K.D., Analysis of a contra-rotating propeller
driven transport aircraft, ftp://ftp.clarkson.edu/.depts/mae/public_html/
papers/vanderover.pdf
[103] Schönball, W., Electrical generator arrangement, US Patent 3,974,396,
1976.
[104] McCombs, J.C., Machine for converting wind energy to electrical energy,
US Patent 5,506,453, 1996.
[105] Wachinski, A., Drive device for a windmill provided with two counter-
rotative propellers, US Patent 7,384,239, 2008.
[106] Shin, C. & Hur, M.C., Over-drive gear device, US Patent 5,222,924, 1993.
[107] Shin, C., Multi-unit rotor blade system integrated wind turbine, US Patent
5,876,181, 1999.
[108] Kowintec Corp., http://www.kowintec.com/english/products/main.htm
[109] Korane, K.J., Flexible gears bolster wind-turbine reliability. Machine
Design , 79(15) , pp. 24–28, 2007.
[110] Fox, G., Epicyclic gear system, US Patent 7,056,259, 2006.
[111] Musial, W., Butterfi eld, S. & McNiff, B., Improve wind turbine gearbox
reliability. 2007 European Wind Energy Conf. , Milan, Italy, 2007.
[112] Gburˇ cik, P., Gburˇ cik, V., Gavrilov, M., Srdanoviˇ c, V. & Mastilovic´, S.,
Complementary regimes of solar and wind energy in Serbia. Geographica
Pannonica , 10 , pp. 22–25, 2006.
[113] Muralikrishna, M. & Lakshminarayana, V., Hybrid (solar and wind) energy
systems for rural electrifi cation. ARPN Journal of Engineering and Applied
Science , 3(5 ), pp. 50–58, 2008.
[114] Wang, M.H., Project of wind-solar energy storage system locating at
Zhangbei, People’s Daily – Overseas Edition (in Chinese), June 30, 2009.
[115] Ragan, S., UK’s fi rst hydrogen powered building, March 2, 2009, http://
www.v1energy.com/articles/features/217-uks-first-hydrogen-powered-
building
[116] Danvest Energy. Wind-diesel instructions, http://www.danvest.com/
fi lesfordownload/wind-diesel.pdf
[117] Wikipedia, Wind-diesel hybrid power systems, http://en.wikipedia.org/
wiki/Wind-Diesel_Hybrid_Power_Systems
CHAPTER 2
Wind resource and site assessment
Wiebke Langreder
Wind & Site, Suzlon Energy, Århus, Denmark.
Wind farm projects require intensive work prior to the fi nalizing of a project.
The wind resource is one of the most important factors for the fi nancial viability of
a wind farm project. Wind maps representing the best estimate of the wind resource
across a large area have been produced for a wide range of scales, from global
down to local government regions. They do not substitute for wind measurements –
rather they serve to focus investigations and indicate where on-site measurements
would be merited. This chapter explains how wind resource can be assessed. The
steps in this process are explained in detail, starting with initial site identifi ca-
tion. A range of aspects concerning wind speed measurements is then covered
including the choice of sensors, explaining the importance of proper mounting and
calibration, long-term corrections, and data analysis. The diffi culty of extrapolat-
ing the measured wind speed vertically and horizontally is demonstrated, leading
to the need for fl ow models and their proper use. Basic rules for developing a
layout are explained. Having analysed wind data and prepared a layout, the next
step is energy yield calculation.The chapter ends by exploring various aspects of
site suitability.
1 Initial site identifi cation
The wind resource is one of the most critical aspects to be assessed when plan-
ning a wind farm. Different approaches on how to obtain information on the wind
climate are possible. In most countries where wind energy is used extensively,
some form of general information about the wind is available. This information
could consist of wind maps showing colour coded wind speed or energy at a spe-
cifi c height. These are often based on meso-scale models and in the ideal case, are
validated with ground-based stations. The quality of these maps varies widely and
depends on the amount and precision of information that the model has been fed
with, the validation process and the resolution of the model.
50 Wind Power Generation and Wind Turbine Design
Wind atlases are normally produced with Wind Atlas Analysis and Application
Program (WAsP, a micro-scale model, see Section 4.3) or combined models which
involve the use of both meso- and micro-scale models, and are presented as a col-
lection of wind statistics. The usefulness of these wind statistics depends very
much on the distance between the target site and the stations, the input data they
are based on, the site as well as on the complexity of the area, both regarding
roughness and orography. Typically the main source of information for wind
atlases is meteorological stations with measurements performed at a height of
10 m. Meso-scale models additionally use re-analysis data (see Section 3.1.1).
Care has to be taken since the main purpose of these data is to deliver a basis for
general weather models, which have a much smaller need for high precision wind
measurements than wind energy. Thus the quality of wind atlases is not suffi cient
to replace on-site measurements [ 1 ].
Nature itself frequently gives reasonable indications of wind resources. Particu-
larly fl agged trees and bushes can indicate a promising wind climate and can give
valuable information on the prevailing wind direction.
A very good source of information for a fi rst estimate of the wind regime is
production data from nearby wind farms, if available.
No other step in the process of wind farm development has such signifi cance to
the fi nancial success as the correct assessment of the wind regime at the future
turbine location. Because of the cubic relationship between wind speed and energy
content in the wind, the prediction of energy output is extremely sensitive to the
wind speed and requires every possible attention.
2 Wind speed measurements
2.1 Introduction
The measured wind climate is the main input for the fl ow models, by which you
extrapolate the spot measurement vertically and horizontally to evaluate the energy
distribution across the site. Such a resource map is the basis for an optimised lay-
out. The number and height of the measurement masts should be adjusted to the
complexity of the terrain as with increasing complexity, the capability of fl ow
models to correctly predict the spatial variation of the wind decreases. The more
complex the site, the more and the higher masts have to be installed to ensure a
reasonable prediction of the wind resource.
Unfortunately wind measurements are frequently neglected. Very often the
measurement height is insuffi cient for the complexity of the site, the number
of masts is insuffi cient for the size of the site, the measurement period is too
short, the instruments are not calibrated, the mounting is sub-standard or the
mast is not maintained. It cannot be stressed enough that the most expensive
part when measuring wind is the loss of data. Any wind resource assessment
requires a minimum measurement period of one complete year in order to
avoid seasonal biases. If instrumentation fails due to lightning strike, icing,
vandalism or other reasons and the failure is not spotted rapidly, the lost data
Wind Resource and Site Assessment 51
will falsify the results and as a consequence the measurement period has to
start all over again. Otherwise the increased uncertainty might jeopardise the
feasibility of the whole project.
2.2 Instruments
2.2.1 General
Wind speed measurements put a very high demand on the instrumentation because
the energy density is proportional to the cube of the mean wind speed. Further-
more, the instruments used must be robust and reliably accumulate data over
extended periods of unattended operation. The power consumption should be low
so that they can operate off the grid.
Most on-site wind measurements are carried out using the traditional cup ane-
mometer. The behaviour of these instruments is fairly well understood and the
sources of error are well known. In general, the sources of error in anemometry
include the effects of the tower, boom and other mounting arrangements, the ane-
mometer design and its response to turbulent and non-horizontal fl ow characteris-
tics, and the calibration procedure. Evidently, proper maintenance of the
anemometer is also important. In some cases, problems arise due to icing of the
sensor, or corrosion of the anemometer at sites close to the sea. The current version
of the internationally used standard for power curve measurements, the IEC stan-
dard 61400-12-1 [ 2 ], only permits the use of cup anemometry for power curve
measurements. The same requirements for accuracy are valid for wind resource
measurements. Therefore it is advisable to use also these instruments for wind
resource assessment.
Solid state wind sensors (e.g. sonics) have until recently not been used exten-
sively for wind energy purposes, mainly because of their high cost and a higher
power consumption. These have a number of advantages over mechanical ane-
mometers and can further provide measurements of turbulence, air temperature,
and atmospheric stability. However, they also introduce new sources of error which
are less known, and the overall accuracy of sonic anemometry is lower than for
high-quality cup anemometry [ 3 ].
Recently, remote sensing devices based either on sound (Sodar) or on laser
(Lidar) have made an entry into the market. Their clear merit is that they
replace a mast which can have practical advantages. However, they often
require more substantial power supplies which bring other reliability and
deployment issues. Also more intensive maintenance is required since the
mean time between failures does not allow unattended measurements for peri-
ods required for wind resource assessment. While the precision of a Lidar
seems to be superior to the Sodar, and often comparable to cup anemometry
[ 4 ], both instruments suffer at the moment from short-comings in complex ter-
rain due to the fact that the wind speed sampling takes place over a volume,
and not at a point.
Remote sensing technologies are currently evolving very rapidly and it is
expected they will have a signifi cant role to play in the future.
52 Wind Power Generation and Wind Turbine Design
2.2.2 Cup anemometer
The cup anemometer is a drag device and consists typically of three cups each
mounted on one end of a horizontal arm, which in turn are mounted at equal angles
to each other on a vertical shaft. A cup anemometer turns in the wind because the
drag coeffi cient of the open face cup is greater than the drag coeffi cient of the
smooth surface of the back. The air fl ow past the cups in any horizontal direction
turns the cups in a manner that is proportional to the wind speed. Therefore, count-
ing the turns of the cups over a set time period produces the average wind speed
for a wide range of speeds.
Despite the simple geometry of an anemometer its measurement behaviour
depends on a number of different factors. One of the most dominant factors is the
so-called angular response, which describes what components of the wind vector are
measured [ 3 ]. A so-called vector anemometer measures all three components of the
wind vector, the longitudinal, lateral and vertical component. Thus this type of ane-
mometer measures independently of the infl ow angle and is less sensitive to mount-
ing errors, terrain inclination and/or thermal effects. However, for power curve
measurements the instrument must have a cosine response thus measuring only the
horizontal component of the wind [ 2 ]. Since for energy yield calculations the mea-
surement behaviour of the anemometer used for the power curve and used for
resource assessment should be as similar as possible, it is advisable to also use an
anemometer with a cosine response for resource assessment. One of the key argu-
ments for using such an instrument for power curve measurements is that the wind
turbine utilises only the horizontal component. This is, however, a very simplifi ed
approach as, particularly for large rotors, three-dimensional effects along the blades
leads to a utilisation of energy from the vertical component. Care has to be taken
when using a cosine response anemometer as it is sensitive to mounting errors.
One of the most relevant dynamic response specifi cations is the so-called over-
speeding. Due mainly to the aerodynamic characteristics of the cups, the anemom-
eter tends to accelerate faster than it decelerates, leading to an over-estimate of
wind speed particularly in the middle wind speed range.
Another dynamic response specifi cation is the response length or distance con-
stant, which is related to the inertia of the cup anemometer. The dynamic response
can be described as a fi rst order equation. When a step change of wind speed from
U to U + Δ u hits the anemometer it will react with some delay of exponential
shape. The distance constant, i.e. the column of air corresponding to 63% recovery
time for a step change in wind speed, should preferably be a few meters or less.
Different methods to determine the response length are described in [ 3 ].
2.2.3 Ultrasonic anemometer
Ultrasonic or sonic anemometers use ultrasonic waves for measuring wind speed
and, depending on the geometry, the wind direction. They measure the wind speed
based on the time of fl ight between pairs of transducers. Depending on the num-
ber of pairs of transducers, either one-, two- or three-dimensional fl ow can be
measured. The travelling time forth and back between the transducers is different
because in one direction the wind speed component along the path is added to the

Wind Resource and Site Assessment 53
sound speed and subtracted from the other direction. If the distance of the trans-
ducers is given with s and the velocity of sound with c then the travelling times
can be expressed as
12
and
ss
tt
cu cu
==
+−
(1)
These equations can be re-arranged to eliminate c and to express the wind speed
u as a function of t
1
, t
2
and s . The sole dependency on the path length is advanta-
geous, as the speed of sound depends on air density and humidity:
12
11
2
s
u
tt
⎛⎞
=−
⎜⎟
⎝⎠
(2)
It can be seen that once u is known, c can be calculated and from c the tempera-
ture can be inferred (slightly contaminated with humidity, this is known as the
“sound virtual temperature”). The spatial resolution is determined by the path
length between the transducers, which is typically 10–20 cm. Due to the very fi ne
temporal resolution of 20 Hz or better the sonic anemometer is very well suited for
measurements of turbulence with much better temporal and spatial resolution than
cup anemometry.
The measurement of different components of the wind, the lack of moving parts,
and the high temporal resolutions make the ultrasonic anemometer a very attrac-
tive wind speed measurement device. The major concern, inherent in sonic ane-
mometry, is the fact that the probe head itself distorts the fl ow – the effect of which
can only be evaluated in detail by a comprehensive wind tunnel investigation. The
transducer shadow effect is a particularly simple case of fl ow distortion and a well-
known source of error in sonics with horizontal sound paths. Less well known are
the errors associated with inaccuracies in probe head geometry and the tempera-
ture sensitivity of the sound transducers. The measurement is very sensitive to
small variations in the geometry, either due to temperature variations and/or
mechanical vibrations due to wind. Finally, specifi c details in the design of a given
probe head may give rise to wind speed-dependent errors.
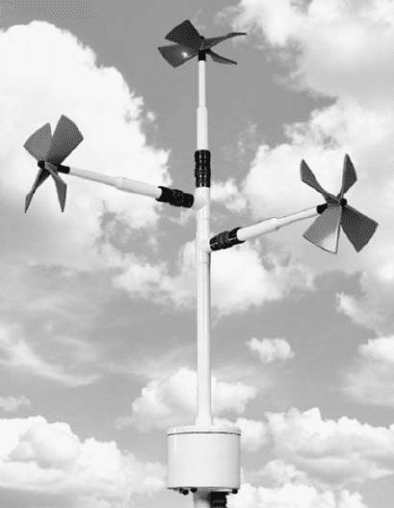
2.2.4 Propeller anemometer
A propeller anemometer typically has four helicoid-shaped blades. This propeller
can either be mounted in conjunction with a wind vane or in a fi xed two- or three-
dimensional arrangement ( Fig. 1 ). While a cup anemometer responds to the dif-
ferential drag force, both drag and lift forces act to turn the propeller anemometer.
Similar to a cup anemometer the response of the propeller anemometer to slow
speed variations is linear above the starting threshold.
Propeller anemometers have an angular response that deviates from cosine. In fact
the wind speed measured is somewhat less than the horizontal component [ 5 ]. If a
propeller is used in conjunction with a vane the propeller is in theory on average
oriented into the wind and thus the angular response is not so relevant. However,
the vane often shows an over-critical damping which leads to misalignment and
54 Wind Power Generation and Wind Turbine Design
thus to an under-estimate of the wind speed. If propellers are mounted in a fi xed
arrangement the under-estimate of the wind speed is even more signifi cant as the
axis of the propeller is not aligned with the wind direction.
2.2.5 Remote sensing
An alternative to mast-mounted anemometry are ground-based remote sensing sys-
tems. Two systems have found some acceptance in the wind energy community:
Sodar and Lidar. Both the Sodar (SOund Detection And Ranging) and the Lidar
(LIght Detection And Ranging) use remote sensing techniques based respectively
on sound and light emission, in combination with the Doppler effect. The signal
emitted by the Sodar is scattered by temperature fl uctuations while the signal emit-
ted by a Lidar is scattered by aerosols. In contrast to the very small measurement
volume of a cup anemometer, both remote sensing devices measure large volumes,
which change with height. Both types require signifi cantly more power than a cup
anemometer making the use of a generator necessary (for the majority of models)
if no grid is available.
2.2.5.1 Sodar
Different types of Sodars are available with different arrangements of the loud-
speaker and receiver. Most commonly the sound pulse generated by a loudspeaker
array can be tilted by electronically steering the array to different directions (phased
array Sodar). The combination of three beams, one in the vertical direction and
Figure 1: Propeller anemometer in fi xed three-dimensional arrangement .