Tan S.T. Finite Mathematics for the Managerial, Life, and Social Sciences
Подождите немного. Документ загружается.

The Method of Least Squares
Suppose we are given n data points
P
1
(x
1
, y
1
), P
2
(x
2
, y
2
), P
3
(x
3
, y
3
), . . . , P
n
(x
n
, y
n
)
Then the least-squares (regression) line for the data is given by the linear equa-
tion (function)
y f (x) mx b
52 1 STRAIGHT LINES AND LINEAR FUNCTIONS
Example 10 by requiring that the line pass through two data points, the rationale being
that such a line seems to fit the data reasonably well.
In this section, we describe a general method known as the method of least
squares for determining a straight line that, in some sense, best fits a set of data points
when the points are scattered about a straight line. To illustrate the principle behind
the method of least squares, suppose, for simplicity, that we are given five data points,
P
1
(x
1
, y
1
), P
2
(x
2
, y
2
), P
3
(x
3
, y
3
), P
4
(x
4
, y
4
), P
5
(x
5
, y
5
)
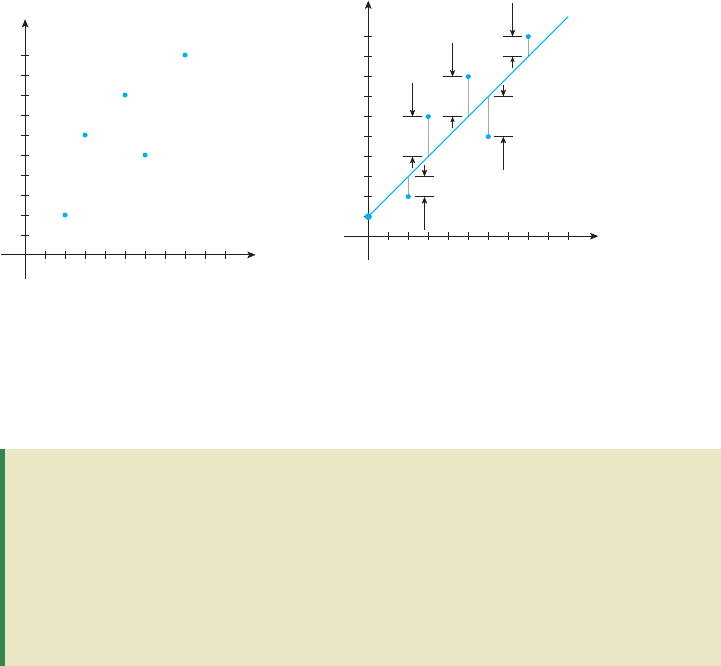
describing the relationship between the two variables x and y. By plotting these data
points, we obtain a graph called a scatter diagram (Figure 41).
If we try to fit a straight line to these data points, the line will miss the first, sec-
ond, third, fourth, and fifth data points by the amounts d
1
, d
2
, d
3
, d
4
, and d
5
, respec-
tively (Figure 42). We can think of the amounts d
1
, d
2
, . . . , d
5
as the errors made when
the values y
1
, y
2
, . . . , y
5
are approximated by the corresponding values of y lying on
the straight line L.
The principle of least squares states that the straight line L that fits the
data points best is the one chosen by requiring that the sum of the squares of
d
1
, d
2
, . . . , d
5
—that is,
be made as small as possible. In other words, the least-squares criterion calls for min-
imizing the sum of the squares of the errors. The line L obtained in this manner is
called the least-squares line, or regression line.
The method for computing the least-squares lines that best fits a set of data points
is contained in the following result, which we state without proof.
d
2
1
d
2
2
d
2
3
d
2
4
d
2
5
x
5
y
10
5
P
1
10
P
2
P
3
P
4
P
5
FIGURE 41
A scatter diagram
x
5
y
10
5
d
1
10
d
2
d
3
d
4
d
5
FIGURE 42
d
i
is the vertical distance between the straight
line and a given data point.
87533_01_ch1_p001-066 1/30/08 9:37 AM Page 52
1.5 THE METHOD OF LEAST SQUARES 53
EXAMPLE 1
Find the least-squares line for the data
P
1
(1, 1), P
2
(2, 3), P
3
(3, 4), P
4
(4, 3), P
5
(5, 6)
Solution
Here we have n 5 and
x
1
1 x
2
2 x
3
3 x
4
4 x
5
5
y
1
1 y
2
3 y
3
4 y
4
3 y
5
6
Before using Equations (9) and (10), it is convenient to summarize these data in the
form of a table:
xyx
2
xy
1111
2346
34912
4 3 16 12
5 6 25 30
Sum 15 17 55 61
Using this table and (9) and (10), we obtain the normal equations
(11)
(12)
Solving Equation (11) for b gives
(13)
which upon substitution into Equation (12) gives
Substituting this value of m into Equation (13) gives
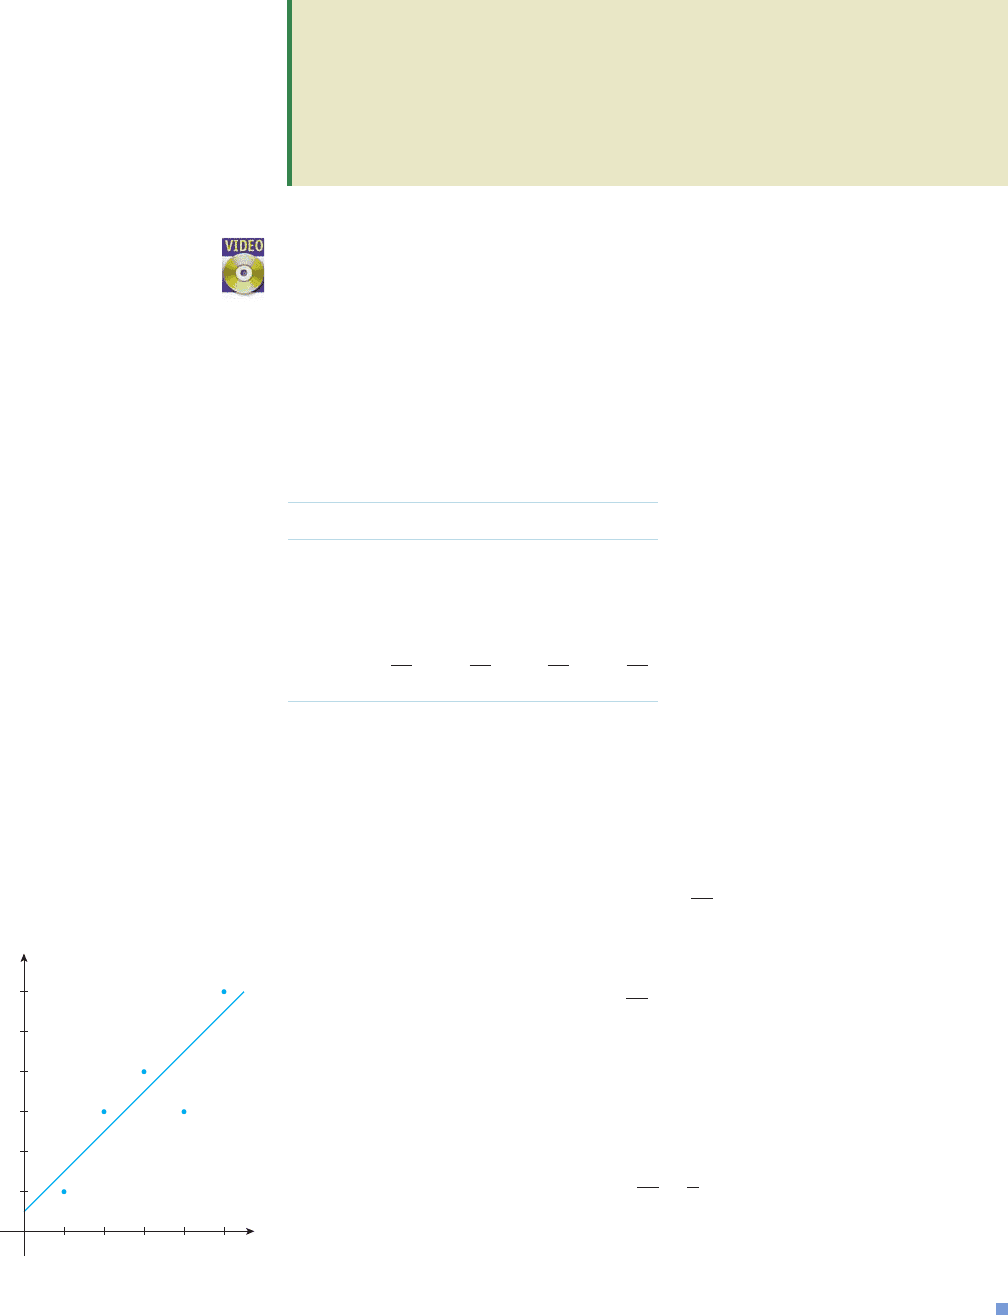
Therefore, the required least-squares line is
y x 0.4
The scatter diagram and the least-squares line are shown in Figure 43.
b 3
17
5
2
5
0.4
m 1
10m 10
45m 51 55m 61
15 a3m
17
5
b 55m 61
b 3m
17
5
15b 55m 61
5b 15m 17
where the constants m and b satisfy the normal equations
(9)
(10)
simultaneously.
x
1
y
1
x
2
y
2
p
x
n
y
n
1x
1
x
2
p
x
n
2b 1x
2
1
x
2
2
p
x
2
n
2m
nb 1x
1
x
2
p
x
n
2m y
1
y
2
p
y
n
x
12345
y
6
5
4
3
2
1
y = x
+ 0.4
FIGURE 43
The least-squares line y x 0.4 and
the given data points
87533_01_ch1_p001-066 1/30/08 9:37 AM Page 53
54 1 STRAIGHT LINES AND LINEAR FUNCTIONS
APPLIED EXAMPLE 2
Advertising and Profit The proprietor of Lei-
sure Travel Service compiled the following data relating the annual profit
of the firm to its annual advertising expenditure (both measured in thousands of
dollars):
Annual Advertising
12 14 17 21 26 30
Expenditure, x
Annual Profit, y 60 70 90 100 100 120
a. Determine the equation of the least-squares line for these data.
b. Draw a scatter diagram and the least-squares line for these data.
c. Use the result obtained in part (a) to predict Leisure Travel’s annual profit if
the annual advertising budget is $20,000.
Solution
a. The calculations required for obtaining the normal equations are summarized
in the following table:
xyx
2
xy
12 60 144 720
14 70 196 980
17 90 289 1,530
21 100 441 2,100
26 100 676 2,600
30 120 900 3,600
Sum 120 540 2646 11,530
The normal equations are
(14)
(15)
Solving Equation (14) for b gives
b 20m 90 (16)
which upon substitution into Equation (15) gives
Substituting this value of m into Equation (16) gives
Therefore, the required least-squares line is given by
y f (x) 2.97x 30.6
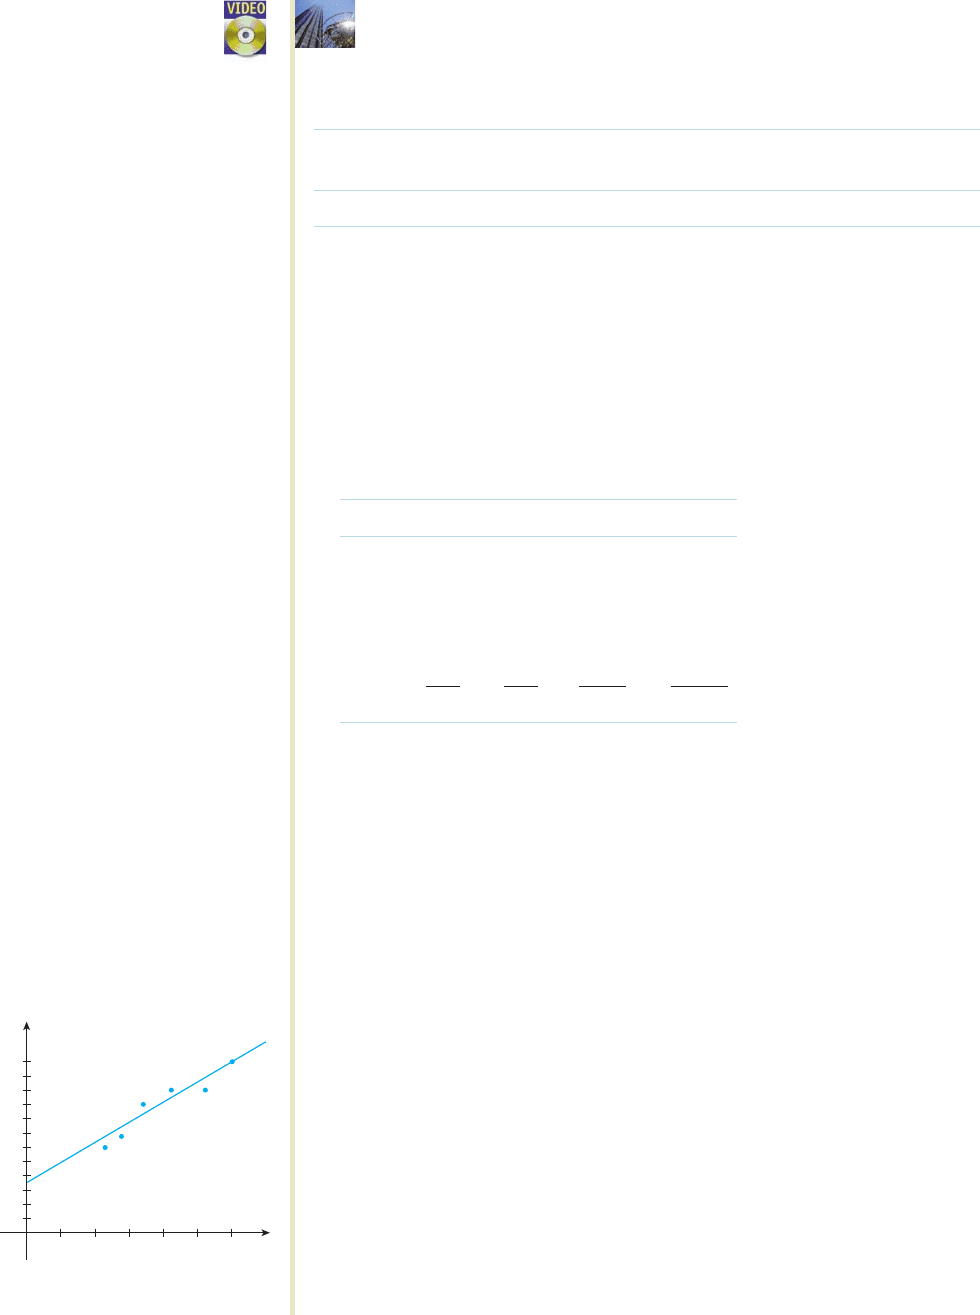
b. The scatter diagram and the least-squares line are shown in Figure 44.
b 2012.972 90 30.6
m ⬇ 2.97
246m 730
2400m 10,800 2646m 11,530
120120m 902 2646m 11,530
120b 2646m 11,530
6b 0120m 540
x
5
y
100
50
y = 2.97x + 30.6
1
0 15
(thousands of dollars)
(thousands of dollars)
20 25 30
FIGURE 44
Profit versus advertising expenditure
87533_01_ch1_p001-066 1/30/08 9:37 AM Page 54

c. Leisure Travel’s predicted annual profit corresponding to an annual budget of
$20,000 is given by
f(20) 2.97(20) 30.6 90
or $90,000.
APPLIED EXAMPLE 3
U.S. Health-Care Expenditures Refer to
Example 1 of Section 1.3. Because the over-65 population will be growing
more rapidly in the next few decades, health-care spending is expected to
increase significantly in the coming decades. The following table gives the U.S.
health expenditures (in trillions of dollars) from 2005 through 2010, where t is
measured in years, with t 0 corresponding to 2005.
Year, t 012345
Expenditure, y 2.00 2.17 2.34 2.50 2.69 2.90
(The figures after 2006 are estimates.) Find a function giving the U.S. health-care
spending between 2005 and 2010, using the least-squares technique.
Solution
The calculations required for obtaining the normal equations are sum-
marized in the following table:
tyt
2
ty
0 2.00 0 0
1 2.17 1 2.17
2 2.34 4 4.68
3 2.50 9 7.50
4 2.69 16 10.76
5 2.90 25 14.50
15 14.6 55 39.61
The normal equations are
(17)
(18)
Solving Equation (17) for b gives
b ⬇ 2.5m 2.4333 (19)
which upon substitution into Equation (18) gives
Substituting this value of m into Equation (19) gives
b ⬇ 2.5(0.1777) 2.4333 ⬇ 1.9891
Therefore, the required function is
S(t) 0.178t 1.989
m ⬇ 0.1777
17.5m 3.1105
37.5m 36.4995 55m 39.61
1512.5m 2.43332 55m 39.61
15b 55m 39.61
6b 15m 14.6
1.5 THE METHOD OF LEAST SQUARES 55
87533_01_ch1_p001-066 1/30/08 9:37 AM Page 55

56 1 STRAIGHT LINES AND LINEAR FUNCTIONS
1. Explain the terms (a) scatter diagram and (b) least-squares
line.
2. State the principle of least squares in your own words.
In Exercises 1–6, (a) find the equation of the least-
squares line for the data and (b) draw a scatter diagram
for the data and graph the least-squares line.
1.
2.
3.
4.
5. P
1
(1, 3), P
2
(2, 5), P
3
(3, 5), P
4
(4, 7), P
5
(5, 8)
6. P
1
(1, 8), P
2
(2, 6), P
3
(5, 6), P
4
(7, 4), P
5
(10, 1)
7. C
OLLEGE
A
DMISSIONS
The accompanying data were com-
piled by the admissions office at Faber College during the
past 5 yr. The data relate the number of college brochures
and follow-up letters (x) sent to a preselected list of high
school juniors who had taken the PSAT and the number of
completed applications (y) received from these students
(both measured in units of a thousand).
a. Determine the equation of the least-squares line for
these data.
b. Draw a scatter diagram and the least-squares line for
these data.
x 4 4.5 5 5.5 6
y 0.5 0.6 0.8 0.9 1.2
x 112 3 4 45
y 2333.53.545
x 123446
y 4.55323.51
x 13579
y 98632
x 123 4
y 46811
c. Use the result obtained in part (a) to predict the number
of completed applications expected if 6400 brochures
and follow-up letters are sent out during the next year.
8. S
TARBUCKS
S
TORE
C
OUNT
According to Company Reports,
the number of Starbucks stores worldwide between 1999
and 2003 were as follows (x 0 corresponds to 1999):
a. Find an equation of the least-squares line for these data.
b. Use the result of part (a) to estimate the rate at which new
stores were opened annually in North America for the
period in question.
Source: Company Reports
9. SAT V
ERBAL
S
CORES
The accompanying data were com-
piled by the superintendent of schools in a large metropol-
itan area. The table shows the average SAT verbal scores
of high school seniors during the 5 yr since the district
implemented its “back to basics” program.
a. Determine the equation of the least-squares line for
these data.
b. Draw a scatter diagram and the least-squares line for
these data.
c. Use the result obtained in part (a) to predict the average
SAT verbal score of high school seniors 2 yr from now
(x 7).
Year, x 12345
Average
Score, y 436 438 428 430 426
Year, x 01 2 3 4
Stores, y 2135 3501 4709 5886 7225
1.5 Self-Check Exercises
1. Find an equation of the least-squares line for the data
x 13457
y 410111216
2. In a market research study for Century Communications,
the following data were provided based on the projected
monthly sales x (in thousands) of a DVD version of a box-
office-hit adventure movie with a proposed wholesale unit
price of p dollars.
x 2.2 5.4 7.0 11.5 14.6
p 38.0 36.0 34.5 30.0 28.5
Find the demand equation if the demand curve is the least-
squares line for these data.
Solutions to Self-Check Exercises 1.5 can be found on
page 59.
1.5 Exercises
1.5 Concept Questions
87533_01_ch1_p001-066 1/30/08 9:37 AM Page 56

10. N
ET
S
ALES
The management of Kaldor, a manufacturer of
electric motors, submitted the accompanying data in its
annual stockholders report. The following table shows the
net sales (in millions of dollars) during the 5 yr that have
elapsed since the new management team took over.
(The first year the firm operated under the new manage-
ment corresponds to the time period x 1, and the four
subsequent years correspond to x 2, 3, 4, and 5.)
a. Determine the equation of the least-squares line for
these data.
b. Draw a scatter diagram and the least-squares line for
these data.
c. Use the result obtained in part (a) to predict the net sales
for the upcoming year.
11. M
ASS
-T
RANSIT
S
UBSIDIES
The following table gives the
projected state subsidies (in millions of dollars) to the
Massachusetts Bay Transit Authority (MBTA) over a 5-yr
period.
a. Find an equation of the least-squares line for these data.
b. Use the result of part (a) to estimate the state subsidy to
the MBTA for the eighth year (x 8).
Source: Massachusetts Bay Transit Authority
12. I
NFORMATION
S
ECURITY
S
OFTWARE
S
ALES
As online attacks
persist, spending on information security software contin-
ues to rise. The following table gives the forecast for the
worldwide sales (in billions of dollars) of information
security software through 2007 (t 0 corresponds to
2002):
a. Find an equation of the least-squares line for these data.
b. Use the result of part (a) to forecast the spending on
information security software in 2008, assuming that
the trend continues.
Source: International Data Corporation
13. U.S. D
RUG
S
ALES
The following table gives the total sales
of drugs (in billions of dollars) in the United States from
1999 (t 0) through 2003:
a. Find an equation of the least-squares line for these data.
b. Use the result of part (a) to predict the total sales of
drugs in 2005, assuming that the trend continued.
Source: IMS Health
Year, t 01234
Sales, y 126 144 171 191 216
Year, t 01234 5
Spending, y 6.8 8.3 9.8 11.3 12.8 14.9
Year, x 12345
Subsidy, y 20 24 26 28 32
Year, x 12345
Net Sales, y 426 437 460 473 477
1.5 THE METHOD OF LEAST SQUARES 57
14. IRA A
SSETS
The value of all individual retirement
accounts (in trillions of dollars) from 2002 through 2005 is
summarized in the following table:
a. Letting x 2 denote 2002, find an equation of the least-
squares line for these data.
b. Use the results of part (a) to estimate the value of all
IRAs in 2006, assuming that the trend continued.
c. Use the result of part (a) to estimate how fast the value
of all IRAs was growing over the period from 2002
through 2005.
Source: ici.org
15. PC G
ROWTH
The following table gives the projected ship-
ment of personal computers worldwide (in millions of
units) from 2004 through 2008 (x 4 corresponds to
2004):
a. Find an equation of the least-squares line for these data.
b. Use the results of part (a) to estimate the shipment of
PCs worldwide in 2009, assuming that the projected
trend continues.
Source: International Data Corporation
16. O
NLINE
S
PENDING
The convenience of shopping on the
Web combined with high-speed broadband access services
are spurring online spending. The projected online spend-
ing per buyer (in dollars) from 2002 (x 0) through 2008
(x 6) is given in the following table:
a. Find an equation of the least-squares line for these data.
b. Use the result of part (a) to estimate the rate of change
of spending per buyer between 2002 and 2008.
Source: U.S. Department of Commerce
17. C
ALLING
C
ARDS
The market for prepaid calling cards is
projected to grow steadily through 2008. The following
table gives the projected sales of prepaid phone card sales
(in billions of dollars) from 2002 through 2008 (x 0 cor-
responds to 2002):
a. Find an equation of the least-squares line for these data.
b. Use the result of part (a) to estimate the rate at which the
sales of prepaid phone cards will grow over the period
in question.
Source: Atlantic-ACM
Year, x 01 2 3 4 5 6
Sales, y 3.7 4.0 4.4 4.8 5.2 5.8 6.3
Year, x 0123456
Spending, y 501 540 585 631 680 728 779
Year, x 45678
Number, y 174 205 228 253 278
Year 2002 2003 2004 2005
Value, y 2.6 3.0 3.3 3.7
87533_01_ch1_p001-066 1/30/08 9:37 AM Page 57

58 1 STRAIGHT LINES AND LINEAR FUNCTIONS
18. W
ORLDWIDE
C
ONSULTING
S
PENDING
The following table
gives the projected worldwide consulting spending (in bil-
lions of dollars) from 2005 through 2009 (x 5 corre-
sponds to 2005):
a. Find an equation of the least-squares line for these data.
b. Use the results of part (a) to estimate the average rate of
increase of worldwide consulting spending over the
period under consideration.
c. Use the results of part (a) to estimate the amount of
spending in 2010, assuming that the trend continues.
Source: Kennedy Information
19. R
EVENUE OF
M
OODY
’
S
C
ORPORATION
Moody’s Corporation
is the holding company for Moody’s Investors Service,
which has a 40% share in the world credit-rating market.
According to Company Reports, the total revenue (in bil-
lions of dollars) of the company is projected to be as fol-
lows (x 0 correspond to 2004):
a. Find an equation of the least-squares line for these
data.
b. Use the results of part (a) to estimate the rate of change
of the revenue of the company for the period in ques-
tion.
c. Use the result of part (a) to estimate the total revenue of
the company in 2010, assuming that the trend continues.
Source: Company Reports
20. U.S. O
NLINE
B
ANKING
H
OUSEHOLDS
The following table
gives the projected U.S. online banking households as a per-
centage of all U.S. banking households from 2001 (x 1)
through 2007 (x 7):
a. Find an equation of the least-squares line for these data.
b. Use the result of part (a) to estimate the projected per-
centage of U.S. online banking households in 2008.
Source: Jupiter Research
21. U.S. O
UTDOOR
A
DVERTISING
U.S. outdoor advertising
expenditure (in billions of dollars) from 2002 through 2006
is given in the following table (x 0 correspond to 2002):
a. Find an equation of the least-squares line for these data.
b. Use the result of part (a) to estimate the rate of change of
the advertising expenditures for the period in question.
Source: Outdoor Advertising Association
Year 2002 2003 2004 2005 2006
Expenditure, y 5.3 5.6 5.9 6.4 6.9
Year, x 1234567
Percentage of
Households, y 21.2 26.7 32.2 37.7 43.2 48.7 54.2
Year 2004 2005 2006 2007 2008
Revenue, y 1.42 1.73 1.98 2.32 2.65
Year, x 56789
Spending, y 254 279 300 320 345
22. O
NLINE
S
ALES OF
U
SED
A
UTOS
The amount (in millions of
dollars) of used autos sold online in the United States is ex-
pected to grow in accordance with the figures given in the
following table (x 0 corresponds to 2000):
a. Find an equation of the least-squares line for these data.
b. Use the result of part (a) to estimate the sales of used
autos online in 2008, assuming that the predicted trend
continued through that year.
Source: comScore Networks Inc.
23. S
OCIAL
S
ECURITY
W
AGE
B
ASE
The Social Security (FICA)
wage base (in thousands of dollars) from 2003 to 2008 is
given in the accompanying table (x 1 corresponds to
2003):
a. Find an equation of the least-squares line for these data.
b. Use the result of part (a) to estimate the FICA wage
base in 2012.
Source: The World Almanac
24. S
ALES OF
GPS E
QUIPMENT
The annual sales (in billions of
dollars) of global positioning system (GPS) equipment
from the year 2000 through 2006 follow (x 0 corre-
sponds to the year 2000):
a. Find an equation of the least-squares line for these data.
b. Use the equation found in part (a) to estimate the annual
sales of GPS equipment for 2008, assuming that the
trend continued.
Source: ABI Research
25. M
ALE
L
IFE
E
XPECTANCY AT
65 The Census Bureau projec-
tions of male life expectancy at age 65 in the United States
are summarized in the following table (x 0 corresponds
to 2000):
a. Find an equation of the least-squares line for these data.
b. Use the result of part (a) to estimate the life expectancy
at 65 of a male in 2040. How does this result compare
with the given data for that year?
c. Use the result of part (a) to estimate the life expectancy
at 65 of a male in 2030.
Source: U.S. Census Bureau
Year, x 01020304050
Years
beyond 65, y 15.9 16.8 17.6 18.5 19.3 20.3
Year, x 0 123456
Annual Sales, y 7.9 9.6 11.5 13.3 15.2 16.0 18.8
Year 2006 2007 2008
Wage Base, y 94.2 97.5 102.6
Year 2003 2004 2005
Wage Base, y 87 87.9 90.0
Year, x 01 2 3 4 5 67
Sales, y 1.0 1.4 2.2 2.8 3.6 4.2 5.0 5.8
87533_01_ch1_p001-066 1/30/08 9:37 AM Page 58

26. A
UTHENTICATION
T
ECHNOLOGY
With computer security
always a hot-button issue, demand is growing for technol-
ogy that authenticates and authorizes computer users. The
following table gives the authentication software sales (in
billions of dollars) from 1999 through 2004 (x 0 repre-
sents 1999):
a. Find an equation of the least-squares line for these data.
b. Use the result of part (a) to estimate the sales for 2007,
assuming the trend continues.
Source: International Data Corporation
27. C
ORN
U
SED IN
U.S. E
THANOL
P
RODUCTION
The amount of
corn used in the United States for the production of ethanol
is expected to rise steadily as the demand for plant-based
fuels continue to increase. The following table gives the
projected amount of corn (in billions of bushels) used for
ethanol production from 2005 through 2010 (x 1 corre-
sponds to 2005):
a. Find an equation of the least-squares line for these data.
b. Use the result of part (a) to estimate the amount of corn
that will be used for the production of ethanol in 2011 if
the trend continues.
Source: U.S. Department of Agriculture
Year, x 12 3 4 5 6
Amount, y 1.4 1.6 1.8 2.1 2.3 2.5
Year, x 012345
Sales, y 2.4 2.9 3.7 4.5 5.2 6.1
1.5 THE METHOD OF LEAST SQUARES 59
28. O
PERATIONS
M
ANAGEMENT
C
ONSULTING
S
PENDING
The fol-
lowing table gives the projected operations management
consulting spending (in billions of dollars) from 2005
through 2010 (x 5 corresponds to 2005):
a. Find an equation of the least-squares line for these data.
b. Use the results of part (a) to estimate the average rate of
change of operations management consulting spending
from 2005 through 2010.
c. Use the results of part (a) to estimate the amount of
spending on operations management consulting in
2011, assuming that the trend continues.
Source: Kennedy Information
In Exercises 29–32, determine whether the statement is
true or false. If it is true, explain why it is true. If it is
false, give an example to show why it is false.
29. The least-squares line must pass through at least one data
point.
30. The error incurred in approximating n data points using the
least-squares linear function is zero if and only if the n data
points lie on a nonvertical straight line.
31. If the data consist of two distinct points, then the least-
squares line is just the line that passes through the two
points.
32. A data point lies on the least-squares line if and only if the
vertical distance between the point and the line is equal to
zero.
Year, x 56 7 8 910
Spending, y 40 43.2 47.4 50.5 53.7 56.8
1.5 Solutions to Self-Check Exercises
1. The calculations required for obtaining the normal equa-
tions may be summarized as follows:
xyx
2
xy
1414
310 9 30
4111644
5122560
716 49112
Sum 20 53 100 250
The normal equations are
Solving the first equation for b gives
b 4m
53
5
20b 100m 250
5b 20m 53
which, upon substitution into the second equation, yields
Substituting this value of m into the expression for b found
earlier, we find
Therefore, an equation of the least-squares line is
y 1.9x 3
b 411.92
53
5
3
m 1.9
20m 38
80m 212 100m 250
20 a4m
53
5
b 100m 250
87533_01_ch1_p001-066 1/30/08 9:37 AM Page 59

60 1 STRAIGHT LINES AND LINEAR FUNCTIONS
2. The calculations required for obtaining the normal equa-
tions may be summarized as follows:
xp x
2
xp
2.2 38.0 4.84 83.6
5.4 36.0 29.16 194.4
7.0 34.5 49.00 241.5
11.5 30.0 132.25 345.0
14.6 28.5 213.16 416.1
Sum 40.7 167.0 428.41 1280.6
The normal equations are
40.7b 428.41m 1280.6
5b 40.7m 167
Solving this system of linear equations simultaneously, we
find that
m ⬇ 0.81 and b ⬇ 40.00
Therefore, an equation of the least-squares line is given by
p f (x) 0.81x 40
which is the required demand equation provided
0 x 49.38
Finding an Equation of a Least-Squares Line
Graphing Utility
A graphing utility is especially useful in calculating an equation of the least-squares
line for a set of data. We simply enter the given data in the form of lists into the cal-
culator and then use the linear regression function to obtain the coefficients of the
required equation.
EXAMPLE 1
Find an equation of the least-squares line for the data
x 1.1 2.3 3.2 4.6 5.8 6.7 8
y 5.8 5.1 4.8 4.4 3.7 3.2 2.5
Plot the scatter diagram and the least-squares line for this data.
Solution
First, we enter the data as
x
1
1.1 y
1
5.8 x
2
2.3 y
2
5.1 x
3
3.2
y
3
4.8 x
4
4.6 y
4
4.4 x
5
5.8 y
5
3.7
x
6
6.7 y
6
3.2 x
7
8.0 y
7
2.5
Then, using the linear regression function from the statistics menu, we obtain
the output shown in Figure T1a. Therefore, an equation of the least-squares line
( y ax b) is
y 0.46x 6.3
(a) The TI-83/84 linear regression screen (b) The scatter diagram and least-squares
line for the data
The graph of the least-squares equation and the scatter diagram for the data are shown
in Figure T1b.
LinReg
y = ax+b
a = .4605609794
b = −6.299969007
USING
TECHNOLOGY
FIGURE T1
87533_01_ch1_p001-066 1/30/08 9:37 AM Page 60

1.5 THE METHOD OF LEAST SQUARES 61
APPLIED EXAMPLE 2
Demand for Electricity According to Pacific
Gas and Electric, the nation’s largest utility company, the demand for
electricity from 1990 through 2000 is summarized in the following table:
t 02 4 6810
y 333 917 1500 2117 2667 3292
Here t 0 corresponds to 1990, and y gives the amount of electricity demanded
in the year t, measured in megawatts. Find an equation of the least-squares line
for these data.
Source: Pacific Gas and Electric
Solution
First, we enter the data as
x
1
0 y
1
333 x
2
2 y
2
917 x
3
4 y
3
1500
x
4
6 y
4
2117 x
5
8 y
5
2667 x
6
10 y
6
3292
Then, using the linear regression function from the statistics menu, we obtain the
output shown in Figure T2. Therefore, an equation of the least-squares line is
y 295t 328
Excel
Excel can be used to find an equation of the least-squares line for a set of data and to
plot a scatter diagram and the least-squares line for the data.
EXAMPLE 3
Find an equation of the least-squares line for the data given in the
following table:
x 1.1 2.3 3.2 4.6 5.8 6.7 8.0
y 5.8 5.1 4.8 4.4 3.7 3.2 2.5
Plot the scatter diagram and the least-squares line for these data.
Solution
1. Set up a table of values on a spreadsheet (Figure T3).
2. Plot the scatter diagram. Highlight the numerical values in the table of values.
Click the button on the toolbar. Follow the procedure given in
Example 3, page 38, with these exceptions: In step 1, select the first chart in the
first column under Chart sub-t
ype:; in step 3, in the Chart title: box, type Scat-
ter diagram and least-squares line. The scatter diagram will appear.
3. Insert the least-squares line. First, click on the menu bar and then click
. Next, select the graph and then click the
tab. Finally select and then click . The equation
y 0.4606x 6.3
will appear on the chart (Figure T4).
OK
Display equation on chart
OptionsLinearAdd Trendline
Chart
Chart Wizard
(continued)
Note: Boldfaced words/characters enclosed in a box (for example, ) indicate that an action (click, select,
or press) is required. Words/characters printed blue (for example, Chart sub-t
ype:) indicate words/characters that appear on the
screen. Words/characters printed in a typewriter font (for example, =(—2/3)*A2+2) indicate words/characters that need to be
typed and entered.
Enter
AB
1x y
2 1.1 −5.8
3 2.3 −5.1
4 3.2 −4.8
5 4.6 −4.4
6 5.8 −3.7
7 6.7 −3.2
88−2.5
FIGURE T3
Table of values for x and y
FIGURE T2
The TI-83/84 linear regression screen
LinReg
y = ax+b
a = 295.1714286
b = 328.4761905
87533_01_ch1_p001-066 1/30/08 9:37 AM Page 61