Tan S.T. Finite Mathematics for the Managerial, Life, and Social Sciences
Подождите немного. Документ загружается.


482 8 PROBABILITY DISTRIBUTIONS AND STATISTICS
3. Find the mean, variance, and standard deviation of a ran-
dom variable X having the following probability distribu-
tion:
x 3 10 1 3 5
P(X x) .08 .24 .32 .16 .12 .08
4. A binomial experiment consists of four independent trials,
and the probability of success in each trial is 0.3.
a. Find the probability of obtaining 0, 1, 2, 3, and 4 suc-
cesses, respectively.
b. Compute the mean and standard deviation of the ran-
dom variable associated with this experiment.
5. Let X be a normal random variable with 60 and
5. Find the values of (a) P(X 70), (b) P(X 50),
and (c) P(50 X 70).
6. A fair coin is tossed 30 times. Using the appropriate nor-
mal distribution to approximate a binomial distribution,
find the probability of obtaining (a) fewer than 10 heads,
(b) between 12 and 16 heads, inclusive, and (c) more than
20 heads.
87533_08_ch8_p417-482 1/30/08 10:10 AM Page 482

After the successful implementation
of an urban renewal program, what
percentage of the population of a
metropolitan area will live in the city,
and what percentage of the
population will live in the suburbs?
In Examples 4 and 5, pages
487–488, we show how we can find
the population distribution over the
next few years for a population that
can be described by a Markov
process.
I
N THIS CHAPTER, we look at two important applications of
mathematics that are based primarily on matrix theory and the
theory of probability. Both of these applications, Markov chains
and the theory of games, are relatively recent developments in
the field of mathematics and have wide applications in many
practical areas.
MARKOV CHAINS
AND THE THEORY
OF GAMES
9
© A&L Sinibaldi/Getty Images
87533_09_ch9_p483-536 1/30/08 10:12 AM Page 483
484 9 MARKOV CHAINS AND THE THEORY OF GAMES
Transitional Probabilities
A finite stochastic process, you may recall, is an experiment consisting of a finite num-
ber of stages in which the outcomes and associated probabilities at each stage depend on
the outcomes and associated probabilities of the preceding stages. In this chapter, we are
concerned with a special class of stochastic processes—namely, those in which the prob-
abilities associated with the outcomes at any stage of the experiment depend only on the
outcomes of the preceding stage. Such a process is called a Markov process, or a
Markov chain, named after the Russian mathematician A. A. Markov (1856–1922).
The outcome at any stage of the experiment in a Markov process is called the
state of the experiment. In particular, the outcome at the current stage of the experi-
ment is called the current state of the process. Here is a typical problem involving a
Markov chain:
Starting from one state of a process (the current state), determine the probability that
the process will be at a particular state at some future time.
APPLIED EXAMPLE 1
Common Stocks An analyst at Weaver and
Kline, a stock brokerage firm, observes that the closing price of the pre-
ferred stock of an airline company over a short span of time depends only on its
previous closing price. At the end of each trading day, he makes a note of the
stock’s performance for that day, recording the closing price as “higher,”
“unchanged,” or “lower” according to whether the stock closes higher, un-
changed, or lower than the previous day’s closing price. This sequence of obser-
vations may be viewed as a Markov chain.
The transition from one state to another in a Markov chain may be studied with
the aid of tree diagrams, as in the next example.
APPLIED EXAMPLE 2
Common Stocks Refer to Example 1. If on a
certain day the stock’s closing price is higher than that of the previous day,
then the probability that it closes higher, unchanged, or lower on the next trading
day is .2, .3, and .5, respectively. Next, if the stock’s closing price is unchanged
from the previous day, then the probability that it closes higher, unchanged, or
lower on the next trading day is .5, .2, and .3, respectively. Finally, if the stock’s
closing price is lower than that of the previous day, then the probability that it
closes higher, unchanged, or lower on the next trading day is .4, .4, and .2, re-
spectively. With the aid of tree diagrams, describe the transition between states
and the probabilities associated with these transitions.
Solution
The Markov chain being described has three states: higher, un-
changed, and lower. If the current state is higher, then the transition to the other
states from this state may be displayed by constructing a tree diagram in which the
associated probabilities are shown on the appropriate limbs (Figure 1). Tree dia-
Higher
Higher
Unchanged
Lower
.3
.2
.5
Unchanged
Higher
Unchanged
Lower
.2
.5
.3
Lower
Higher
Unchanged
Lower
.4
.4
.2
FIGURE 1
Tree diagrams showing transition probabilities between states
9.1 Markov Chains
87533_09_ch9_p483-536 1/30/08 10:12 AM Page 484

grams describing the transition from each of the other two possible current states,
unchanged and lower, to the other states are constructed in a similar manner.
The probabilities encountered in this example are called transition probabilities
because they are associated with the transition from one state to the next in the Markov
process. These transition probabilities may be conveniently represented in the form
of a matrix. Suppose for simplicity that we have a Markov chain with three possible
outcomes at each stage of the experiment. Let’s refer to these outcomes as state 1,
state 2, and state 3. Then the transition probabilities associated with the transition from
state 1 to each of the states 1, 2, and 3 in the next phase of the experiment are precisely
the respective conditional probabilities that the outcome is state 1, state 2, and state 3
given that the outcome state 1 has occurred. In short, the desired transition probabili-
ties are P(state 1 兩 state 1), P(state 2 兩 state 1), and P(state 3 兩 state 1), respectively.
Thus, we write
Next state
a
11
P(state 1 兩 state 1)
a
21
P(state 2 兩 state 1)
a
31
P(state 3 兩 state 1)
Current state
Note that the first subscript in this notation refers to the state in the next stage of the
experiment, and the second subscript refers to the current state. Using a tree diagram,
we have the following representation:
Similarly, the transition probabilities associated with the transition from state 2 and
state 3 to each of the states 1, 2, and 3 are
a
12
P(state 1 兩 state 2) and a
13
P(state 1 兩 state 3)
a
22
P(state 2 兩 state 2) a
23
P(state 2 兩 state 3)
a
32
P(state 3 兩 state 2) a
33
P(state 3 兩 state 3)
These observations lead to the following matrix representation of the transition
probabilities:
Current state
State 1 State 2 State 3
State 1
Next state State 2
State 3
EXAMPLE 3
Use a matrix to represent the transition probabilities obtained in
Example 2.
Solution
There are three states at each stage of the Markov chain under considera-
tion. Letting state 1, state 2, and state 3 denote the states “higher,” “unchanged,”
and “lower,” respectively, we find that
a
11
.2 a
21
.3 a
31
.5
£
a
11
a
12
a
13
a
21
a
22
a
23
a
31
a
32
a
33
§
State 1
State 1
State 2
State 3
a
21
a
11
a
31
9.1 MARKOV CHAINS 485
—
씮
—
씮
—
씮
—————
씮
87533_09_ch9_p483-536 1/30/08 10:12 AM Page 485

and so on, so the required matrix representation is given by
T
The matrix obtained in Example 3 is a transition matrix. In the general case, we
have the following definition:
Since a
ij
P(state i 兩 state j) is the probability of the occurrence of an event, it must
be nonnegative, and this is precisely what Property 1 implies. Property 2 follows from
the fact that the transition from any one of the current states must terminate in one of
the n states in the next stage of the experiment. Any square matrix satisfying proper-
ties 1 and 2 is referred to as a stochastic matrix.
One advantage in representing the transition probabilities in the form of a matrix
is that we may use the results from matrix theory to help us solve problems involving
Markov processes, as we will see in the next several sections.
Next, for simplicity, let’s consider the following Markov process where each
stage of the experiment has precisely two possible states.
Transition Matrix
A transition matrix associated with a Markov chain with n states is an n n
matrix T with entries a
ij
(1 i n, 1 j n)
having the following properties:
1. a
ij
0 for all i and j.
2. The sum of the entries in each column of T is 1.
£
.2 .5 .4
.3 .2 .4
.5 .3 .2
§
486 9 MARKOV CHAINS AND THE THEORY OF GAMES
Current state
State 1 State 2
. . .
State j
. . .
State n
State 1 a
11
a
12
. . .
a
1j
. . .
a
1n
State 2 a
21
a
22
. . .
a
2j
. . .
a
2n
. .. . .
. .. . .
. .. . .
T
State i a
i1
a
i2
. . .
a
ij
. . .
a
in
. .. . .
. .. . .
. .. . .
State n a
n1
a
n2
. . .
a
nj
. . .
a
nn
Next
state
Explore & Discuss
Let
A and B
be two 2 2 stochastic matrices, where 0 p 1, 0 q 1, 0 r 1, and
0 s 1.
1. Show that AB is a 2 2 stochastic matrix.
2. Use the result of part (a) to explain why A
2
, A
3
, . . . , A
n
, where n is a positive integer,
are also 2 2 stochastic matrices.
c
rs
1 r 1 s
dc
pq
1 p 1 q
d
87533_09_ch9_p483-536 1/30/08 10:12 AM Page 486
APPLIED EXAMPLE 4
Urban–Suburban Population Flow Because
of the continued successful implementation of an urban renewal program, it
is expected that each year 3% of the population currently residing in the city will
move to the suburbs and 6% of the population currently residing in the suburbs
will move into the city. At present, 65% of the total population of the metropoli-
tan area lives in the city itself, while the remaining 35% lives in the suburbs.
Assuming that the total population of the metropolitan area remains constant,
what will be the distribution of the population 1 year from now?
Solution
This problem may be solved with the aid of a tree diagram and the
techniques of Chapter 7. The required tree diagram describing this process is
shown in Figure 2. Using the method of Section 7.5, we find that the probabil-
ity that a person selected at random will be a city dweller 1 year from now is
given by
(.65)(.97) (.35)(.06) .6515
In a similar manner, we find that the probability that a person selected at random
will reside in the suburbs 1 year from now is given by
(.65)(.03) (.35)(.94) .3485
Thus, the population of the area 1 year from now may be expected to be distrib-
uted as follows: 65.15% living in the city and 34.85% residing in the suburbs.
Let’s reexamine the solution to this problem. As noted earlier, the process under
consideration may be viewed as a Markov chain with two possible states at each stage
of the experiment: “living in the city” (state 1) and “living in the suburbs” (state 2).
The transition matrix associated with this Markov chain is
State 1 State 2
T Transition matrix
Next, observe that the initial (current) probability distribution of the population may
be summarized in the form of a column vector of dimension 2 (that is, a 2 1 matrix).
Thus,
X
0
Initial-state matrix
Using the results of Example 4, we may write the population distribution 1 year later
as
X
1
Distribution after 1 year
c
.6515
.3485
d
State 1
State 2
c
.65
.35
d
State 1
State 2
c
.97 .06
.03 .94
d
State 1
State 2
City
.65
.35
City
.97
.03
City
.06
.94
Current
population
Population
one year later
Suburbs
Suburbs
Suburbs
9.1 MARKOV CHAINS 487
FIGURE 2
Tree diagram showing a Markov process
with two states: living in the city and liv-
ing in the suburbs
87533_09_ch9_p483-536 1/30/08 10:12 AM Page 487
You may now verify that
so this problem may be solved using matrix multiplication.
APPLIED EXAMPLE 5
Urban–Suburban Population Flow Refer to
Example 4. What is the population distribution of the city after 2 years?
After 3 years?
Solution
Let X
2
be the column vector representing the population distribu-
tion of the metropolitan area after 2 years. We may view X
1
, the vector
representing the population distribution of the metropolitan area after 1 year,
as representing the “initial” probability distribution in this part of our calcula-
tion. Thus,
The vector representing the probability distribution of the metropolitan area after
3 years is given by
That is, after 3 years, the population will be distributed as follows: 65.41% will
live in the city, and 34.59% will live in the suburbs.
Distribution Vectors
Observe that, in the foregoing computations, we have X
1
TX
0
, X
2
TX
1
T
2
X
0
,
and X
3
TX
2
T
3
X
0
. These results are easily generalized. To see this, suppose
we have a Markov process in which there are n possible states at each stage of
the experiment. Suppose further that the probability of the system being in state 1,
state 2, . . . , state n, initially, is given by p
1
, p
2
, . . . , p
n
, respectively. This distri-
bution may be represented as an n-dimensional vector
p
1
p
2
X
0
冤
冥
p
n
called a distribution vector. If T represents the n n transition matrix associated
with the Markov process, then the probability distribution of the system after m obser-
vations is given by
X
m
T
m
X
0
(1)
APPLIED EXAMPLE 6
Taxicab Movement To keep track of the loca-
tion of its cabs, Zephyr Cab has divided a town into three zones: zone I,
zone II, and zone III. Zephyr’s management has determined from company
records that of the passengers picked up in zone I, 60% are discharged in the
X
3
TX
2
⬇ c
.97 .06
.03 .94
d c
.6529
.3471
d⬇ c
.6541
.3459
d
X
2
TX
1
c
.97 .06
.03 .94
d c
.6515
.3485
d⬇ c
.6529
.3471
d
TX
0
c
.97 .06
.03 .94
d c
.65
.35
d c
.6515
.3485
d X
1
488 9 MARKOV CHAINS AND THE THEORY OF GAMES
87533_09_ch9_p483-536 1/30/08 10:12 AM Page 488

same zone, 30% are discharged in zone II, and 10% are discharged in zone III.
Of those picked up in zone II, 40% are discharged in zone I, 30% are discharged
in zone II, and 30% are discharged in zone III. Of those picked up in zone III,
30% are discharged in zone I, 30% are discharged in zone II, and 40% are dis-
charged in zone III. At the beginning of the day, 80% of the cabs are in zone I,
15% are in zone II, 5% are in zone III. Furthermore, a taxi without a passenger
will cruise within the zone it is currently in until a pickup is made.
a. Find the transition matrix for the Markov chain that describes the successive
locations of a cab.
b. What is the distribution of the cabs after all of them have made one pickup
and discharge?
c. What is the distribution of the cabs after all of them have made two pickups
and discharges?
Solution
Let zone I, zone II, and zone III correspond to state 1, state 2, and state 3
of the Markov chain.
a. The required transition matrix is given by
b. The initial distribution vector associated with the problem is
If X
1
denotes the distribution vector after one observation—that is, after all the
cabs have made one pickup and discharge—then
That is, 55.5% of the cabs are in zone I, 30% are in zone II, and 14.5% are in
zone III.
c. Let X
2
denote the distribution vector after all the cabs have made two pickups
and discharges. Then
That is, 49.65% of the cabs are in zone I, 30% are in zone II, and 20.35% are
in zone III. You should verify that the same result may be obtained by com-
puting T
2
X
0
.
Note
In this simplified model, we do not take into consideration variable demand
and variable delivery time.
£
.6 .4 .3
.3 .3 .3
.1 .3 .4
§ £
.555
.300
.145
§ £
.4965
.3000
.2035
§
X
2
TX
1
£
.6 .4 .3
.3 .3 .3
.1 .3 .4
§ £
.80
.15
.05
§ £
.555
.300
.145
§
X
1
TX
0
X
0
£
.80
.15
.05
§
T £
.6 .4 .3
.3 .3 .3
.1 .3 .4
§
9.1 MARKOV CHAINS 489
87533_09_ch9_p483-536 1/30/08 10:12 AM Page 489

490 9 MARKOV CHAINS AND THE THEORY OF GAMES
1. What is a finite stochastic process? What can you say about
the finite stochastic processes in a Markov chain?
2. Define the following terms for a Markov chain:
a. State
b. Current state
c. Transition probabilities
3. Consider a transition matrix T for a Markov chain with
entries a
ij
, where 1 i n and 1 j n.
a. If there are n states associated with the Markov chain,
what is the size of the matrix T ?
b. Describe the probability that each entry represents. Can
an entry be negative?
c. What is the sum of the entries in each column of T ?
In Exercises 1–10, determine which of the matrices are
stochastic.
1. 2.
3. 4.
5. 6.
7. 8.
9. 10. ≥
.5 .2 .3
.2 .3 .2
.3 .4 .1
0.1.4
¥£
.2 .3
.3 .1
.5 .6
§
£
100
001
010
§£
.1 .4 .3
.7 .2 .1
.2 .4 .6
§
£
1
3
1
4
1
2
1
3
0
1
2
1
4
3
4
1
2
§£
.3 .2 .4
.4 .7 .3
.3 .1 .2
§
£
1
3
0
1
2
1
2
10
1
4
0
1
2
§c
1
4
1
8
3
4
7
8
d
c
.8 .2
.3 .7
dc
.4 .7
.6 .3
d
11. The transition matrix for a Markov process is given by
State
12
T
State
1
State 2
a. What does the entry a
11
.3 represent?
b. Given that the outcome state 1 has occurred, what is the
probability that the next outcome of the experiment will
be state 2?
c. If the initial-state distribution vector is given by
X
0
State 1
State 2
find TX
0
, the probability distribution of the system after
one observation.
12. The transition matrix for a Markov process is given by
State
12
T
State 1
State 2
a. What does the entry a
22
1
3
represent?
b. Given that the outcome state 1 has occurred, what is the
probability that the next outcome of the experiment will
be state 2?
c
1
6
2
3
5
6
1
3
d
c
.4
.6
d
c
.3 .6
.7 .4
d
9.1 Self-Check Exercises
1. Three supermarkets serve a certain section of a city. Dur-
ing the upcoming year, supermarket A is expected to retain
80% of its customers, lose 5% of its customers to super-
market B, and lose 15% to supermarket C. Supermarket B
is expected to retain 90% of its customers and lose 5% of
its customers to each of supermarkets A and C. Supermar-
ket C is expected to retain 75% of its customers, lose 10%
to supermarket A, and lose 15% to supermarket B. Con-
struct the transition matrix for the Markov chain that
describes the change in the market share of the three super-
markets.
2. Refer to Self-Check Exercise 1. Currently the market
shares of supermarket A, supermarket B, and supermarket
C are 0.4, 0.3, and 0.3, respectively.
a. Find the initial distribution vector for this Markov
chain.
b. What share of the market will be held by each super-
market after 1 yr? Assuming that the trend continues,
what will be the market share after 2 yr?
Solutions to Self-Check Exercises 9.1 can be found on
page 493.
9.1 Exercises
9.1 Concept Questions
87533_09_ch9_p483-536 1/30/08 10:12 AM Page 490
c. If the initial-state distribution vector is given by
X
0
State 1
State 2
find TX
0
, the probability distribution of the system after
one observation.
13. The transition matrix for a Markov process is given by
State
12
T
State 1
State 2
and the initial-state distribution vector is given by
X
0
State 1
State 2
Find TX
0
and interpret your result with the aid of a tree dia-
gram.
14. The transition matrix for a Markov process is given by
State
12
T
State 1
State 2
and the initial-state distribution vector is given by
X
0
State 1
State 2
Find TX
0
and interpret your result with the aid of a tree dia-
gram.
In Exercises 15–18, find X
2
(the probability distribution of
the system after two observations) for the distribution
vector X
0
and the transition matrix T.
15. X
0
, T
16. X
0
, T
17. X
0
, T
18. X
0
, T
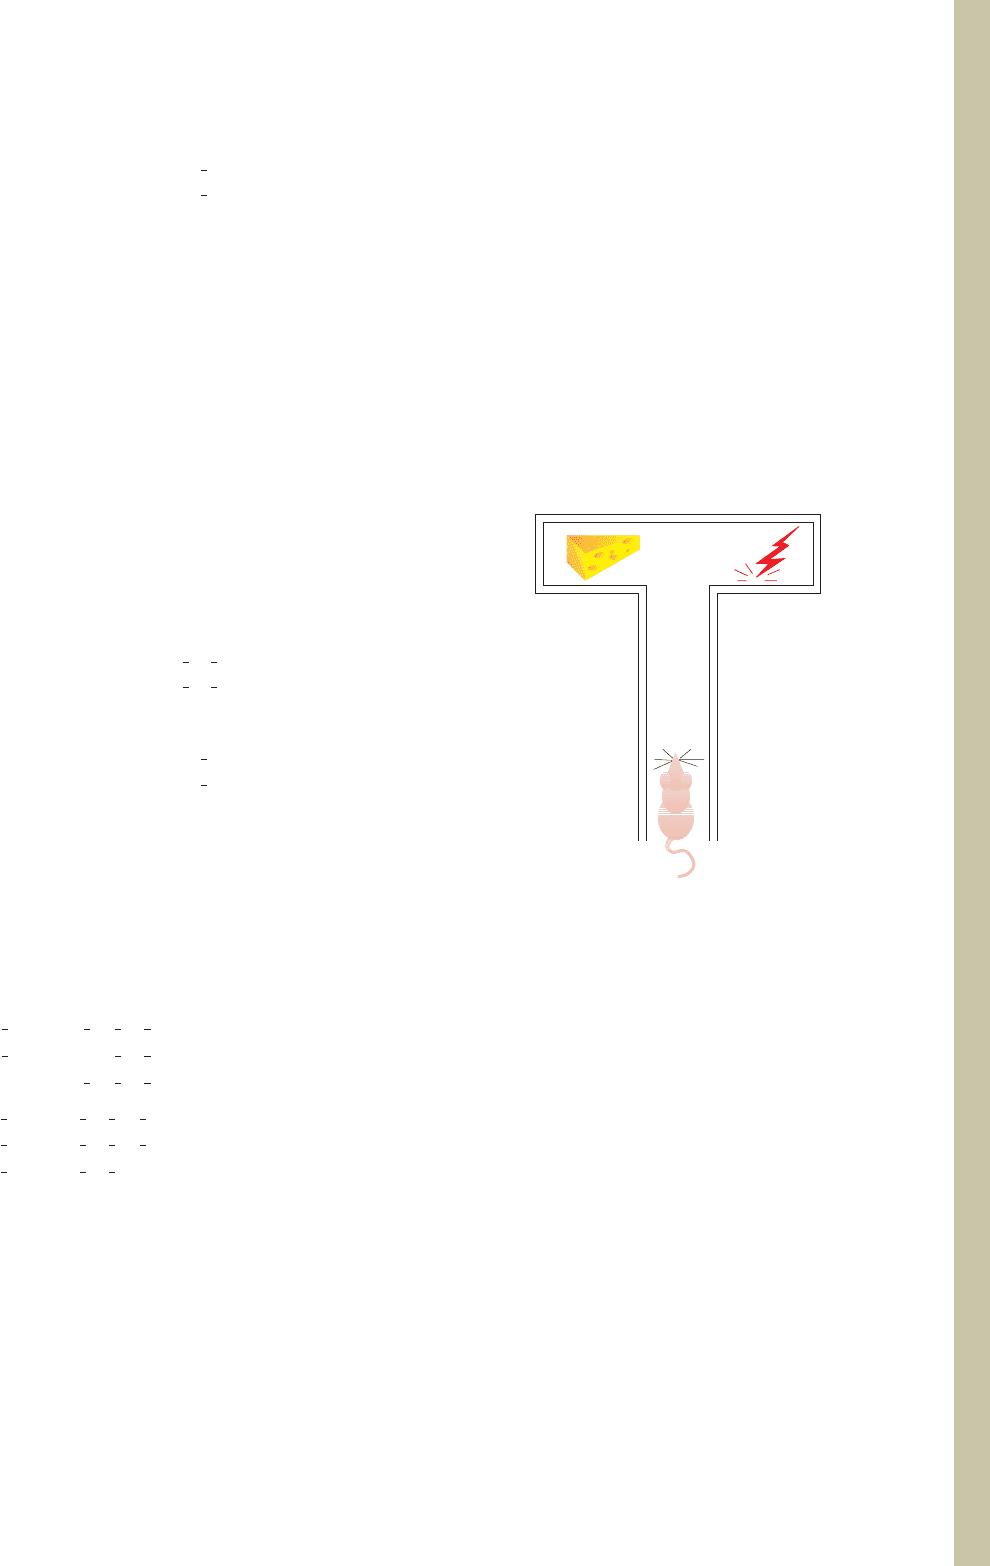
19. P
SYCHOLOGY
E
XPERIMENTS
A psychologist conducts an
experiment in which a mouse is placed in a
T-maze, where
it has a choice at the
T-junction of turning left and receiv-
ing a reward (cheese) or turning right and receiving a mild
electric shock (see accompanying figure). At the end of
each trial, a record is kept of the mouse’s response. It is
observed that the mouse is as likely to turn left (state 1) as
£
.1 .1 .3
.8 .7 .2
.1 .2 .5
§£
.25
.40
.35
§
£
1
4
1
4
1
2
1
4
1
2
1
2
1
2
1
4
0
§£
1
4
1
2
1
4
§
£
1
2
1
3
1
2
0
1
3
1
4
1
2
1
3
1
4
§£
1
2
1
2
0
§
c
.4 .8
.6 .2
dc
.6
.4
d
c
1
3
2
3
d
c
1
2
3
4
1
2
1
4
d
c
.5
.5
d
c
.6 .2
.4 .8
d
c
1
4
3
4
d
right (state 2) during the first trial. In subsequent trials,
however, the observation is made that if the mouse had
turned left in the previous trial, then on the next trial the
probability that it will turn left is .8, whereas the probabil-
ity that it will turn right is .2. If the mouse had turned right
in the previous trial, then the probability that it will turn
right on the next trial is .1, whereas the probability that it
will turn left is .9.
a. Using a tree diagram, describe the transitions between
states and the probabilities associated with these transi-
tions.
b. Represent the transition probabilities obtained in part
(a) in terms of a matrix.
c. What is the initial-state probability vector?
d. Use the results of parts (b) and (c) to find the probabil-
ity that a mouse will turn left on the second trial.
20. S
MALL
-T
OWN
R
EVIVAL
At the beginning of 1998, the popu-
lation of a certain state was 55.4% rural and 44.6% urban.
Based on past trends, it is expected that 10% of the popu-
lation currently residing in the rural areas will move into
the urban areas, while 17% of the population currently
residing in the urban areas will move into the rural areas in
the next decade. What was the population distribution in
that state at the beginning of 2008?
21. P
OLITICAL
P
OLLS
Morris Polling conducted a poll 6 mo
before an election in a state in which a Democrat and a
Republican were running for governor and found that 60%
of the voters intended to vote for the Republican and 40%
intended to vote for the Democrat. In a poll conducted
3 mo later, it was found that 70% of those who had earlier
stated a preference for the Republican candidate still main-
tained that preference, whereas 30% of these voters now
preferred the Democratic candidate. Of those who had ear-
lier stated a preference for the Democrat, 80% still main-
tained that preference, whereas 20% now preferred the
Republican candidate.
a. If the election were held at this time, who would win?
b. Assuming that this trend continues, which candidate is
expected to win the election?
Cheese
Mild shock
L
R
9.1 MARKOV CHAINS 491
87533_09_ch9_p483-536 1/30/08 10:12 AM Page 491