Статистический Ежегодник Население мира 2010
Подождите немного. Документ загружается.


2010
World PoPulation
Data Sheet
I n f o r m | e m p o w e r | a D va n c e | w w w . p r b . o r g
PoPulation RefeRence BuReau
60
The number of mobile phone
subscribers per 100
inhabitants worldwide.
BY
2050,
Japan’s population is projected
to decline to 95 million from 127
million in 2010.
76%
The percentage of people in
urban areas worldwide who
use improved sanitation.
2.5
The total fertility rate worldwide.
TFRs range from 1.7 in more
developed countries to 4.5 in
the least developed countries.
© 2010 Population reference Bureau 2010 WORLD POPULATION DATA SHEET 2
Most PoPulous Countries, 2010 and 2050
2010 2050
Country PoPulation (millions)
India 1,748
China 1,437
United States 423
Pakistan 335
Nigeria 326
Indonesia 309
Bangladesh 222
Brazil 215
Ethiopia 174
Congo, Dem. Rep. 166
Country PoPulation (millions)
China 1,338
India 1,189
United States 310
Indonesia 235
Brazil 193
Pakistan 185
Bangladesh 164
Nigeria 158
Russia 142
Japan 127
Countries With the Youngest and oldest
PoPulations, 2010
younGEst % aGEs <15
Niger 50.1
Uganda 48.7
Burkina Faso 46.4
Congo, Dem. Rep. 46.4
Zambia 46.2
Malawi 45.9
Afghanistan 45.9
Chad 45.6
Somalia 44.9
Tanzania 44.7
PoPulation CloCk, 2010
WorlD
morE DEvEloPED
CountriEs
lEss DEvEloPED
CountriEs
Population 6,892,319,000 1,236,646,000 5,655,673,000
Births per
Year 140,184,169 14,215,211 125,968,959
Day 384,066 38,946 345,120
Minute 267 27 240
Deaths per
Year 56,907,606 12,125,055 44,782,552
Day 155,911 33,219 122,692
Minute 108 23 85
Natural increase
(births-deaths) per
Year 83,276,563 2,090,156 81,186,407
Day 228,155 5,726 222,429
Minute 158 4 154
Infant deaths per
Year 6,383,531 80,133 6,303,398
Day 17,489 220 17,270
Minute 12 0.2 12
olDEst % aGEs 65+
Japan 22.6
Germany 20.5
Italy 20.4
Sweden 18.3
Greece 18.3
Portugal 17.9
Bulgaria 17.6
Austria 17.6
Latvia 17.4
Belgium 17.4
© 2010 Population reference Bureau 2010 WORLD POPULATION DATA SHEET 3
W o r l d P o P u l a t i o n h i g h l i g h t s
F O C U S O N A G I N G
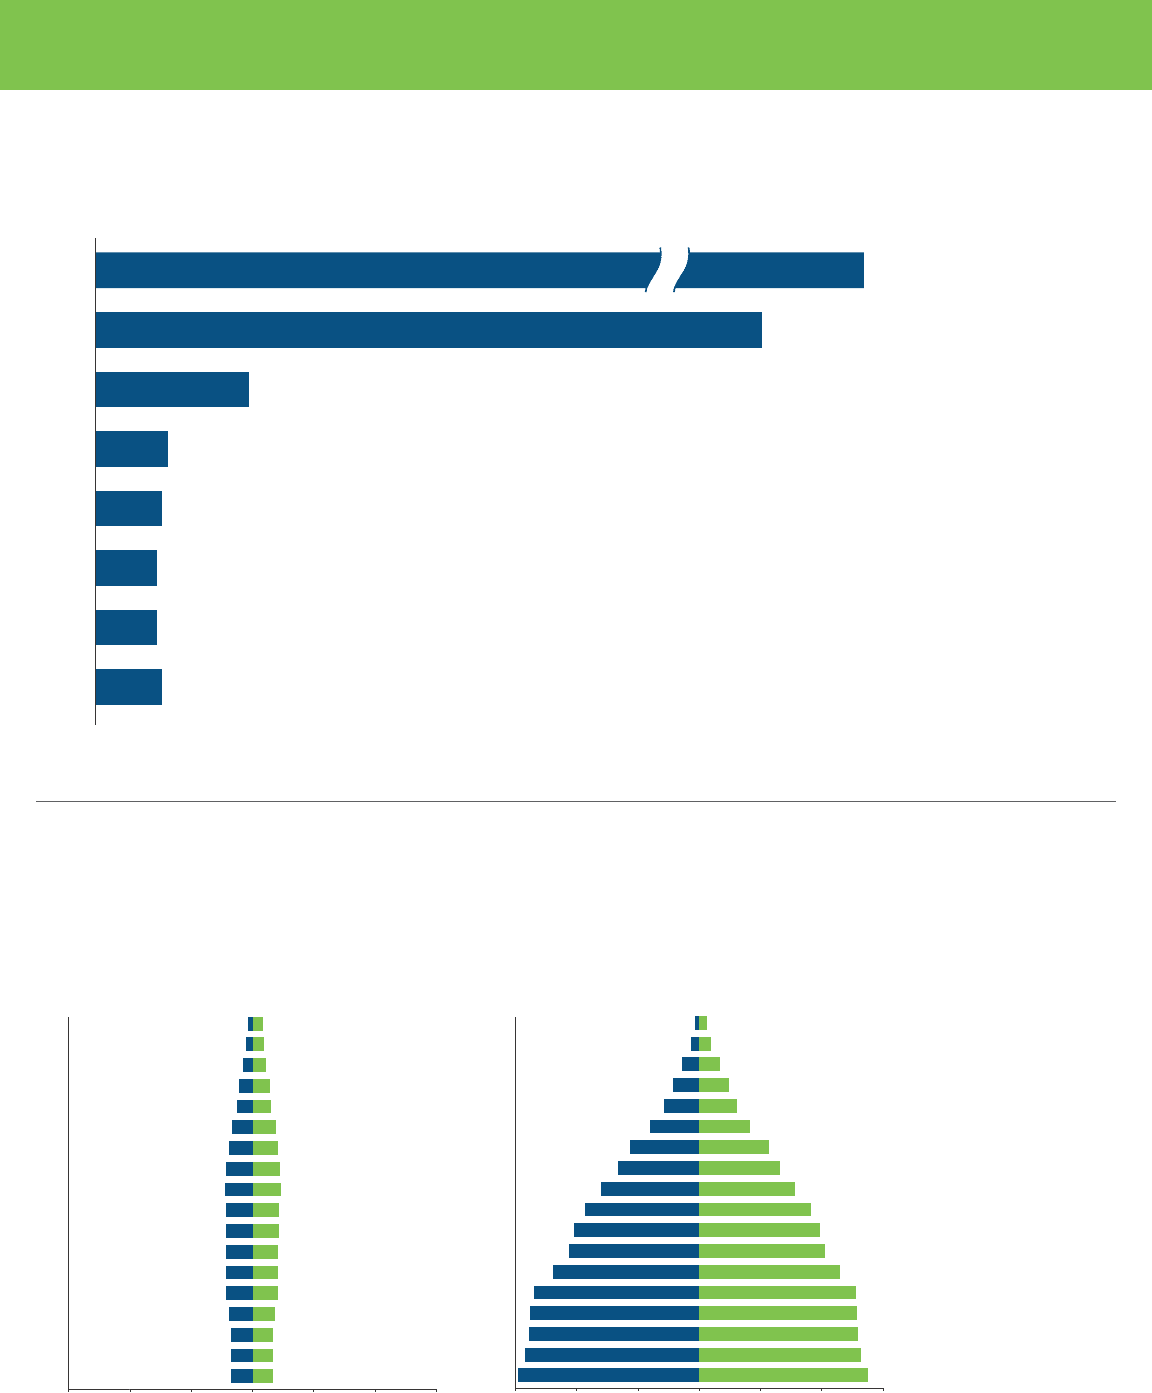
Today, Global Population Adds Another Billion at Record Rates.
at some point around 1800, after untold millennia of human history, global population reached its first billion. the world’s population now
grows by 1 billion about every 12 years. the 20th century began with 1.6 billion and, at the end of that century, those two numbers had
simply reversed to 6.1 billion. if birth rates continue to decline in developing countries, the increase to 8 billion could take slightly longer.
First
Billion
130 Years (1930)
ca. 1800
All of Human History
30 Years (1960)
14 Years (1974)
13 Years (1987)
12 Years (1999)
12 Years (2011)
13 Years (2024)
Second
Third
Fourth
Fifth
Sixth
Seventh
Eighth
So u r c e : Population Reference Bureau estimates and projections; and un Population Division, World Population Prospects: The 2008 Revision (2009).
As Developed Countries Undergo Aging and Little Growth in
Population Size, Developing Countries Remain Young and Growing.
the population “pyramid” of the developed countries clearly shows the decline in the number of young people as a result of low birth rates.
the two pyramids provide a comparable picture of the developed and developing countries in the size of their respective populations and
So u r c e : un Population Division, World Population Prospects: The 2008 Revision (2009).
85+
Age
80-84
75-79
70-74
65-69
60-64
55-59
50-54
45-49
40-44
35-39
30-34
25-29
20-24
15-19
10-14
5-9
0-4
200 200100 1000
Population (millions), 2010
FemalesMales
300 300
85+
Age
80-84
75-79
70-74
65-69
60-64
55-59
50-54
45-49
40-44
35-39
30-34
25-29
20-24
15-19
10-14
5-9
0-4
200 200100 1000
Population (millions), 2010
FemalesMales
300 300
DEV ELO PE D COUNTRIES DEV ELO PI NG COUNTRIES
age structure. in some
developed countries, the
size of the youngest age
group is barely more than
half that of their parents’
age group. When the two
population pyramids are
compared, it is obvious
that virtually all future
world population growth
will take place in the
developing countries. But
the amount of growth
these countries will expe-
rience depends upon the
degree to which couples
in those countries
choose to reduce family
size and have access to
family planning services.
© 2010 Population Reference Bureau 2010 WORLD POPULATION DATA SHEET 4
W O R L D P O P U L A T I O N H I G H L I G H T S
F O C U S O N A G I N G
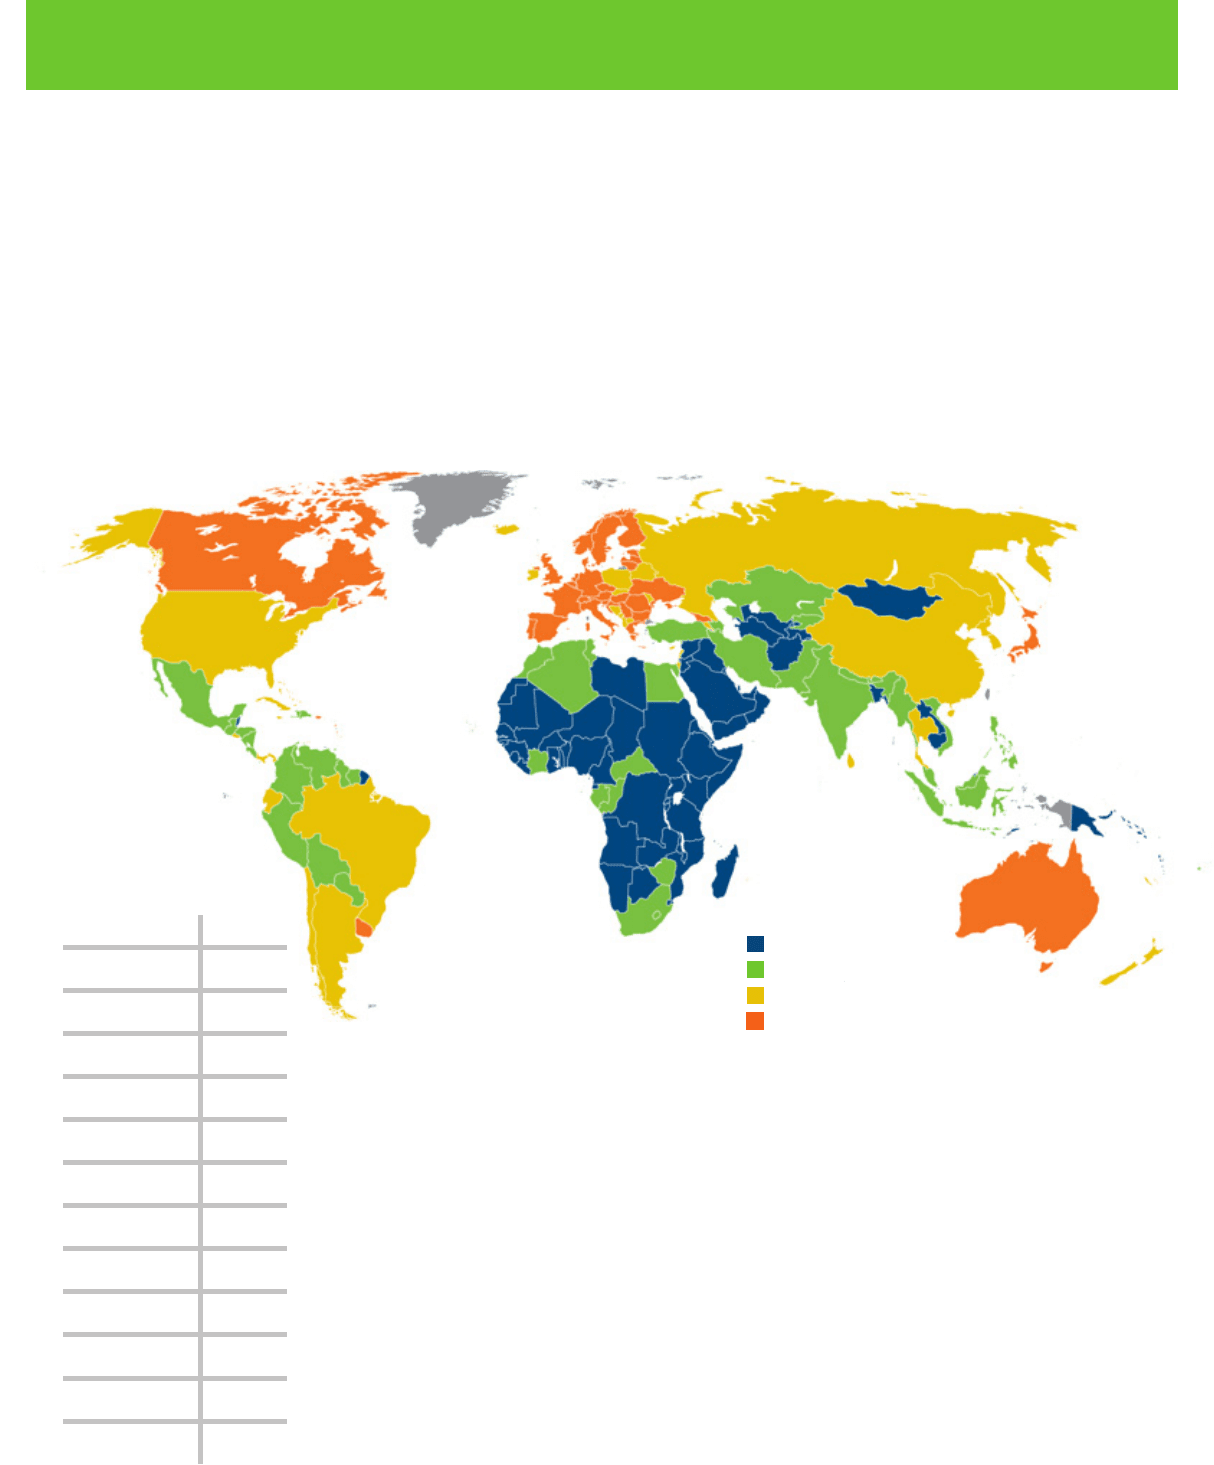
The Number of Working-Age Adults Available to Support an
Older Person Is Declining Globally but Still Varies Substantially
From Country to Country.
Population aging puts pressure on a society’s ability to support its elderly citizens. A commonly used indicator of this pressure is the elderly
support ratio, calculated as the number of working-age people ages 15 to 64 divided by the number of persons 65 or older. This ratio
serves as a rough indicator of the number of potential providers of support per potential elderly dependent. In 1950, there were 12 working-
age people for every elderly person in the world. By 2010, this ratio had declined to 9, with the largest decline occurring in more developed
countries. But the ratios still vary substantially across countries. In 24 countries, mostly in Europe, there are fewer than 5 working-age
people for every elderly person. The ratio is lowest in Japan, Italy, and Germany—at 3. The ratio is above 25 in seven countries, principally
in sub-Saharan Africa and the Middle East. By 2050, the ratio for the world is projected to decline by more than one-half—to 4, and Japan
will have the lowest ratio of only 1 working-age adult per elderly person. The elderly support ratio will be below 5 in more than half of the
world’s countries. By 2050, no country will have a ratio above 20.
15 and over
10 to 14.9
5 to 9.9
Less than 5
Elderly Support Ratio (2010)
Elderly Support Ratio (2050)
Country ratio
Niger 19
Uganda 16
Guatemala 7
Pakistan 7
Egypt 5
India 5
Morocco 4
United States 3
Mexico 3
China 3
France 2
Japan 1
So u r c e : UN Population Division,
World Population Prospects:
The 2008 Revision (2009).
© 2010 Population reference Bureau 2010 WORLD POPULATION DATA SHEET 5
W o r l d P o P u l a t i o n h i g h l i g h t s
F O C U S O N A G I N G
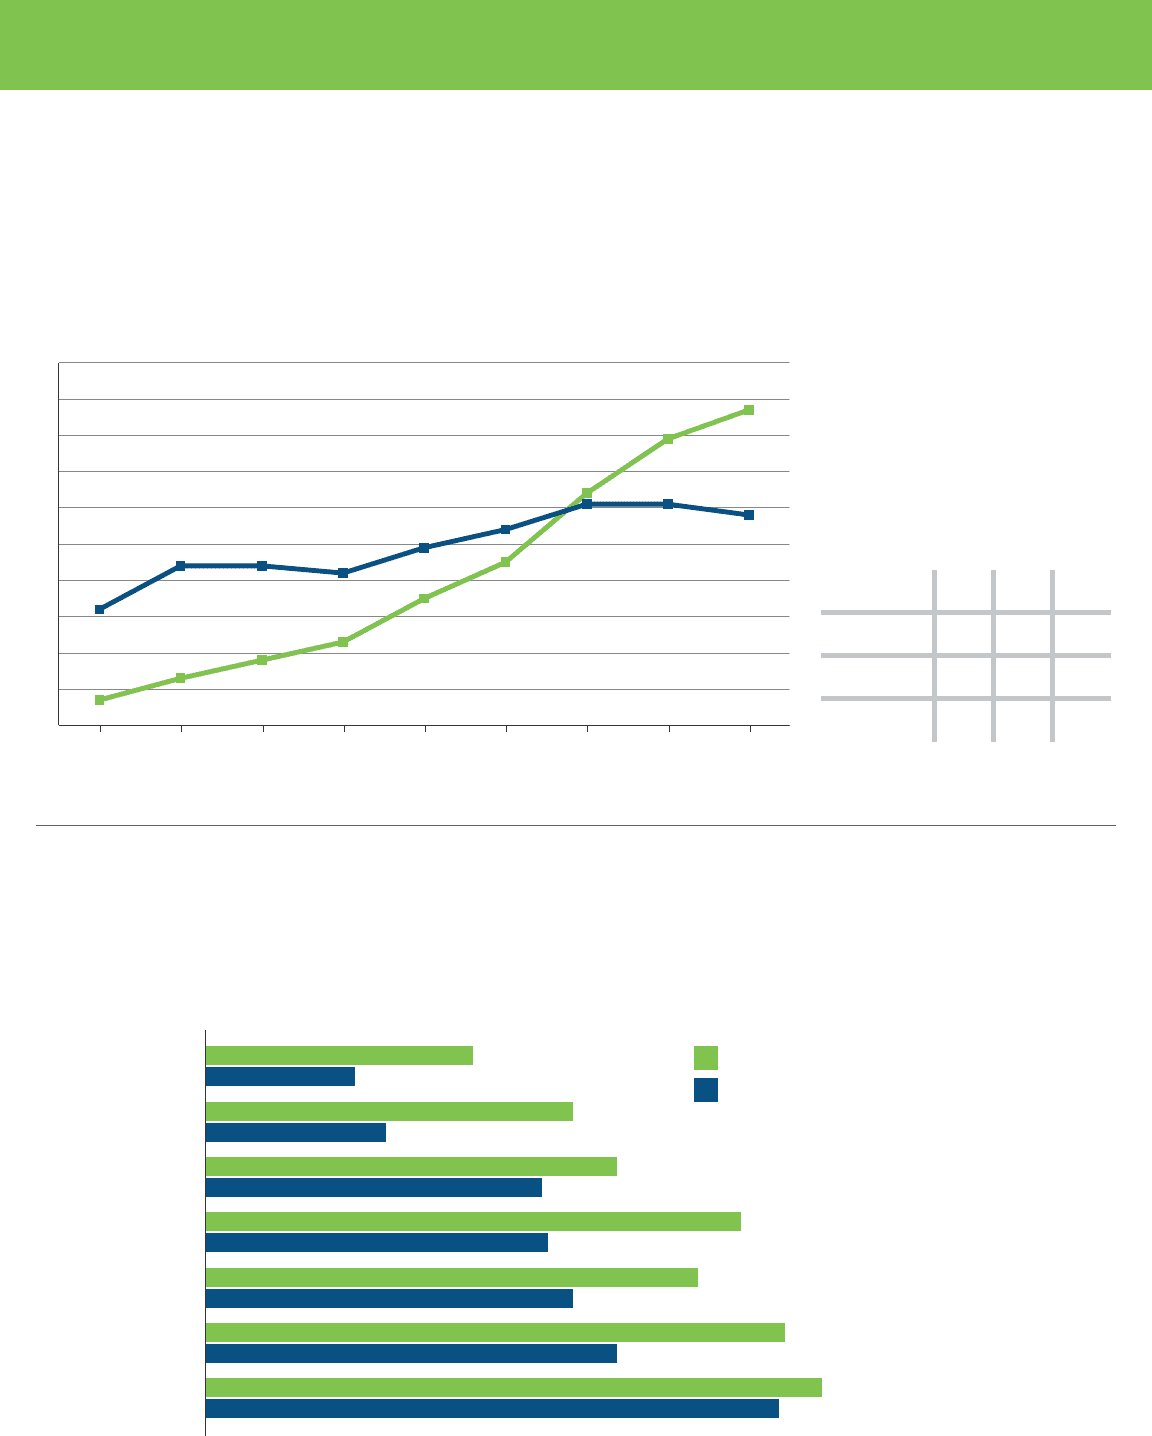
the number of people age 65 or older in the united States will more than double from 40 million in 2010 to 89 million by 2050. Spending
on Social Security and Medicare is projected to increase dramatically between now and 2050 as the number of people receiving benefits
grows. the magnitude of this increased spending is illustrated by comparing the projected costs of these two programs with Gross
Domestic Product (GDP), which measures the total output of the u.S. economy. in 1970, spending on Social Security and Medicare
totaled only about 4 percent of GDP, while by 2010 this share had risen to more than 8 percent of GDP. By 2030, Medicare expenditures
0
1
2
3
4
5
6
7
8
9
10
1970 1980
Social Security
Medicare
3.2%
8.7%
5.8%
0.7%
1990 2000 2010 2020 2030 2040 2050
Expenditures as a Percentage of GDP
Spending as a Percentage of GDP
2010 2030 2050
Social Security 4.9 6.1 5.8
Medicare 3.5 6.4 8.7
Total 8.4%
12.5%
14.5%
As the U.S. Population Ages, Spending on Entitlement Programs
Such as Social Security and Medicare Will Rise Sharply.
So u r c e : u.S. Social Security administration, A Summary of the 2009 Annual Social Security and Medicare Trust Fund Reports (2009).
Worldwide, 40 percent of the population, or more than 2.6 billion people, lack one of life’s basic needs: an adequate sanitation facility,
defined as one that hygienically separates sewage from human contact. there are wide regional and rural-urban disparities, and the
Sub-Saharan Africa
43
24
59
29
66
54
86
55
79
59
93
66
99
92
Percent of Population Who Use Improved Sanitation (2008)
South Central Asia
East Asia
Latin America/Caribbean
Southeast Asia
Western Asia
More Developed
Countries
Urban
Rural
In Many Parts of the World, Rural Populations Still Lack
Adequate Sanitation.
So u r c e : Regional estimates calculated by PRB based on data from the WHo/unicef Joint Monitoring Programme for Water Supply and Sanitation.
are projected to exceed those
for Social Security; by 2050, total
spending on these two programs is
projected to reach almost 15 percent
of GDP. the rapid growth in Medicare
spending will be fueled by the rising
cost and use of health care services,
in addition to the increase in the
number of people receiving benefits.
bulk of the underserved live
in rural areas of developing
countries. Much of the world
is making little progress
toward meeting the Millennium
Development Goal target to
halve the proportion of the
world’s population without
access to basic sanitation
by 2015. at the current
pace, the world will miss the
MDG target for improved
sanitation by 13 percentage
points: approximately 1 billion
people who are targeted for
improvement will still lack
access.
© 2010 Population reference Bureau 2010 WORLD POPULATION DATA SHEET 6
WORLD
6,892 20 8 1.2 — 8,108 9,485 1.4 46 2.5 27 8
MORE DEVELOPED
1,237 11 10 0.2 2 1,290 1,326 1.1 6 1.7 17 16
LESS DEVELOPED
5,656 22 8 1.4 -1 6,819 8,159 1.4 50 2.7 30 6
LESS DEVELOPED (Excl. China)
4,318 25 8 1.7 -1 5,343 6,722 1.6 54 3.1 33 5
LEAST DEVELOPED
857 35 12 2.3 -0 1,172 1,710 2.0 81 4.5 41 3
AFRICA
1,030 37 13 2.4 -1 1,412 2,084 2.0 76 4.7 41 3
SUB-Saharan afrIca
865 39 14 2.5 -0 1,207 1,831 2.1 81 5.2 43 3
northern afrIca
209 26 7 1.9 -0 262 329 1.6 42 3.0 33 4
algeria
36.0 23 5 1.8 -1 43.6 50.4 1.4 28 2.3 28 5
egypt
80.4 27 6 2.1 -0 103.6 137.7 1.7 28 3.0 33 4
libya
6.5 23 4 1.9 1 8.1 9.8 1.5 18 2.7 30 4
Morocco
31.9 21 6 1.5 -3 36.6 41.2 1.3 31 2.4 29 5
sudan
43.2 33 11 2.2 1 56.7 75.9 1.8 81 4.5 41 3
tunisia
10.5 18 6 1.2 -0 12.1 13.2 1.2 18 2.1 24 7
Western sahara
d
0.5 34 9 2.5 9 0.7 1.2 2.4 63 4.5 40 3
weStern afrIca
309 41 15 2.6 -1 435 682 2.2 81 5.5 43 3
Benin
9.8 40 10 3.0 0 13.6 22.1 2.3 89 5.6 45 3
Burkina Faso
16.2 46 12 3.4 0 25.4 47.4 2.9 81 6.0 46 3
Cape Verde
0.5 25 6 2.0 -3 0.7 0.8 1.6 25 2.9 35 5
Côte d'ivoire
22.0 37 14 2.4 -1 30.8 47.2 2.1 97 4.9 40 2
gambia
1.8 38 12 2.7 3 2.5 3.8 2.1 81 5.3 43 3
ghana
24.0 31 9 2.2 -1 31.8 44.6 1.9 50 4.0 39 4
guinea
10.8 41 11 3.0 0 15.9 25.1 2.3 91 5.7 43 3
guinea-Bissau
1.6 43 18 2.4 0 2.3 3.6 2.2 121 5.8 43 3
liberia
4.1 43 11 3.3 1 6.1 10.0 2.4 95 5.9 44 3
Mali
15.2 46 15 3.1 -6 22.3 35.6 2.3 116 6.6 48 3
Mauritania
3.4 34 11 2.3 1 4.4 6.1 1.8 73 4.5 40 3
niger
15.9 52 17 3.5 -6 27.4 58.2 3.7 108 7.4 49 2
nigeria
158.3 42 17 2.4 -0 217.4 326.4 2.1 75 5.7 43 3
senegal
12.5 39 11 2.8 -2 17.4 25.4 2.0 58 4.9 44 2
sierra leone
5.8 40 16 2.4 2 8.1 12.4 2.1 89 5.1 43 2
togo
6.8 33 8 2.5 -0 9.3 13.2 1.9 81 4.8 41 3
eaStern afrIca
326 40 13 2.7 -0 465 709 2.2 72 5.3 44 3
Burundi
8.5 36 15 2.1 8 11.6 16.8 2.0 98 5.4 41 3
Comoros
0.7 33 7 2.6 -3 0.9 1.2 1.8 53 4.1 38 3
djibouti
0.9 29 11 1.8 0 1.1 1.5 1.7 67 4.0 37 3
eritrea
5.2 37 9 2.9 2 7.4 10.8 2.1 54 4.7 42 2
ethiopia
85.0 39 12 2.7 -1 119.8 173.8 2.0 77 5.4 44 3
Kenya
40.0 37 10 2.7 0 51.3 65.2 1.6 52 4.6 42 3
Madagascar
20.1 37 9 2.7 -0 28.6 42.7 2.1 48 4.8 43 3
Malawi
15.4 44 15 2.9 0 22.9 37.4 2.4 80 6.0 46 3
Mauritius
1.3 12 7 0.5 -0 1.4 1.4 1.1 13.4 1.5 22 7
Mayotte
0.2 39 3 3.6 4 0.3 0.5 2.6 — 4.5 44 2
Mozambique
23.4 40 16 2.3 -0 31.2 44.1 1.9 90 5.1 44 3
reunion
0.8 18 5 1.3 -0 1.0 1.1 1.3 8 2.4 26 8
rwanda
10.4 42 14 2.9 0 15.8 28.3 2.7 102 5.4 42 2
seychelles
0.1 18 7 1.0 0 0.1 0.1 1.4 11.5 2.3 22 10
somalia
9.4 46 16 3.0 -6 13.9 23.5 2.5 111 6.5 45 3
tanzania
45.0 42 12 3.0 -1 67.4 109.5 2.4 58 5.6 45 3
uganda
33.8 47 13 3.4 -1 53.4 91.3 2.7 76 6.5 49 3
Zambia
13.3 45 20 2.5 -1 20.3 37.6 2.8 70 6.2 46 3
Zimbabwe
12.6 30 17 1.3 0 16.8 22.2 1.8 60 3.7 42 4
mIDDLe afrIca
129 44 16 2.7 -0 188 296 2.3 111 5.9 46 3
angola
19.0 42 17 2.5 1 27.4 42.3 2.2 118 5.8 45 2
Cameroon
20.0 37 14 2.3 -0 26.5 36.7 1.8 87 4.7 41 4
Central african republic
4.8 38 16 2.2 0 6.6 10.3 2.1 106 4.8 41 4
Chad
11.5 46 17 2.9 -1 16.9 27.8 2.4 130 6.2 46 3
Congo
3.9 38 13 2.5 -3 5.5 8.2 2.1 79 5.0 42 4
Congo, dem. rep.
67.8 47 17 2.9 -1 101.4 166.2 2.5 114 6.4 48 3
equatorial guinea
0.7 39 16 2.3 4 1.0 1.4 2.1 103 5.5 42 3
gabon
1.5 29 10 1.9 1 2.0 2.8 1.9 55 3.6 39 4
sao tome and Principe
0.2 37 7 2.9 -7 0.2 0.3 2.1 45 4.9 44 4
Population
mid-2010
(millions)
Births per
1,000
Population
Deaths per
1,000
Population
Rate of
Natural
Increase
(%)
Net
Migration
Rate
per 1,000
Population mid–2025 mid–2050
2050
Population
as a
Multiple
of 2010
Infant
Mortality
Rate
a
Total
Fertility
Rate
b
<15 65+
Projected
Population
(millions)
Percent of
Population
Ages
POPULATION, HEALTH, AND ENVIRONMENT DATA AND ESTIMATES
FOR THE COUNTRIES AND REGIONS OF THE WORLD
See notes on page 17.
© 2010 Population reference Bureau 2010 WORLD POPULATION DATA SHEET 7
Population
mid-2010
(millions)
Births per
1,000
Population
Deaths per
1,000
Population
Rate of
Natural
Increase
(%)
Net
Migration
Rate
per 1,000
Population mid–2025 mid–2050
2050
Population
as a
Multiple
of 2010
Infant
Mortality
Rate
a
Total
Fertility
Rate
b
<15 65+
Projected
Population
(millions)
Percent of
Population
Ages
POPULATION, HEALTH, AND ENVIRONMENT DATA AND ESTIMATES
FOR THE COUNTRIES AND REGIONS OF THE WORLD
SoUthern afrIca
57 22 13 1.0 1 63 68 1.2 48 2.5 32 5
Botswana
1.8 30 11 1.9 0 2.2 3.0 1.6 48 3.2 33 5
lesotho
1.9 28 19 0.9 -9 2.0 1.9 1.0 94 3.2 34 6
namibia
2.2 28 9 1.9 -0 2.8 3.6 1.6 35 3.4 38 4
south africa
49.9 21 12 0.9 2 54.4 57.4 1.2 46 2.4 31 5
swaziland
1.2 31 16 1.5 -1 1.5 1.7 1.5 74 3.7 40 3
AMERICAS
929 17 7 1.0 0 1,059 1,200 1.3 17 2.2 25 9
NORTHERN AMERICA
344 13 8 0.6 3 391 471 1.4 6 2.0 20 13
Canada
34.1 11 7 0.4 8 39.7 48.4 1.4 5.1 1.7 17 14
united states
309.6 14 8 0.6 3 351.4 422.6 1.4 6.4 2.0 20 13
LATIN AMERICA/CARIBBEAN
585 19 6 1.3 -2 668 729 1.2 22 2.3 29 7
centraL amerIca
153 21 5 1.6 -4 178 198 1.3 20 2.5 31 6
Belize
0.3 27 4 2.3 -1 0.4 0.6 1.6 18 3.1 37 5
Costa rica
4.6 17 4 1.3 1 5.3 6.1 1.3 9.0 1.9 23 7
el salvador
6.2 20 7 1.4 -9 6.9 7.9 1.3 22 2.4 33 7
guatemala
14.4 34 6 2.8 -2 20.0 27.9 1.9 34 4.4 42 4
honduras
7.6 28 5 2.3 -3 9.8 12.4 1.6 23 3.3 38 4
Mexico
110.6 19 5 1.4 -5 123.4 129.0 1.2 17 2.2 29 6
nicaragua
6.0 23 4 1.8 -1 7.5 9.5 1.6 24 2.5 35 3
Panama
3.5 20 5 1.6 1 4.3 5.0 1.4 13 2.5 30 6
carIBBean
42 19 8 1.1 -2 46 49 1.2 30 2.4 27 8
antigua and Barbuda
0.1 14 6 0.9 10 0.1 0.1 1.4 16 1.9 28 7
Bahamas
0.3 15 6 0.9 3 0.4 0.5 1.4 14 1.9 26 6
Barbados
0.3 13 8 0.5 -1 0.3 0.3 1.0 9 1.7 19 9
Cuba
11.2 11 8 0.3 -3 11.1 9.7 0.9 4.7 1.6 18 12
dominica
0.1 15 8 0.7 -4 0.1 0.1 0.9 12 2.0 23 10
dominican republic
9.9 23 6 1.7 -3 11.6 13.2 1.3 30 2.7 32 6
grenada
0.1 17 9 0.8 -4 0.1 0.1 1.0 20 2.2 31 10
guadeloupe
0.4 14 7 0.7 -3 0.5 0.5 1.2 7 2.0 22 13
haiti
9.8 28 9 1.8 -2 12.2 15.7 1.6 49 3.5 37 4
Jamaica
2.7 20 7 1.2 -7 2.9 2.7 1.0 26 2.4 28 8
Martinique
0.4 13 7 0.6 -1 0.4 0.4 1.0 8 1.9 20 14
netherlands antilles
0.2 14 7 0.7 7 0.2 0.2 0.9 11 2.1 22 10
Puerto rico
4.0 12 7 0.4 -1 4.1 3.7 0.9 8.8 1.6 20 14
st. Kitts-nevis
0.1 14 7 0.7 1 0.1 0.1 1.1 11 1.8 24 7
saint lucia
0.2 14 7 0.7 6 0.2 0.2 1.2 20.0 1.7 25 9
st. Vincent & the grenadines
0.1 17 8 0.9 -1 0.1 0.1 1.1 17.6 2.1 28 7
trinidad and tobago
1.3 14 8 0.6 -2 1.4 1.3 1.0 26 1.6 25 7
SoUth amerIca
391 18 6 1.2 -1 444 481 1.2 22 2.2 28 7
argentina
40.5 18 8 1.0 0 46.2 52.4 1.3 13.3 2.3 26 10
Bolivia
10.4 27 7 2.0 -1 13.3 16.0 1.5 45 3.5 37 4
Brazil
193.3 17 6 1.0 -0 212.4 215.3 1.1 24 2.0 27 7
Chile
17.1 15 6 0.9 1 19.1 20.2 1.2 8.3 1.9 24 8
Colombia
45.5 20 6 1.4 -2 53.5 61.3 1.3 20 2.4 30 7
ecuador
14.2 21 5 1.6 -5 16.6 18.6 1.3 21 2.6 31 6
French guiana
0.2 28 3 2.4 12 0.3 0.5 2.0 13.6 3.6 35 4
guyana
0.8 23 7 1.6 -16 0.8 0.9 1.2 38 2.8 33 5
Paraguay
6.5 25 6 1.9 -1 8.1 10.1 1.6 32 3.1 34 5
Peru
29.5 21 6 1.6 -4 34.5 39.8 1.4 20 2.6 31 6
suriname
0.5 19 7 1.3 -2 0.6 0.6 1.2 22 2.4 30 7
uruguay
3.4 14 9 0.5 -1 3.5 3.6 1.1 10.6 2.0 23 14
Venezuela
28.8 21 5 1.6
-1
35.1 41.7 1.4 15.8 2.6 30 6
ASIA
4,157 19 7 1.2
-0
4,845 5,424 1.3 41 2.2 26 7
aSIa (excl. china)
2,819 22 7 1.5 -0 3,369 3,987 1.4 46 2.6 30 6
weStern aSIa
235 24 5 1.9 -1 295 379 1.6 37 3.1 32 5
armenia
3.1 15 10 0.6 -1 3.3 3.3 1.1 25 1.7 20 10
azerbaijan
9.0 17 6 1.1 0 10.3 10.7 1.2 11 2.2 23 7
Bahrain
1.3 15 2 1.3 42 1.6 2.0 1.6 8 1.9 20 2
Cyprus
1.1 13 7 0.6 7 1.1 1.1 1.0 7 1.5 18 10
georgia
4.6 13 10 0.3 -2 4.3 3.6 0.8 17 1.7 17 14
iraq
31.5 32 6 2.6 -4 44.7 64.0 2.0 84 4.1 41 3
See notes on page 17.
© 2010 Population reference Bureau 2010 WORLD POPULATION DATA SHEET 8
Population
mid-2010
(millions)
Births per
1,000
Population
Deaths per
1,000
Population
Rate of
Natural
Increase
(%)
Net
Migration
Rate
per 1,000
Population mid–2025 mid–2050
2050
Population
as a
Multiple
of 2010
Infant
Mortality
Rate
a
Total
Fertility
Rate
b
<15 65+
Projected
Population
(millions)
Percent of
Population
Ages
POPULATION, HEALTH, AND ENVIRONMENT DATA AND ESTIMATES
FOR THE COUNTRIES AND REGIONS OF THE WORLD
israel
7.6 22 5 1.6 2 9.4 11.4 1.5 3.7 3.0 28 10
Jordan
6.5 31 4 2.6 2 8.5 11.8 1.8 23 3.8 37 3
Kuwait
3.1 22 2 2.0 8 4.1 5.4 1.7 9 2.2 23 2
lebanon
4.3 20 5 1.5 -1 4.7 5.0 1.2 19 2.3 25 10
oman
3.1 20 3 1.8 26 4.2 5.7 1.8 9 2.6 29 2
Palestinian territory
4.0 33 4 2.8 -1 6.0 9.4 2.3 25 4.6 44 3
Qatar
1.7 9 1 0.8 4 2.1 2.6 1.5 8 1.8 15 1
saudi arabia
29.2 28 2 2.6 -8 35.7 49.8 1.7 18 3.8 38 2
syria
22.5 28 3 2.5 -1 28.6 36.9 1.6 16 3.3 36 3
turkey
73.6 18 6 1.2 -0 85.0 94.7 1.3 28 2.1 26 7
united arab emirates
5.4 15 2 1.4 16 7.0 9.4 1.8 7 2.0 19 1
Yemen
23.6 38 8 3.0 -1 34.5 52.2 2.2 59 5.5 45 3
SoUth centraL aSIa
1,755 24 7 1.6 -1 2,148 2,620 1.5 55 2.8 32 5
afghanistan
29.1 39 18 2.1 6 39.4 53.4 1.8 155 5.7 44 2
Bangladesh
164.4 22 7 1.5 -1 195.0 222.5 1.4 45 2.4 32 4
Bhutan
0.7 25 8 1.7 3 0.9 1.0 1.4 40 3.1 31 5
india
1,188.8 23 7 1.5 -0 1,444.5 1,748.0 1.5 53 2.6 32 5
iran
75.1 19 6 1.3 -1 87.1 97.0 1.3 29 1.8 28 5
Kazakhstan
16.3 23 9 1.4 1 18.4 21.5 1.3 26 2.7 24 8
Kyrgyzstan
5.3 24 7 1.6 -3 6.5 8.0 1.5 31 2.8 29 5
Maldives
0.3 22 3 1.9 0 0.4 0.5 1.5 12 2.5 30 5
nepal
28.0 28 8 1.9 -1 35.7 46.1 1.6 48 3.0 37 4
Pakistan
184.8 30 7 2.3 -2 246.3 335.2 1.8 64 4.0 38 4
sri lanka
20.7 19 7 1.2 -2 23.2 25.4 1.2 15 2.4 26 6
tajikistan
7.6 28 4 2.4 -2 9.8 12.0 1.6 60 3.4 38 4
turkmenistan
5.2 22 8 1.4 -1 6.1 6.8 1.3 51 2.5 31 4
uzbekistan
28.1 23 5 1.8 -1 34.4 42.4 1.5 48 2.8 33 5
SoUtheaSt aSIa
597 20 7 1.3 -0 699 793 1.3 27 2.4 28 6
Brunei
0.4 16 3 1.3 2 0.5 0.6 1.6 7 1.7 27 3
Cambodia
15.1 25 8 1.6 -0 19.0 23.8 1.6 62 3.3 35 3
indonesia
235.5 20 6 1.4 -1 273.2 309.4 1.3 30 2.4 28 6
laos
6.4 28 7 2.1 -2 8.3 10.7 1.7 60 3.5 39 4
Malaysia
28.9 21 5 1.6 1 34.9 41.0 1.4 9 2.6 32 5
Myanmar
53.4 20 11 0.9 -0 61.7 70.8 1.3 56 2.4 27 3
Philippines
94.0 26 5 2.1 -3 117.6 140.5 1.5 23 3.2 33 4
singapore
5.1 10 4 0.6 25 5.7 5.5 1.1 2.2 1.2 18 9
thailand
68.1 15 9 0.6 1 72.6 73.4 1.1 7 1.8 22 7
timor-leste
1.2 41 10 3.1 2 1.9 3.2 2.8 44 5.7 45 3
Vietnam
88.9 17 5 1.2 0 103.2 113.7 1.3 15 2.1 25 8
eaSt aSIa
1,571 12 7 0.5 -0 1,704 1,632 1.0 20 1.5 18 10
China
1,338.1 12 7 0.5 -0 1,476.0 1,437.0 1.1 21 1.5 18 8
China, hong Kong sar
e
7.0 12 6 0.6 -1 8.0 8.8 1.3 1.7 1.0 12 13
China, Macao sar
e
0.5 9 3 0.6 -19 0.7 0.7 1.4 3 1.0 13 8
Japan
127.4 9 9 -0.0 -1 119.3 95.2 0.7 2.6 1.4 13 23
Korea, north
22.8 15 10 0.5 0 23.6 22.9 1.0 53 2.0 22 9
Korea, south
48.9 9 5 0.4 1 49.1 42.3 0.9 3.4 1.2 17 11
Mongolia
2.8 25 6 1.9 0 3.3 4.0 1.5 41 2.7 33 4
taiwan
23.2 8 6 0.2 2 23.9 21.5 0.9 4.5 1.0 16 11
EUROPE
739 11 11 0.0 2 747 720 1.0 6 1.6 16 16
eUropean UnIon
501 11 10 0.1 2 514 510 1.0 4 1.6 16 17
northern eUrope
99 13 9 0.3 3 109 119 1.2 4 1.9 18 16
Channel islands
0.2 10 8 0.2 7 0.2 0.2 1.0 3.6 1.6 16 15
denmark
5.5 11 10 0.1 4 5.8 5.9 1.1 3.1 1.8 19 17
estonia
1.3 12 12 -0.0 -0 1.3 1.2 0.9 3.6 1.6 15 17
Finland
5.4 11 9 0.2 3 5.8 6.1 1.1 2.6 1.9 17 17
iceland
0.3 15 6 0.9 -15 0.4 0.4 1.3 2.5 2.1 21 12
ireland
4.5 17 6 1.0 -2 5.7 6.4 1.4 3.5 2.1 21 11
latvia
2.2 10 13 -0.4 -2 2.1 1.8 0.8 6.7 1.3 14 17
lithuania
3.3 11 12 -0.1 -5 3.1 2.7 0.8 4.9 1.5 15 16
norway
4.9 13 9 0.4 8 5.6 6.5 1.3 3.1 2.0 19 15
sweden
9.4 12 10 0.2 7 10.2 10.7 1.1 2.2 1.9 17 18
united Kingdom
62.2 13 9 0.4 2 68.6 77.0 1.2 4.7 1.9 18 16
See notes on page 17.
© 2010 Population reference Bureau 2010 WORLD POPULATION DATA SHEET 9
Population
mid-2010
(millions)
Births per
1,000
Population
Deaths per
1,000
Population
Rate of
Natural
Increase
(%)
Net
Migration
Rate
per 1,000
Population mid–2025 mid–2050
2050
Population
as a
Multiple
of 2010
Infant
Mortality
Rate
a
Total
Fertility
Rate
b
<15 65+
Projected
Population
(millions)
Percent of
Population
Ages
POPULATION, HEALTH, AND ENVIRONMENT DATA AND ESTIMATES
FOR THE COUNTRIES AND REGIONS OF THE WORLD
weStern eUrope
189 10 9 0.1 1 193 190 1.0 4 1.6 16 18
austria
8.4 9 9 -0.0 3 8.9 9.5 1.1 3.7 1.4 15 17
Belgium
10.8 11 9 0.2 4 11.8 12.5 1.2 3.1 1.7 17 17
France
63.0 13 9 0.4 1 66.1 70.0 1.1 3.6 2.0 18 17
germany
81.6 8 10 -0.2 -1 79.7 71.5 0.9 3.5 1.3 14 20
liechtenstein
0.04 10 6 0.4 5 0.04 0.04 1.2 3.4 1.4 16 13
luxembourg
0.5 11 7 0.4 16 0.6 0.7 1.4 2.0 1.6 18 14
Monaco
0.04 7 7 -0.0 6 0.04 0.04 1.1 — — 13 24
netherlands
16.6 11 8 0.3 2 17.2 17.3 1.0 3.8 1.7 18 15
switzerland
7.8 10 8 0.2 5 8.3 8.3 1.1 4.3 1.5 15 17
eaStern eUrope
295 12 13 -0.2 1 287 254 0.9 8 1.5 15 14
Belarus
9.5 12 14 -0.3 1 9.1 8.3 0.9 4.7 1.4 15 14
Bulgaria
7.5 11 14 -0.4 -2 6.9 5.9 0.8 9.0 1.6 14 18
Czech republic
10.5 11 10 0.1 3 10.9 10.8 1.0 2.9 1.5 14 15
hungary
10.0 10 13 -0.3 2 9.8 9.0 0.9 5.0 1.3 15 16
Moldova
4.1 11 12 -0.0 -1 4.0 3.5 0.8 12 1.3 17 10
Poland
38.2 11 10 0.1 -0 37.4 31.8 0.8 5.6 1.4 15 13
romania
21.5 10 12 -0.2 0 20.6 18.2 0.9 10.3 1.3 15 15
russia
141.9 12 14 -0.2 2 140.8 126.7 0.9 8.2 1.5 15 13
slovakia
5.4 11 10 0.2 1 5.4 4.9 0.9 5.7 1.4 15 12
ukraine
45.9 11 15 -0.4 0 41.9 35.3 0.8 9.3 1.5 14 16
SoUthern eUrope
156 10 9 0.1 5 159 157 1.0 5 1.4 15 18
albania
3.2 10 5 0.5 1 3.3 2.9 0.9 18 1.6 25 9
andorra
0.1 10 3 0.7 -11 0.1 0.1 0.9 3.4 1.2 14 13
Bosnia-herzegovina
3.8 9 9 0.0 0 3.7 3.1 0.8 5 1.2 16 14
Croatia
4.4 10 12 -0.2 1 4.3 3.8 0.9 5.6 1.5 15 17
greece
11.3 11 10 0.1 3 11.7 11.5 1.0 2.7 1.5 14 19
italy
60.5 10 10 -0.0 6 61.9 61.7 1.0 3.6 1.4 14 20
Kosovo
f
2.3 21 7 1.4 — 2.7 3.2 1.4 33 2.5 31 6
Macedonia
g
2.1 12 9 0.2 -1 2.0 1.9 0.9 11 1.5 19 11
Malta
0.4 10 8 0.2 6 0.4 0.4 1.0 6.1 1.4 16 14
Montenegro
0.6 13 9 0.4 -1 0.6 0.6 1.0 7.5 1.8 20 13
Portugal
10.7 9 10 -0.1 2 10.9 10.7 1.0 4.2 1.3 15 18
san Marino
0.03 10 7 0.3 9 0.04 0.04 1.1 3.2 1.2 15 16
serbia
7.3 9 14 -0.5 0 6.8 5.9 0.8 6.7 1.4 15 17
slovenia
2.1 11 9 0.2 6 2.0 1.9 0.9 2.4 1.5 14 16
spain
47.1 11 8 0.3 8 48.4 49.1 1.0 3.5 1.4 15 17
OCEANIA
37 18 7 1.1 8 45 58 1.6 21 2.5 24 11
australia
22.4 14 6 0.7 13 26.9 34.0 1.5 4.4 1.9 19 13
Federated states of Micronesia
0.1 25 6 1.9 -15 0.1 0.1 1.2 38 3.9 37 4
Fiji
0.9 24 7 1.7 -8 0.9 0.9 1.1 18 2.6 29 5
French Polynesia
0.3 18 5 1.3 -1 0.3 0.4 1.3 6.2 2.2 26 6
guam
0.2 19 4 1.5 13 0.2 0.3 1.4 10.9 2.7 28 7
Kiribati
0.1 27 9 1.8 -1 0.1 0.2 1.6 52 3.5 36 4
Marshall islands
0.1 34 6 2.8 -23 0.1 0.1 1.1 21 4.3 41 2
nauru
0.01 28 10 1.9 0 0.01 0.02 1.5 38 3.2 39 1
new Caledonia
0.3 16 5 1.2 7 0.3 0.4 1.4 6 2.1 28 6
new Zealand
4.4 14 7 0.8 5 5.0 5.6 1.3 4.9 2.1 21 13
Palau
0.02 13 7 0.6 2 0.02 0.02 1.1 20 2.0 24 6
Papua new guinea
6.8 31 10 2.2 0 9.1 13.4 2.0 51 4.1 40 2
samoa
0.2 26 5 2.0 -11 0.2 0.2 1.1 20 4.2 40 5
solomon islands
0.5 33 8 2.5 -3 0.8 1.2 2.3 24 4.4 41 3
tonga
0.1 29 7 2.2 -17 0.1 0.1 1.2 19 4.2 38 6
tuvalu
0.01 23 9 1.4 -9 0.01 0.01 1.4 35 3.7 32 6
Vanuatu
0.2 31 6 2.5 0 0.3 0.5 2.2 25 4.0 40 3
See notes on page 17.
© 2010 Population reference Bureau 2010 WORLD POPULATION DATA SHEET 10See notes on page 17.
WORLD
9
4 69 67 71 50 0.8 0.9 62 55
MORE DEVELOPED
4 2 77 74 81 75 0.7 0.3 71 60
LESS DEVELOPED
11 4 67 66 69 44 0.9 1.1 60 54
LESS DEVELOPED (Excl. China)
13 5 65 63 67 44 1.1 1.4 52 44
LEAST DEVELOPED
17 9 56 55 57 27 1.9 2.7 29 23
AFRICA
16 9 55 54 57 38 3.2 4.8 29 23
SUB-Saharan afrIca
17 11 52 51 53 35 3.7 5.6 23 17
northern afrIca
14 5 69 67 71 50 0.3 0.4 49 44
algeria
15 4 72 71 74 63 0.1 <0.1 61 52
egypt
14 5 72 69 75 43 <0.1 <0.1 60 58
libya
15 4 74 72 77 77 — — 42 20
Morocco
12 4 71 69 73 57 0.2 <0.1 63 55
sudan
16 8 58 57 60 38 1.1 1.7 8 6
tunisia
10 3 74 72 76 66 <0.1 <0.1 60 52
Western sahara
d
29 4 60 58 62 81 — — — —
weStern afrIca
18 11 51 50 52 42 2.1 3.0 14 10
Benin
16 10 59 57 60 41 0.9 1.6 17 6
Burkina Faso
26 14 53 51 54 23 1.5 1.7 17 13
Cape Verde
15 5 73 69 76 61 — — 61 57
Côte d'ivoire
14 9 52 51 54 50 3.1 4.7 13 8
gambia
19 12 55 54 57 54 0.7 1.0 10 9
ghana
16 8 60 58 61 48 1.5 2.3 24 17
guinea
16 10 57 55 58 28 1.3 2.0 9 6
guinea-Bissau
16 12 46 45 48 30 1.5 2.2 10 6
liberia
17 10 56 54 57 58 1.4 2.1 11 10
Mali
23 14 51 50 53 33 1.2 1.7 8 6
Mauritania
22 9 57 55 59 40 1.2 0.5 9 8
niger
24 19 48 48 49 20 1.1 0.5 11 5
nigeria
17 11 47 47 48 47 2.5 3.8 15 10
senegal
23 12 55 54 57 41 0.8 1.2 12 10
sierra leone
30 16 47 46 49 36 1.4 2.0 8 7
togo
16 8 61 60 63 40 2.6 3.9 17 11
eaStern afrIca
17 12 53 52 54 22 4.5 6.7 28 23
Burundi
21 9 50 49 52 10 1.6 2.4 9 8
Comoros
19 7 64 62 66 28 <0.1 <0.1 26 19
djibouti
18 8 55 54 57 76 2.4 3.7 18 17
eritrea
22 9 59 57 62 21 1.0 1.5 8 5
ethiopia
17 11 55 54 57 16 1.6 2.4 15 14
Kenya
21 11 57 56 57 18 4.3 8.0 46 39
Madagascar
18 10 60 59 62 31 0.2 <0.1 40 29
Malawi
16 13 49 48 50 14 10.2 13.5 41 38
Mauritius
9 3 73 69 76 42 2.4 1.0 76 42
Mayotte
18 6 74 72 76 28 — — — —
Mozambique
16 13 48 47 49 31 10.0 14.9 17 12
reunion
9 3 78 75 82 92 — — 67 64
rwanda
22 11 51 50 53 17 2.3 3.2 36 27
seychelles
— — 73 68 78 53 — — — —
somalia
19 13 49 48 51 34 0.8 0.3 15 1
tanzania
17 13 55 55 56 25 5.0 7.6 26 20
uganda
19 16 52 52 53 13 4.3 6.6 24 18
Zambia
17 16 42 41 42 37 12.4 18.0 41 33
Zimbabwe
14 10 43 41 44 37 12.2 18.7 60 58
mIDDLe afrIca
18 13 48 47 50 41 1.9 3.1 19 7
angola
21 13 47 45 49 57 1.7 2.5 6 5
Cameroon
16 10 51 50 52 53 3.9 6.3 26 13
Central african republic
14 10 49 47 50 38 4.6 8.0 19 9
Chad
18 14 49 47 50 27 2.8 4.2 3 2
Congo
15 9 53 52 54 60 2.1 4.1 44 13
Congo, dem. rep.
19 14 48 46 49 33 1.0 1.6 21 6
equatorial guinea
20 12 49 48 51 39 2.8 4.1 — —
gabon
14 7 60 58 61 84 4.8 7.1 33 12
sao tome and Principe
14 7 66 64 69 58 — — 38 34
2010 2050 Both Sexes Males Females Percent Urban Males Females All Methods
Modern
Methods
Life Expectancy
at Birth (years)
Percent of Population
With HIV/AIDS
Adults Ages 15–49,
2007/2009
Percent of Married
Women 15–49 Using
Contraception
Elderly
Support Ratio
c
POPULATION, HEALTH, AND ENVIRONMENT DATA AND ESTIMATES
FOR THE COUNTRIES AND REGIONS OF THE WORLD