Шарстнёв В.Л. Компьютерные информационные технологии
Подождите немного. Документ загружается.

301
Однако, в отличие от SAS, компания, производящая эту программу всегда
была в значительной степени ориентирована на непрофессионалов, и поэтому
уже с ранних версий для персональных компьютеров (SPSS PC+) программа
полагалась на разветвленную систему меню. При этом система меню была
лишь оболочкой (front-end) для ядра программы, управляемого командным
языком. Использование меню приводило к автоматическому формированию
команд для SPSS, которые затем необходимо было передать командному
процессору (тот же принцип используется и Overstat).
В ходе эволюции SPSS принцип "общения" оболочки с ядром оставался
прежним, однако становился все более и более скрытым от пользователя. Так, в
последних версиях SPSS для того, чтобы увидеть команды, сформированные
оболочкой, необходимо специально сообщить системе о своем желании.
Длительное время ядро SPSS оставалось без изменений, однако в версии
7.5 один из основных компонентов - общая линейная модель (GLM) - был
переписан.
Кроме того, фирма-производитель отказалась от развития SPSS на
платформах, отличных от Windows, что привело к возможности создать
систему, имеющую столь привычную для пользователей Windows, сокращая,
таким образом, время на обучение пользователей.
Сейчас SPSS включает большое количество статистических процедур,
возможности по манипуляции данными и создания графиков. Проработка
статистических алгоритмов чрезвычайно тщательная и позволяет хорошо
контролировать процесс обработки данных. Большинство опций доступно из
меню и диалоговых окон, что выгодно отличает SPSS от оболочек SAS.
NCSS 2006
Система NCSS является относительно молодой, однако это с лихвой
компенсируется полнотой охвата статистических процедур внутри одной
программы (без дополнительных модулей).
PDF created with pdfFactory Pro trial version www.pdffactory.com
302
По количеству предлагаемых процедур NCSS напоминает S-plus,
предлагая большое количество процедур кластерного анализа, детальную
описательную статистику, графики и многие другие статистические методики.
Внешний вид программы также напоминает S-plus, особенно диалоговыми
окнами с закладками для выбора параметров процедур. Явным достоинством
системы является то, что все ее возможности доступны из ниспадающих меню,
а сопровождающая программу система подсказки содержит набор пошаговых
инструкций с примерами, позволяющий быстро овладеть ее основными
возможностями. Результаты, генерируемые программой, автоматически
сохраняются в rtf-файле, который затем легко прочитать и редактировать
любым современным текстовым редактором. Сами результаты организованы
таким образом, что их легко просматривать и анализировать. Аналогично SAS
система по умолчанию рассчитывает большое количество статистик, позволяя
охватывать их всех одним взглядом.
Недостатки системы частично кроются в том, что она создавалась при
помощи Visual Basic - отнюдь не самого быстрого языка программирования.
Следствием оказывается очень большое время загрузки программы и
исполнения на относительно маломощных компьютерах. Кроме того,
генерируемые программой графики не могут редактироваться. Однако в
остальном NCSS является весьма привлекательной системой для начинающих
пользователей.
SYSTAT 11.0
Данная программа позиционируется как полномасштабная статистическая
система для исследователей. SYSTAT существует в версиях для пользователей
обоих основных типов персональных компьютеров - на платформе Windows и
Macintosh. Структура SYSTAT очень похожа на структуру всех остальных
программ, базирующихся на ядре командного интерпретатора с оболочкой в
виде меню и панели кнопок.
Вместе с тем, по целому ряду параметров SYSTAT действительно является
очень удобной для исследователей системой. Во-первых, эта программа
предлагает весьма широкий набор статистических процедур в рамках одного
PDF created with pdfFactory Pro trial version www.pdffactory.com

303
модуля, достаточно компактного и быстрого. Данная система была одной из
первых, включивших дендрологическое моделирование в структуру
встроенных команд. Кроме того, SYSTAT поддерживает специальный набор
процедур для статистического распознавания сигнала. Анализ опросных
данных позволяет проводить классический анализ и логистический анализ.
Имеется и множество других примеров мощности системы SYSTAT.
В целом система SYSTAT является мощным и удобным инструментом для
начинающих пользователей и пользователей среднего звена.
Итоги сравнения
Сравнивая различные статистические программы, следует учитывать, что
практически все они обладают набором стандартных процедур. Алгоритмы,
используемые программами, по большей части стандартные, и различий при
использовании той или иной программы нет (было бы удивительно, если бы
они существовали). Поэтому на первое место выходят различия в
пользовательском интерфейсе, полнота охвата современных статистических
методов, программируемость, наличие дополнительных модулей расширения и
легкость использования полученных графиков и таблиц в других программах.
Не все перечисленные выше требования могут выполняться одновременно. Так,
например, программируемость и расширяемость обычно плохо сочетаются с
полнотой пользовательского интерфейса. Вообще достаточно четко
проявляется правило - чем более разработан пользовательский интерфейс и
графическая подсистема, тем "тяжелее" приложение. На одном полюсе
находятся в этом отношении STATA и SAS - управляемые преимущественно из
командной строки, но зато с большим количеством легко подключаемых и
используемых дополнительных модулей. На другом - Statgraphics+, NCSS и
Statistica, которые имеют чрезвычайно привлекательный интерфейс, полный и
удобный для начинающих, однако при почти полном отсутствии
дополнительных (бесплатных) модулей и подпрограмм.
Те, кто по ходу своей работы сталкивается с необходимостью применять
необычные статистические подходы или хочет воспользоваться идеями,
созданными и реализованными другими людьми, должен обратить свое
внимание на системы, управляемые из командной строки. SAS является
наиболее разработанной программой этого класса с большим количеством
готовых подпрограмм, широким охватом процедур и языком манипулирования
матрицами, что чрезвычайно удобно для написания статистических программ.
Наличие оболочек для SAS (собственный ASSISST и бесплатный OverStat)
позволяет легко создавать сложные задания для обработки данных и
анализировать их достаточно быстро (все системы, работающие в пакетном
режиме, позволяют обсчитывать данные быстрее, чем системы, основанные на
меню). Stata несколько отстает от SAS в отношении удобства
программирования (субъективный взгляд автора), обладает не столь широкими
возможностями, однако это с лихвой компенсируется наличием большого
PDF created with pdfFactory Pro trial version www.pdffactory.com

304
количества дополнительных модулей и подписным листом, в котором
пользователи приводят свои программы, рассчитанные на анализ различных
статистических моделей.
Естественно, эти две программы вряд ли могут быть рекомендованы для
новичков в области обработки данных, которые не собираются часто прибегать
к нестандартным статистическим процедурам. Это инструменты лиц, часто
занимающихся анализом больших массивов данных, использующих различные
статистические подходы и желающих иметь контроль над процессом обработки
результатов.
Промежуточную позицию занимает SPSS, являясь одновременно и
системой с мощным языком программирования и достаточно дружелюбным к
пользователю интерфейсом. Вообще ряд возможностей, предлагаемых SPSS,
особенно в области факторного анализа, является самым широким среди всех
описанных систем.
Язык SPSS достаточно прост и позволяет автоматизировать часто
повторяющиеся задания. В целом SPSS может быть рекомендована
пользователям, которые хотят иметь систему с простым, интуитивным
интерфейсом, относительно развитой графикой и периодически использующим
язык программирования для автоматизации более сложных заданий.
Если же речь заходит о начинающих пользователях, то им следует
обратить свое внимание на Statistica или Statgraphics+. Для людей,
относительно ориентирующихся в статистических методиках или начинающих
изучение статистики, наиболее адекватной будет использование системы
Statistica. Дружелюбный интерфейс, развитая система подсказки и полнота
представленных статистических процедур позволяют рекомендовать эту
систему начинающим пользователям и непрофессионалам, часто
использующим в своей работе статистические методы анализа.
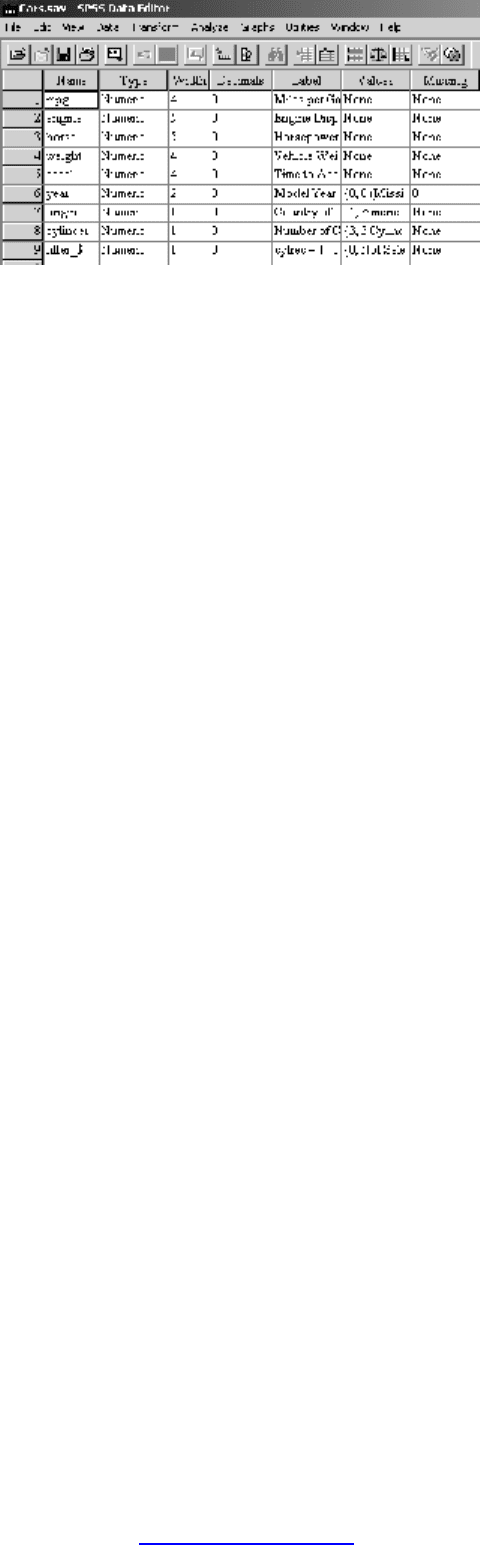
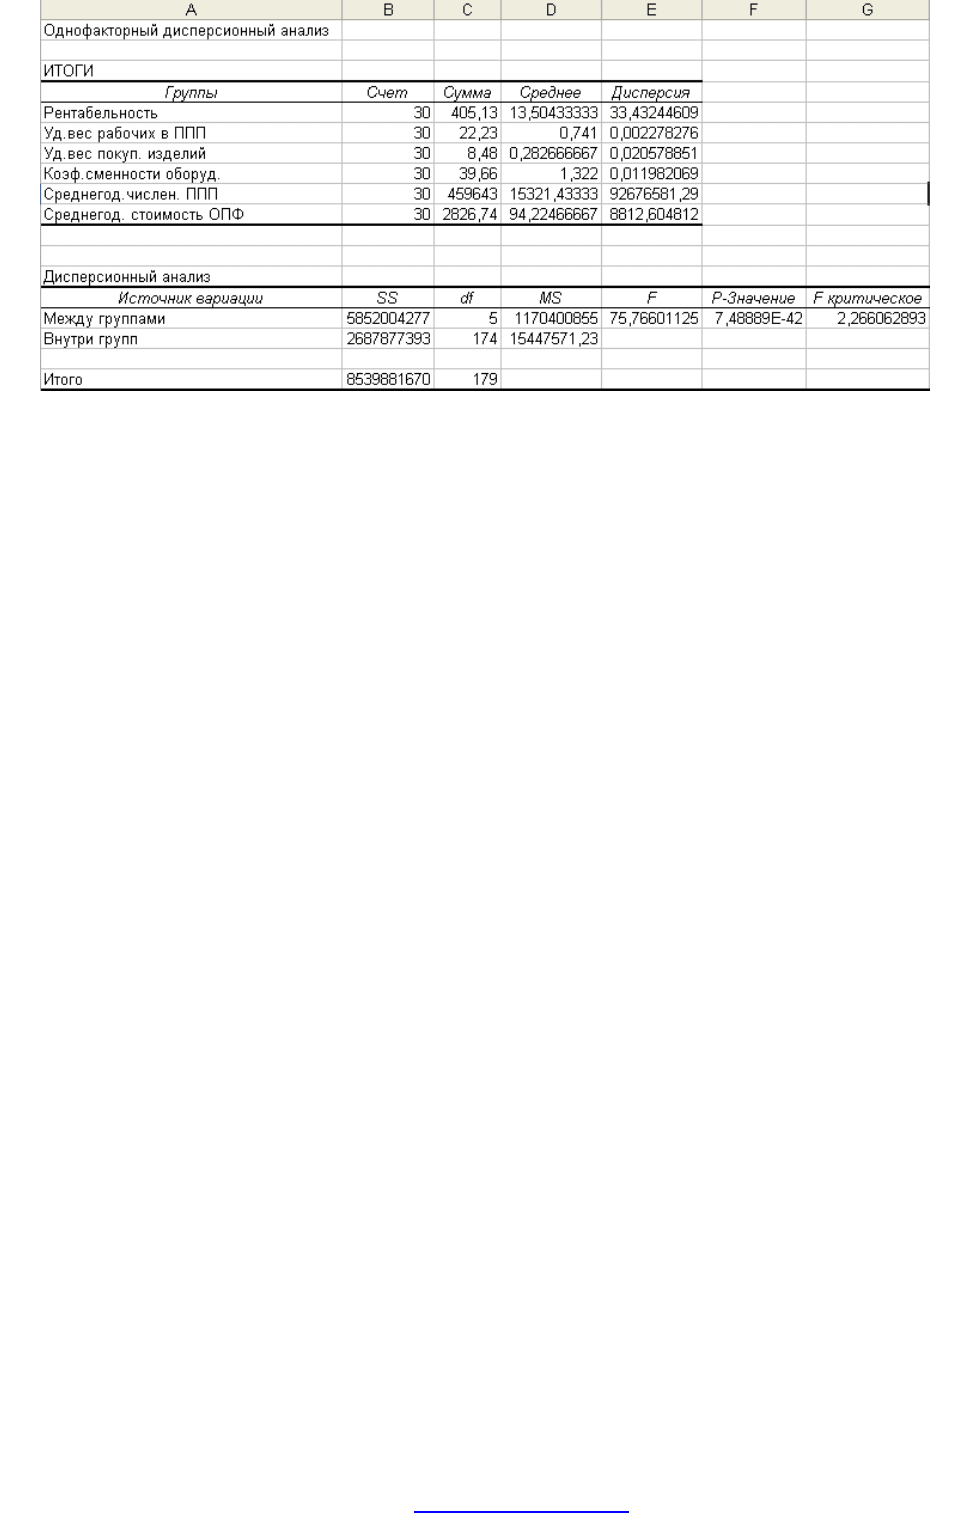
С целью демонстрации возможностей некоторых из перечисленных выше
программ решим задачу построения модели на основе данных приведенных
ниже. В качестве зависимой переменной будет выступать рентабельность
(столбец 1), в качестве независимых переменных – столбцы 2-6.
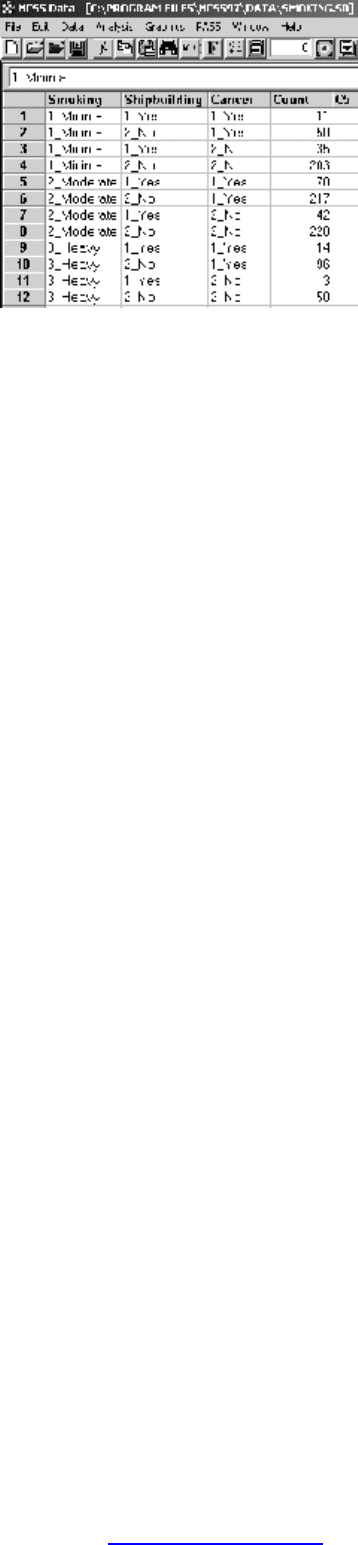
Исходные данные
PDF created with pdfFactory Pro trial version www.pdffactory.com
305
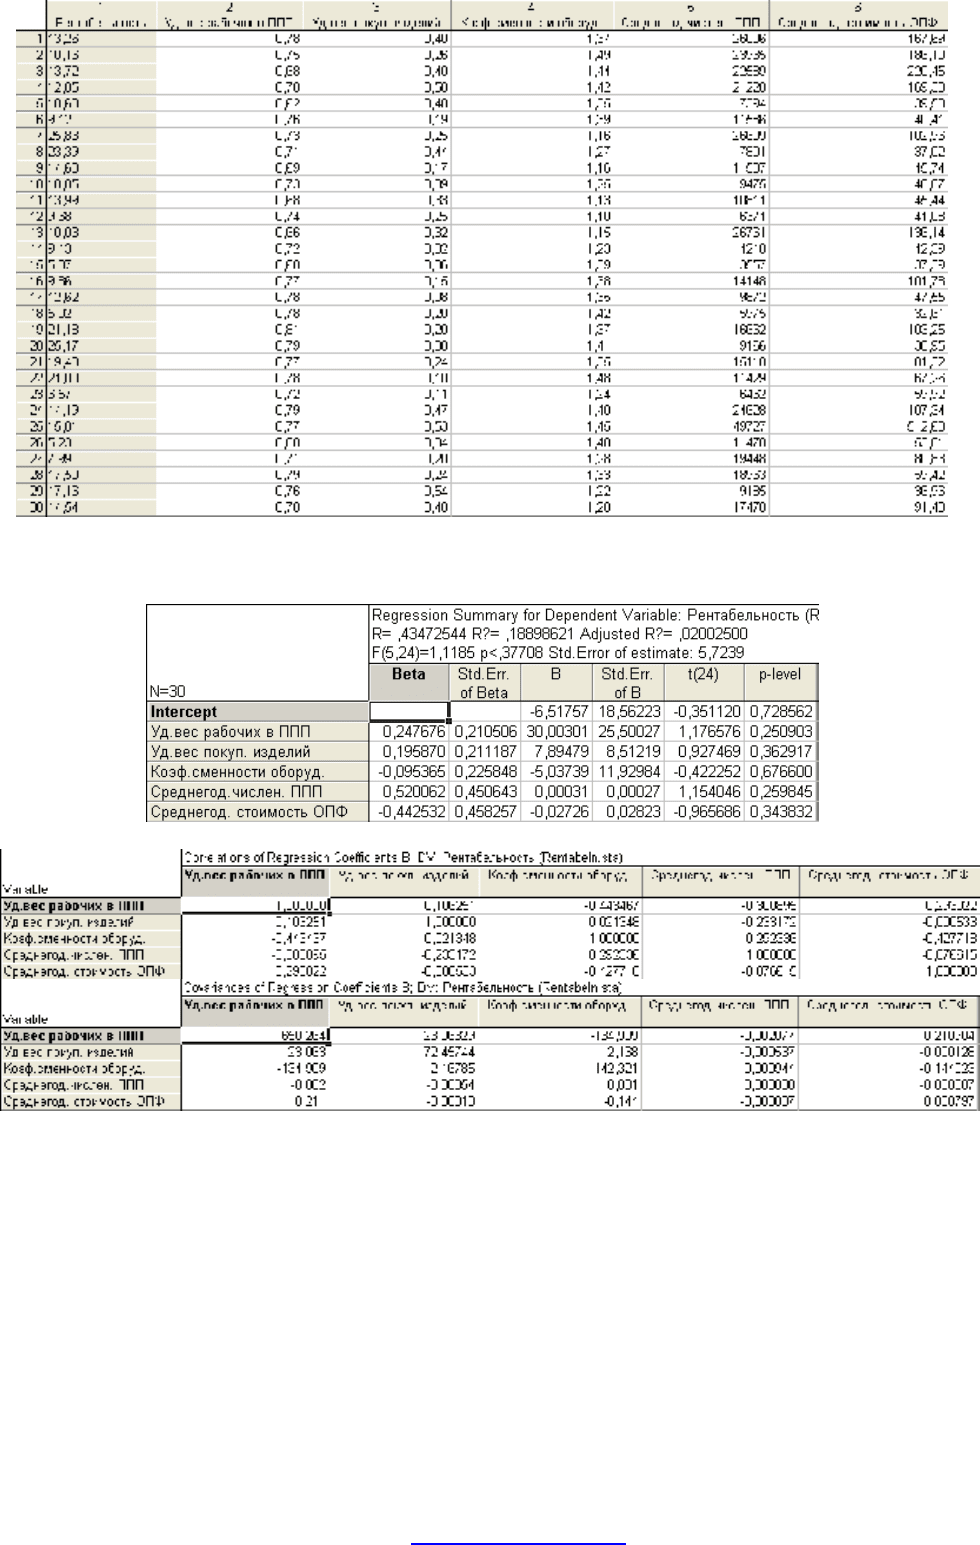
Statistica 6.0
NCSS Statistical and Data Analysis
Multiple Regression Report
Page/Date/Time 1 13.12.2005 16:28:45
Database
Dependent Y
Run Summary Section
Parameter Value Parameter Value
Dependent Variable Y Rows Processed 30
PDF created with pdfFactory Pro trial version www.pdffactory.com

306
Number Ind. Variables 5 Rows Filtered Out 0
Weight Variable None Rows with X's Missing 0
R2 0,19 Rows with Weight Missing 0
Adj R2 0,02 Rows with Y Missing 0
Coefficient of Variation 0,42 Rows Used in Estimation 30
Mean Square Error 32,76 Sum of Weights 30,00
Square Root of MSE 5,72 Completion Status Normal Completion
Ave Abs Pct Error 36,25
Descriptive Statistics Section
Standard
Variable Count Mean Deviation Minimum Maximum
X1 30 0,74 0,05 0,62 0,81
X2 30 0,28 0,14 0,02 0,54
X3 30 1,32 0,11 1,1 1,49
X4 30 15321,43 9626,87 3557 49727
X5 30 94,22 93,88 32,61 512,6
Y 30 13,50 5,78 5,02 25,83
Regression Equation Section
Regression Standard T-Value Reject Power
Independent Coefficient Error to test Prob H0 at of Test
Variable b(i) Sb(i) H0:B(i)=0 Level 5,0%? at 5,0%
Intercept -6,52 18,56 -0,35 0,73 No 0,06
X1 30,00 25,50 1,18 0,25 No 0,20
X2 7,89 8,51 0,93 0,36 No 0,14
X3 -5,04 11,93 -0,42 0,68 No 0,07
X4 0,00 0,00 1,15 0,26 No 0,20
X5 -0,03 0,03 -0,97 0,34 No 0,15
Estimated Model
-6.51757324242446+ 30.0030134781668*X1+ 7.89479437491242*X2-5.03739438502802*X3+
3.12359142056359E-04*X4-2.72569392544667E-02*X5
Regression Coefficient Section
Independent Regression Standard Lower Upper Standardized
Variable Coefficient Error 95,0% C.L. 95,0% C.L. Coefficient
Intercept -6,52 18,56 -44,83 31,79 0,00
X1 30,00 25,50 -22,63 82,63 0,25
X2 7,89 8,51 -9,67 25,46 0,20
X3 -5,04 11,93 -29,66 19,58 -0,10
X4 0,00 0,00 0,00 0,00 0,52
X5 -0,03 0,03 -0,09 0,03 -0,44
Note: The T-Value used to calculate these confidence limits was 2,06.
Multiple Regression Report
Page/Date/Time 2 13.12.2005 16:28:45
Database
Dependent Y
Analysis of Variance Section
Sum of Mean Prob Power
Source DF R2 Squares Square F-Ratio Level (5,0%)
Intercept 1 5471,01 5471,01
Model 5 0,19 183,23 36,65 1,12 0,38 0,33
Error 24 0,81 786,31 32,76
Total(Adjusted) 29 1,00 969,54 33,43
Analysis of Variance Detail Section
Model Sum of Mean Prob Power
PDF created with pdfFactory Pro trial version www.pdffactory.com
307
Term DF R2 Squares Square F-Ratio Level (5,0%)
Intercept 1 5471,01 5471,01
Model 5 0,19 183,23 36,65 1,12 0,38 0,33
C2 1 0,05 45,35 45,35 1,38 0,25 0,20
C3 1 0,03 28,18 28,18 0,86 0,36 0,14
C4 1 0,01 5,84 5,84 0,18 0,68 0,07
C5 1 0,05 43,63 43,63 1,33 0,26 0,20
C6 1 0,03 30,55 30,55 0,93 0,34 0,15
Error 24 0,81 786,31 32,76
Total(Adjusted) 29 1,00 969,54 33,43
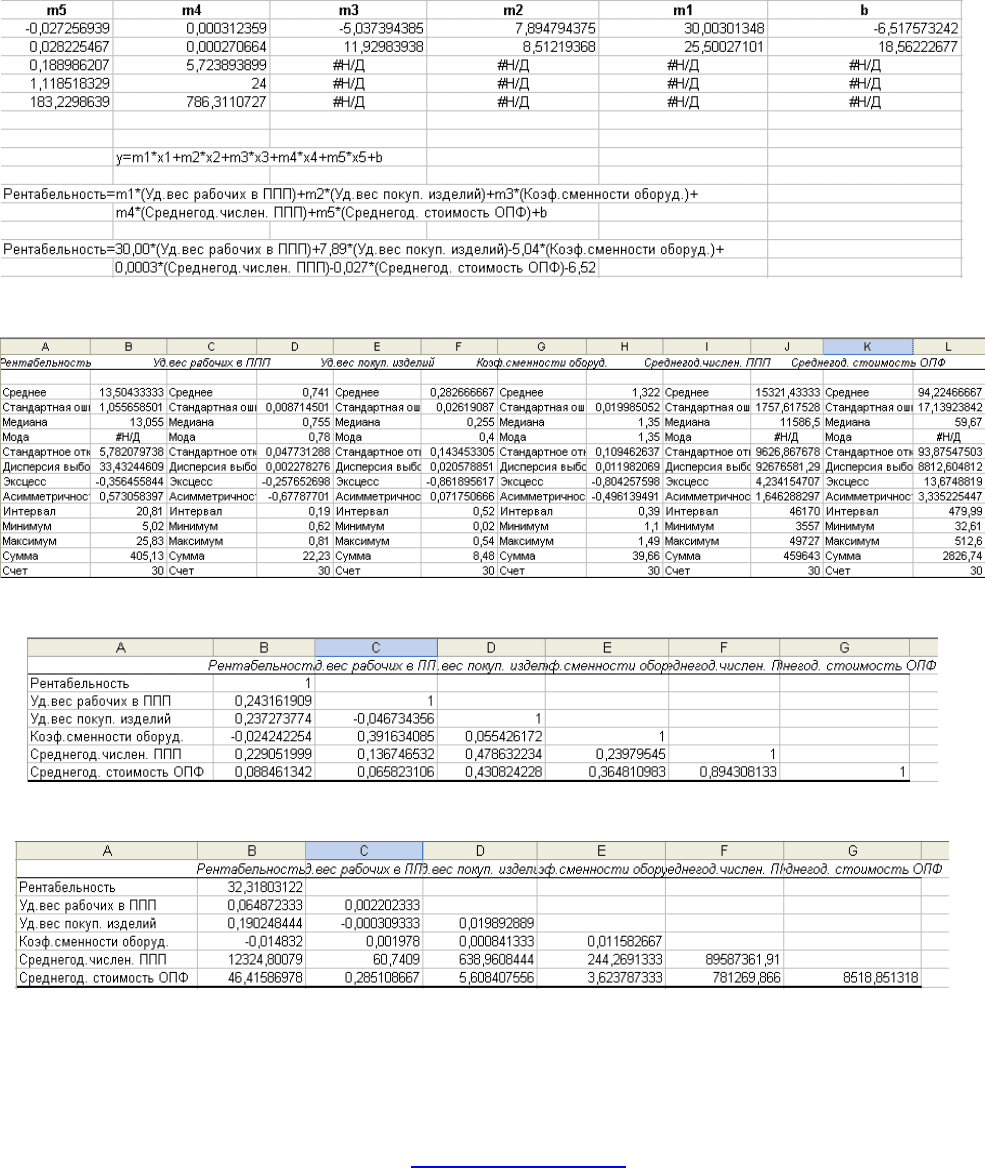
MICROSOFT EXCEL
Модель
Статистика
Корреляция
Ковариация
PDF created with pdfFactory Pro trial version www.pdffactory.com
308
Дисперсия
Обзор бухгалтерских программ
«БЭСТ-4» от компании Intellect-Service
Программный комплекс «БЭСТ-4» предназначен для автоматизации
предприятий торговли, производства, сферы услуг и бюджетных организаций.
Позволяет оперативно решать следующие задачи:
• бухгалтерский и налоговый учет;
• кассовые и банковские операции;
• договоры и взаиморасчеты;
• управление закупками и продажами;
• учет имущества и материальных запасов;
• расчет заработной платы.
Программа создана для малых и средних предприятий оптовой и
розничной торговли, бюджетных структур, организаций сферы услуг и
промышленных предприятий с локальной сетью, объединяющей до 100
рабочих мест.
В состав программы «БЭСТ-4» входят такие автоматизированные рабочие
места (АРМ), как:
• АРМ главного бухгалтера;
• расчетные и валютные счета;
• касса. Подотчетные лица;
• учет материальных запасов;
• кассовый программный модуль;
• учет заработной платы;
• анализ движения средств;
• учет основных средств и НМА;
• формирование отчетов;
PDF created with pdfFactory Pro trial version www.pdffactory.com

309
• сводный баланс;
• модуль обмена данными;
• конструктор отчетов.
Работает как в локальном, так и в сетевом варианте с неограниченным
числом рабочих мест. Позволяет автоматизировать учет на предприятиях и в
организациях различных форм собственности и специализаций.
К особенностям системы относятся: учет на удаленных объектах,
взаимодействие с кассовыми аппаратами, оперативный учет движения товарно-
материальных ценностей.
«1С:БУХГАЛТЕРИЯ 7.7»
Программа «1С:БУХГАЛТЕРИЯ 7.7 СТАНДАРТНАЯ ВЕРСИЯ»,
предназначена для ведения автоматизированного бухгалтерского учета на
предприятии.
Стандартная версия содержит:
• стандартный план счетов;
• набор справочников, документов и отчетов.
Стандартная версия также поддерживает конфигурацию, выпускаемую для
автоматизации учета в бюджетных организациях.
Компонента «Бухгалтерский учет», системы 1С:Предприятие,
предназначена для учета наличия и движения основных средств предприятия.
Она может использоваться как автономно, так и совместно с другими
компонентами «1С:Предприятия».
1С:Бухгалтерия позволяет автоматизировть следующие разделы
бухгалтерского учета:
• операции по банку и кассе;
• основные средства и нематериальные активы;
• материалы и МБП;
• товары и услуги;
• учет производства продукции;
• учет валютных операций;
• взаиморасчеты с организациями;
• расчеты с подотчетными лицами;
• расчеты по заработной плате;
• расчеты с бюджетом;
• другие разделы учета.
Программа позволяет производить как ручной, так и автоматический ввод
бухгалтерских операций.
1С:Бухгалтерия позволяет автоматизировать подготовку любых первичных
документов:
• платежные поручения;
PDF created with pdfFactory Pro trial version www.pdffactory.com

310
• счета на оплату и счета-фактуры;
• приходные и расходные кассовые ордера;
• накладные, требования, доверенности;
• другие документы.
Средства работы с документами позволяют организовать ввод документов,
их произвольное распределение по журналам и поиск любого документа по
различным критериям: номеру, дате, сумме, контрагенту.
«ПАРУС»
Компания подготовила ряд высококачественных и недорогих решений с
различными вариантами комплектации программного обеспечения. Для
предприятий малого и среднего бизнеса - это прежде всего программное
обеспечение для автоматизации бухгалтерской и учетно-управленческой
деятельности.
Корпорация Парус предлагает комплексную систему автоматизации
управления производством, включающую в себя следующие модули:
• управление финансами;
• управление логистикой;
• управление персоналом;
• специализированный модуль, решающий задачи производственного
учета, учета затрат и калькуляции себестоимости, технико-
экономического планирования.
Отличительными чертами является открытость и масштабируемость
системы, которая обеспечивает возможность интеграции с существующими на
предприятии информационными системами. При этом в комплект поставки
могут быть включены структуры баз данных, информационные модели IDEF и
даже исходные тексты программного продукта.
«АНЖЕЛИКА» от компании Golden Software
Комплекс программных средств для автоматизации бухгалтерского учета.
В состав программы «АНЖЕЛИКА» входят:
• печать платежных поручений;
• Анжелика - бухгалтер;
• зарплата - Анжелика;
• средства - Анжелика;
• аренда - Анжелика;
• договор - Анжелика;
• Анжелика – директор;
• Анжелика - основные средства
PDF created with pdfFactory Pro trial version www.pdffactory.com