Schulz H.E., Andrade A.L., Lobosco R.J. (Eds.) Hydrodynamics - Natural Water Bodies
Подождите немного. Документ загружается.

Astronomical Tide and Typhoon-Induced Storm Surge in Hangzhou Bay, China 9
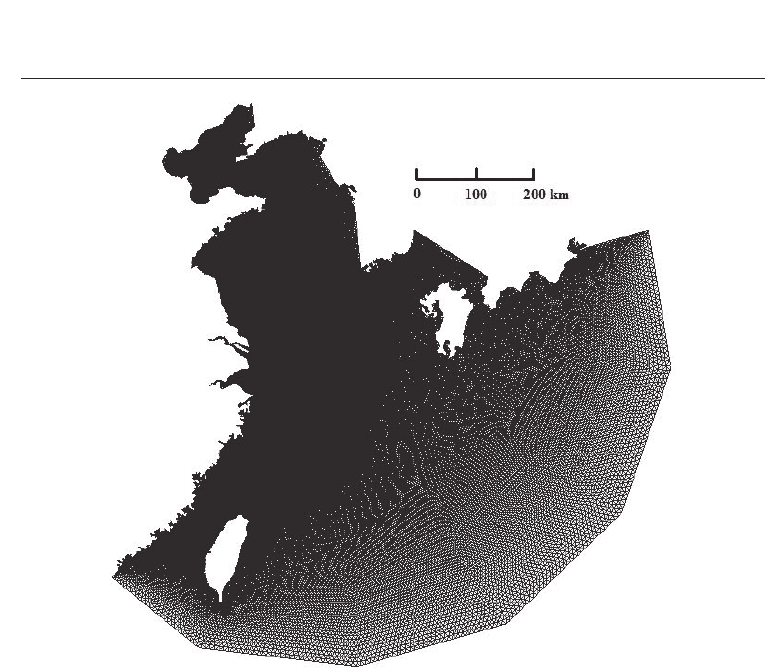
Fig. 6. A sketch of triangular grid for modeling typhoon-induced storm tide
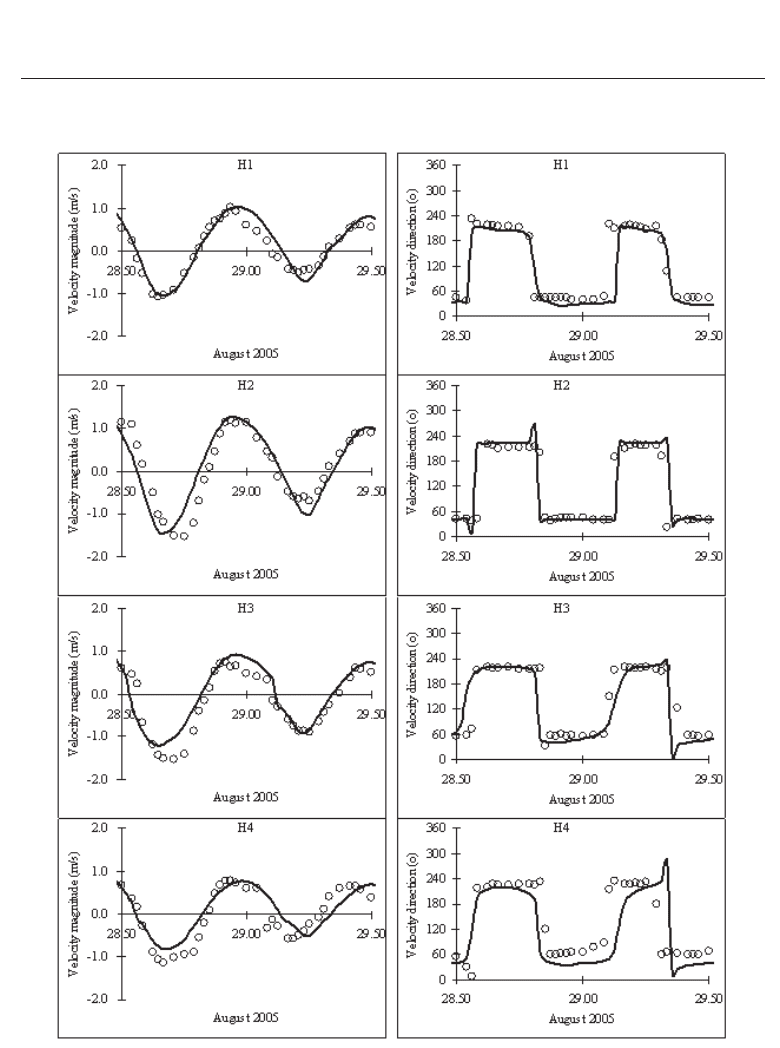
4.1.2 Current velocity
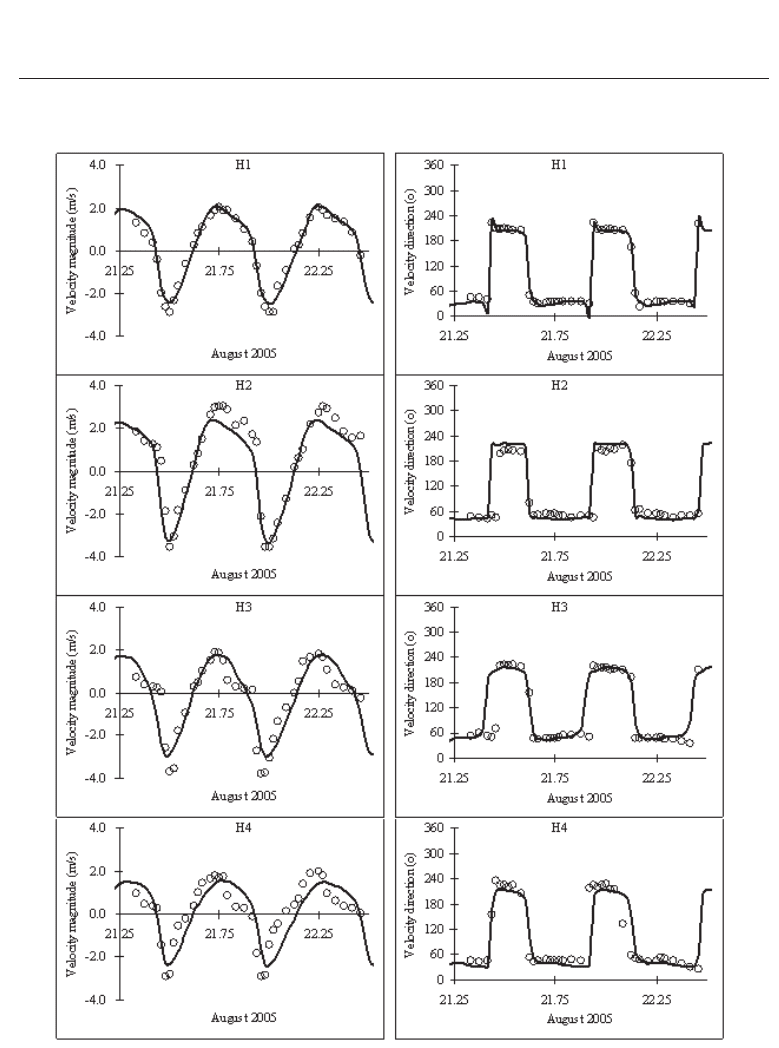
It is clearly seen from Figures 7 and 8 that the maximum tidal ranges occur at the Ganpu
station (T4). Thus, it is expected that the maximum tidal current may occur near this
region. The tidal currents were measured at four locations H1-H4 across the estuary near
Ganpu. These measurements are used to verify the numerical model. Figures 9 and 10 are
the comparison between simulated and measured depth-averaged velocity magnitude and
direction for the spring and neap tidal currents, respectively. It is seen that the flood tidal
velocity is clearly greater than the ebb flow velocity for both the spring and neap tides. The
maximum flood velocity occurs at H2 with the value of about 3.8 m/s, while the maximum
ebb flow velocity is about 3.1 m/s during the spring tide. During the neap tide, the maximum
velocities of both the flood and ebb are much less than those in the spring tide with the value
of 1.5 m/s for flood and 1.2 m/s for ebb observed at H2. The maximum relative error for
the ebb flow is about 17%, occurring at H2 during the spring tide. For the flood flow the
maximal relative error occurs at H3 and H4 for both the spring and neap tides with values
being about 20%. In general, the depth-averaged simulated velocity magnitude and current
direction agree well with the measurements, and the maximal error percentage in tidal current
is similar as that encountered in modeling the Mahakam Estuary (Mandang & Yanagi, 2008).
187
Astronomical Tide and Typhoon-Induced Storm Surge in Hangzhou Bay, China
10 Will-be-set-by-IN-TECH
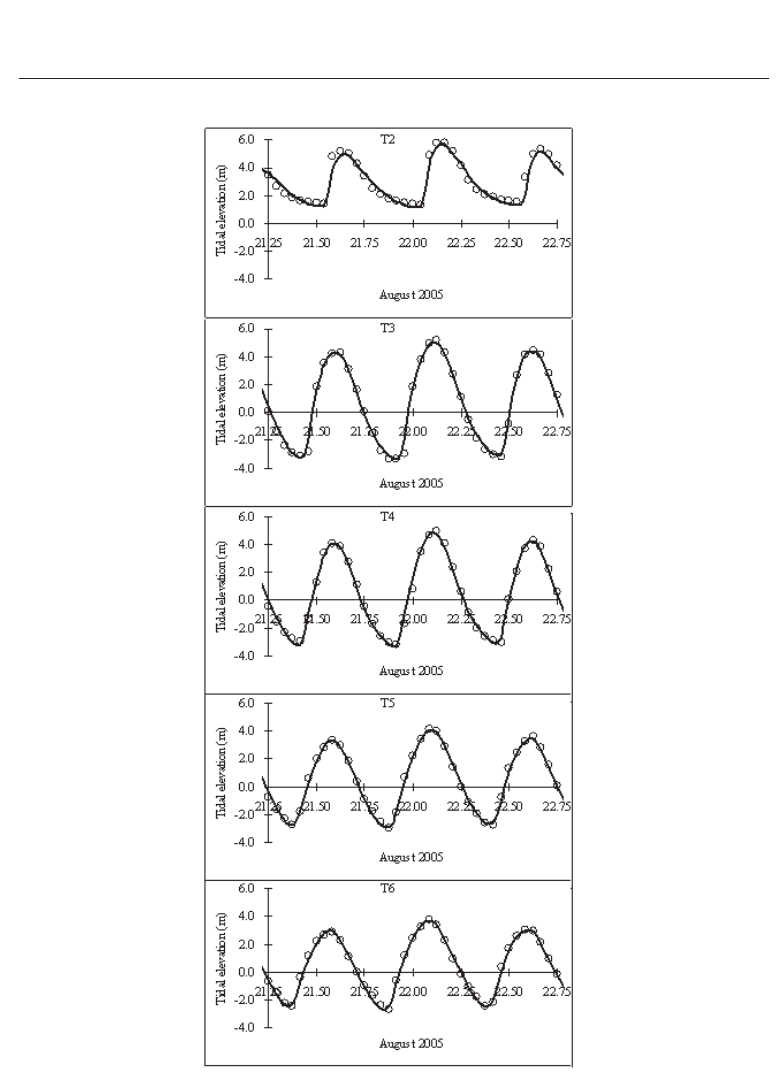
Fig. 7. Comparison of the computed and measured spring tidal elevations at stations T2-T6.
−:computed;◦:measured
188
Hydrodynamics – Natural Water Bodies
Astronomical Tide and Typhoon-Induced Storm Surge in Hangzhou Bay, China 11
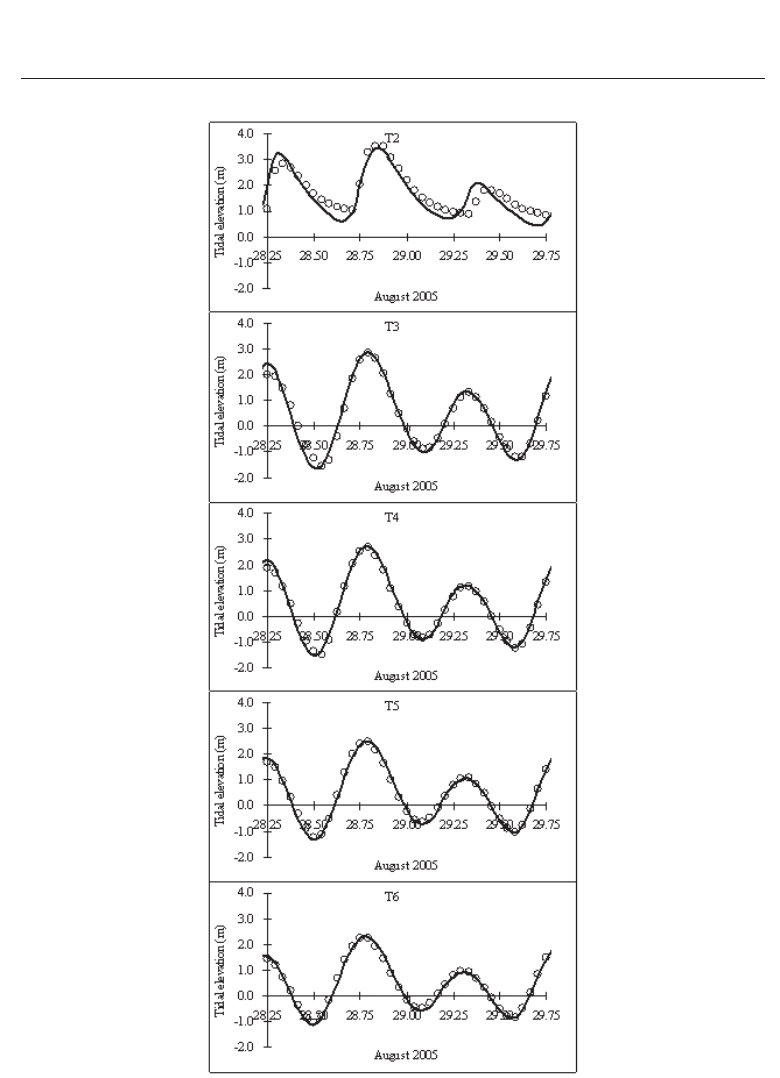
Fig. 8. Comparison of the computed and measured neap tidal elevations at stations T2-T6. −:
computed;
◦:measured
189
Astronomical Tide and Typhoon-Induced Storm Surge in Hangzhou Bay, China
12 Will-be-set-by-IN-TECH
Fig. 9. Comparison of the computed and measured depth-averaged spring current velocities
at stations H1-H4.
−:computed;◦:measured
190
Hydrodynamics – Natural Water Bodies
Astronomical Tide and Typhoon-Induced Storm Surge in Hangzhou Bay, China 13
Fig. 10. Comparison of the computed and measured depth-averaged neap current velocities
at stations H1-H4.
−:computed;◦:measured
191
Astronomical Tide and Typhoon-Induced Storm Surge in Hangzhou Bay, China

14 Will-be-set-by-IN-TECH
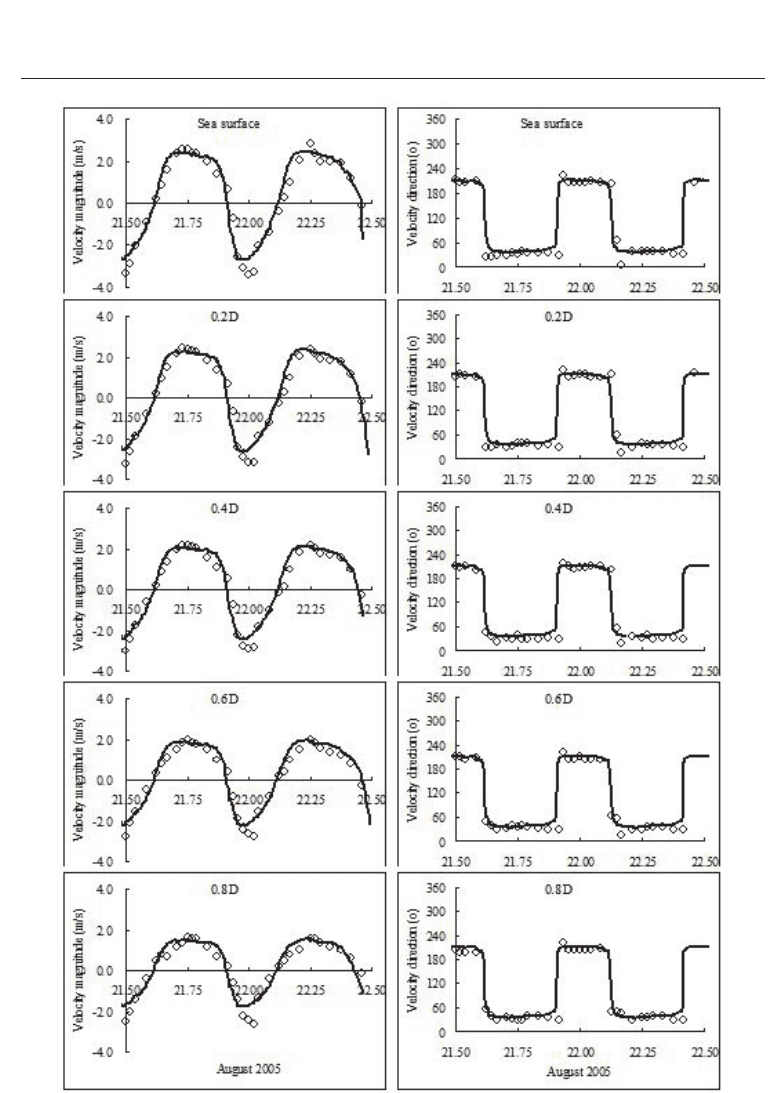
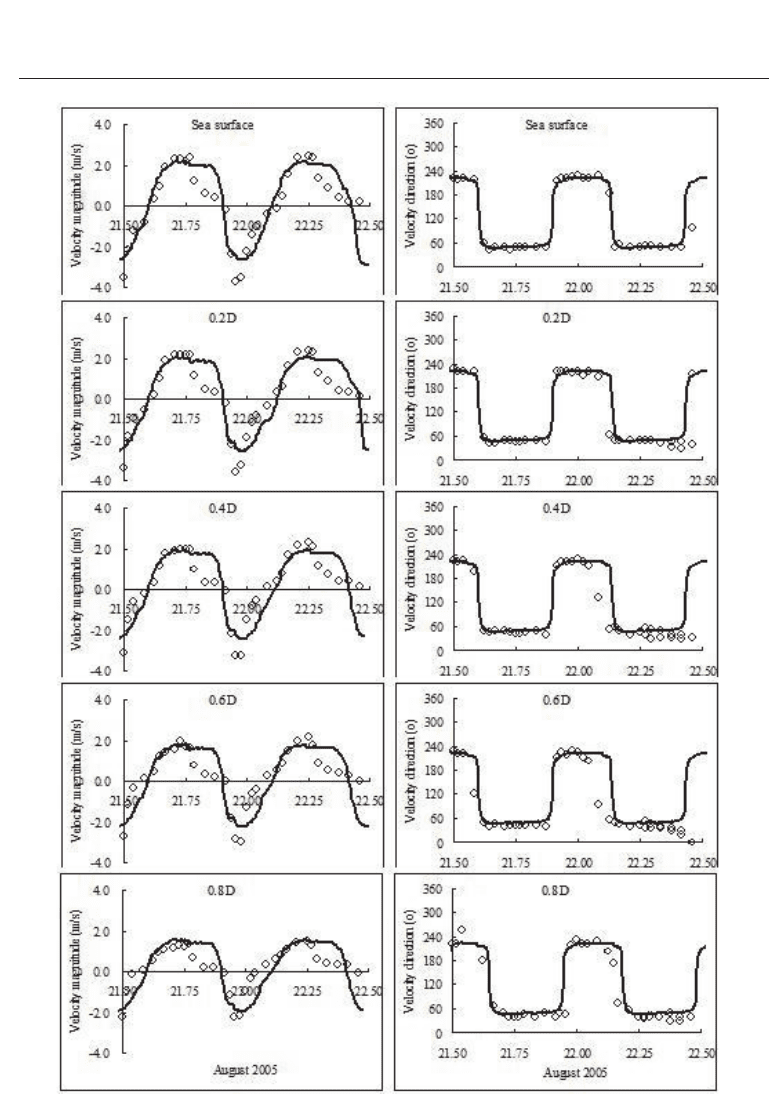
The vertical distributions of current velocities during spring tide are also compared at stations
H1 and H4. The measured and simulated flow velocities in different depths (sea surface, 0.2D,
0.4D, 0.6D and 0.8D, where D is water depth) at these two stations are shown in Figures 11 and
12. It is noted that the current magnitude obviously decreases with a deeper depth (from sea
surface to 0.8D), while the flow direction remains the same. The numerical model generally
provides accurate current velocity along vertical direction, except that the simulated current
magnitude is not as high as that of measured during the flood tide. The maximum relative
error in velocity magnitude during spring tide is about 32% at H4 station. Analysis suggests
that the errors in the tidal currents estimation are mainly due to the calculation of bottom shear
stress. Although the advanced formulation accounts for the impacts of flow acceleration and
non-constant stress distribution on the calculation of bottom shear stress, it can not accurately
describe the changeable bed roughness that depends on the bed material and topography.
4.2 Typhoon-induced storm surge
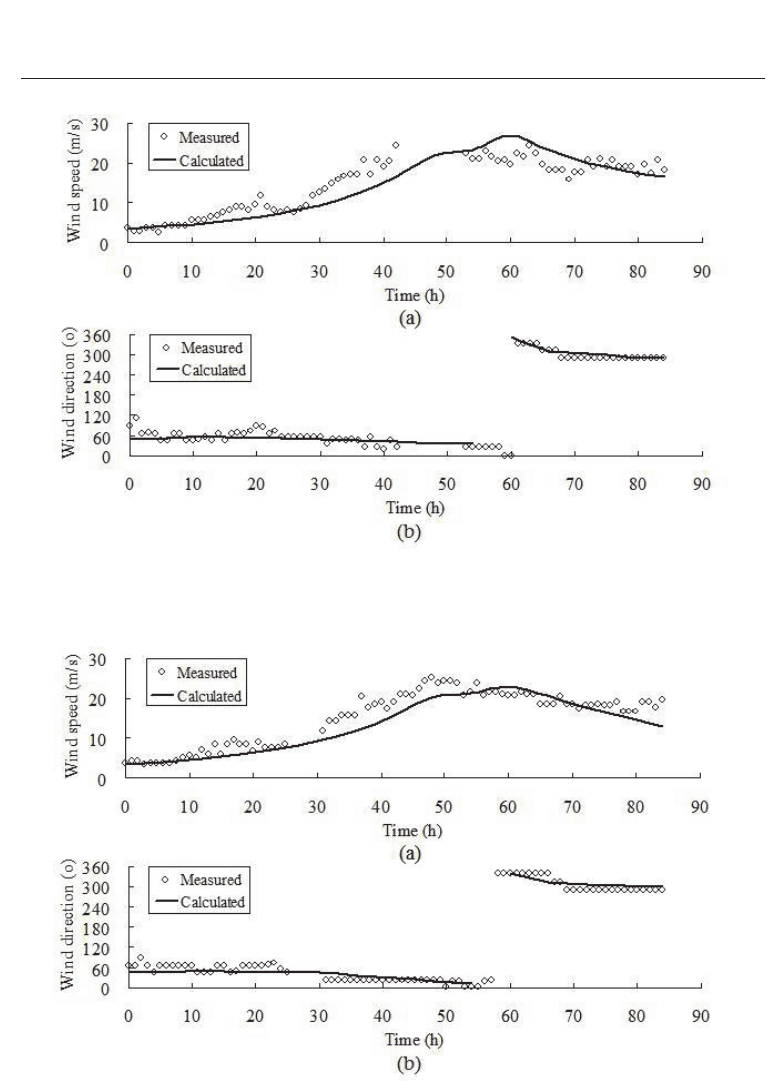
4.2.1 Wind field
Figures 13 and 14 show the comparisons of calculated and measured wind fields at Daji station
and Tanxu station during Typhoon Agnes, in which the starting times of x-coordinate are both
at 18:00 of 29/08/1981 (Beijing Mean Time). In general, the predicted wind directions agree
fairly well with the available measurement. However, it can be seen that calculated wind
speeds at these two stations are obviously smaller than observations in the early stage of
cyclonic development and then slightly higher than observations in later development. The
averaged differences between calculated and observed wind speeds are 2.6 m/s at Daji station
and 2.1 m/s at Tanxu station during Typhoon Agnes. This discrepancy in wind speed is due
to that the symmetrical cyclonic model applied does not reflect the asymmetrical shape of
near-shore typhoon.
4.2.2 Storm surge
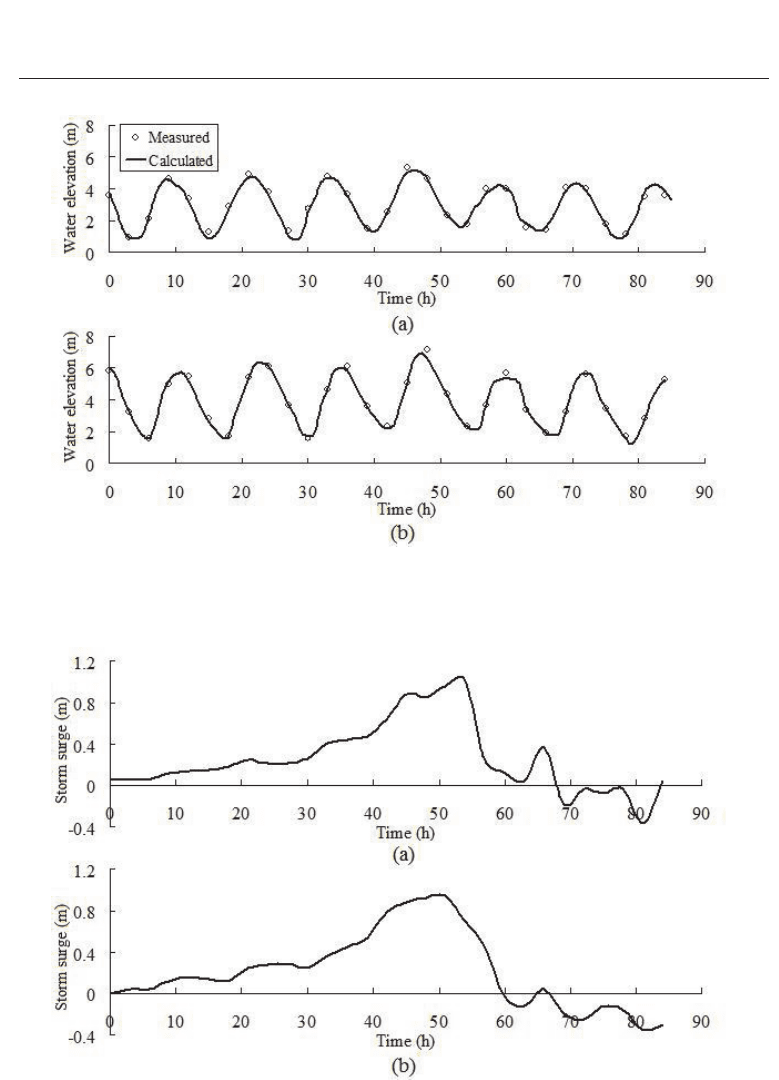
Figure 15 displays the comparison of simulated and measured tidal elevations at Daji station
and Tanxu station, in which the starting times of x-coordinate are both at 18:00 on 29/08/1981
(Beijing Mean Time). It can be seen from Figure 15 that simulated tidal elevation of high
tide is slightly smaller than measurement, which can be directly related to the discrepancy of
calculated wind field (shown in Figures 13 and 14). A series of time-dependent surge setup,
the difference of tidal elevations in the storm surge modeling and those in purely astronomical
tide simulation, are used to represent the impact of typhoon-generated storm. Figure 16
having a same starting time in x-coordinate displays simulated surge setup in Daji station
and Tanxu station. There is a similar trend in surge setup development at these two stations.
The surge setup steadily increases in the early stage (0-50 hour) of typhoon development, and
then it reaches a peak (about 1.0 m higher than astronomical tide) on 52nd hour (at 22:00
on 31/08/1981). The surge setup quickly decreases when the wind direction changes from
north-east to north-west after 54 hour. In general, the north-east wind pushing water into the
Hangzhou Bay significantly leads to higher tidal elevation, and the north-west wind dragging
water out of the Hangzhou Bay clearly results in lower tidal elevation. The results indicate
that the typhoon-induced external forcing, especially wind stress, has a significant impact on
the local hydrodynamics.
192
Hydrodynamics – Natural Water Bodies
Astronomical Tide and Typhoon-Induced Storm Surge in Hangzhou Bay, China 15
Fig. 11. Comparison of the computed and measured spring current velocities at different
depths at station H1.
−:computed;◦:measured
193
Astronomical Tide and Typhoon-Induced Storm Surge in Hangzhou Bay, China
16 Will-be-set-by-IN-TECH
Fig. 12. Comparison of the computed and measured spring current velocities at different
depths at station H4.
−:computed;◦:measured
194
Hydrodynamics – Natural Water Bodies
Astronomical Tide and Typhoon-Induced Storm Surge in Hangzhou Bay, China 17
Fig. 13. Comparison of calculated and measured wind fields at Daji station during Typhoon
Agnes. (a): wind speed; (b): wind direction. Starting time 0 is at 18:00 of 29/08/1981
Fig. 14. Comparison of calculated and measured wind fields at Tanxu station during Typhoon
Agnes. (a): wind speed; (b): wind direction. Starting time 0 is at 18:00 of 29/08/1981
195
Astronomical Tide and Typhoon-Induced Storm Surge in Hangzhou Bay, China
18 Will-be-set-by-IN-TECH
Fig. 15. Comparison of calculated and measured water elevations during Typhoon Agnes.
(a): Daji station; (b): Tanxu station. Starting time 0 is at 18:00 of 29/08/1981
Fig. 16. The simulated surge setup at two stations during Typhoon Agnes. (a) Daji station; (b)
Tanxu station. Starting time 0 is at 18:00 of 29/08/1981
196
Hydrodynamics – Natural Water Bodies