Salcido A. (ed.) Cellular Automata - Simplicity Behind Complexity
Подождите немного. Документ загружается.

0.0
0.2
0.4
0.6
0.8
1.0
0.0 0.2 0.4 0.6 0.8 1.0
φ
1
t+1
φ
1
t
r>3
1 <r<3
r<1/3
(a)
1
10
10
2
0.0 0.2 0.4 0.6 0.8 1.0
t
r
φ
1
t=0
(b)
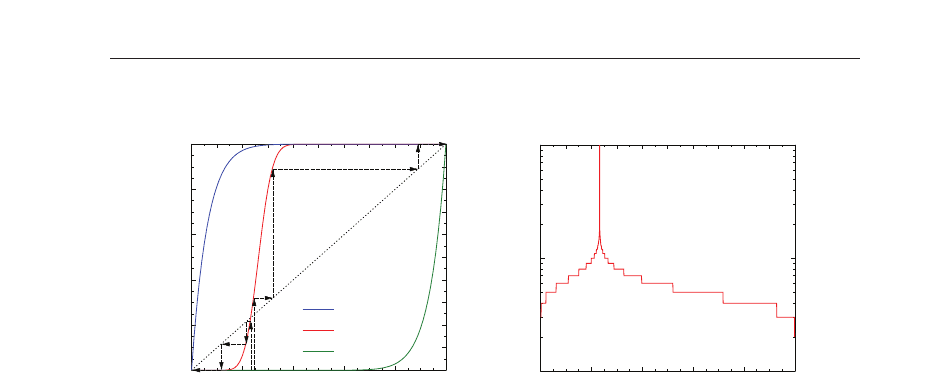
Fig. 3. (a) The function φ
1
t
+1
(φ
1
t
) for a square lattice of agents where the number of
interacting partners is fixed n
= 4 for all agents. Three curves are presented which are typical
for the corresponding ranges of the cost factor r. For the red curve obtained for r
= 1.4
iterations of Eq. (15) are presented starting from two different initial conditions φ
1
0
= 0.23
and φ
1
0
= 0.25. Following the dashed lines it can be observed that the system evolves into
homogeneous final states. Note that the closer we start to the fix point, the longer it takes for
the system to reach the final homogeneous state represented by the two stable fixed points.
(b) The relaxation time t
r
as a function of the initial fraction φ
1
t
=0
. Approaching the unstable
fixed point φ
1
c3
= 0.232 the relaxation time t
r
diverges.
Analytical and numerical calculations showed that for r
< 1/3 the first fixed point is
stable while the other one is unstable. The result implies that the success of the lower level
technology is guaranteed in the system since the range of attraction of the stable fixed point
φ
1
c1
= 0 is the interval φ
1
0
∈ [ 0, 1). In this range of the cost factor r the system always converges
to the homogeneous state φ
1
t
= 0, i.e. the higher level technology disappears from the system
irrespective of the initial fractions except for the case φ
1
0
= 1. For r > 3 the fixed points are the
same given by Eq. (16), however, their stability features change, namely, φ
1
c1
= 1 is stable with
the range of attraction φ
1
0
∈ (0, 1]. This implies again the convergence to a homogeneous final
state where now the lower level technology completely disappears and the system experiences
technological progress.
It is very interesting to note that for the parameter ranges 1/3
< r < 1and1 < r < 3
the system has three fixed points: two fixed points characterize the homogeneous final states
given by Eq. (16) as discussed above, however, they are both stable in these ranges of r.The
third fixed point φ
1
c3
can be determined from the iteration equation by considering
φ
1
t
=0
= φ
1
t
=0
+ p
0→1
0
(1 − φ
1
t
=0
) − p
1→0
0
φ
1
t
=0
. (17)
Rearranging Eq. (17) leads to
p
0→1
0
(1 − φ
1
t
=0
)=p
1→0
0
φ
1
t
=0
(18)
347
Cellular Automata Modelling of the Diffusion of Innovations

and since p
0→1
0
= 1 − p
1→0
0
holds, it follows that
p
0→1
0
(1 − φ
1
t
=0
)=(1 − p
0→1
0
)φ
1
t
=0
, (19)
which then yields
p
0→1
0
= φ
1
t
=0
. (20)
The final expression Eq. (20) implies that the fractions of the two technological levels will keep
unchanged during the whole time evolution of the system if the probability that an agent with
technological level τ
0
= 0 changes to technological level τ
1
= 1 equals to the initial fraction
of agents of technological level τ
1
= 1. The numerical solution of Eq. (20) gives the third fixed
point φ
1
c3
= 0.768 and φ
1
c3
= 0.232 for 1/3 < r < 1and1< r < 3, respectively. The third fixed
point proved to be unstable, i.e. the state characterized by φ
1
c3
is only attained by the system if
the initial condition is set as φ
1
t
=0
= φ
1
c3
. From any other initial state the system converges to
one of the two stable fixed points where only one of the technologies survives.
The iterations of the dynamic equation Eq. (15) are illustrated in Fig. 3(a) for two different
initial values of φ
1
t
=0
with the cost parameter r = 1.4 assuming that all agents have 4
interacting partners. The third fixed point φ
1
c3
can be identified as the intersection of the curve
of φ
1
t
+1
(φ
1
t
) and of the straight line with slope 1. It can be observed that iterations starting on
the left side of the fixed point φ
1
0
< φ
1
c3
always converge to the final state of φ
1
t
= 0leadingto
disappearance of the corresponding technology. However, iterations starting at a high enough
initial fraction φ
1
0
> φ
1
c3
lead to the final dominance of the higher level technology φ
1
t
= 1. The
results demonstrate that the two fixed points φ
1
c1
= 0andφ
1
c2
= 1 are stable and their ranges
of attraction are the intervals
[0, φ
1
c3
) and (φ
1
c3
,1], respectively.
A very important outcome of the master equation analysis is that starting from a random
configuration of two competing technologies the dynamics of the system leads to a
homogeneous final state where only one of the technologies survives. However, depending
on the value of the starting fractions of technologies the evolution process can even take
a very long time. Figure 3(b) presents the relaxation time t
r
, i.e. the time needed to reach
the homogeneous final state as a function of the initial fraction φ
1
t
=0
. It can be observed that
approaching the third fixed point the relaxation time t
r
diverges t
r
→ ∞, which demonstrates
that the inhomogeneous state of competing technologies can have a very long lifetime. This
feature of the model describes the natural phenomenon that the competition of products on
the market is much more tense and takes longer if the presence of products is balanced. The
initial fraction can be controlled by the advertising activities of the producers.
It is a very interesting question to investigate how the complex topology of social contacts
affects the spreading of technologies. Complex networks of agents generated by the
Watts-Strogats method can be captured in the framework of the master equation approach
by inserting the degree distribution Eq. (5) into the generic expression of the transition
probabilities Eq. (12). In Figure 4 we present the value of the unstable fixed point φ
1
c3
in the
range of the cost factor 1
< r < 3 varying the rewiring probability p of the network in the
interval
[0, 1]. The rewiring method was applied to a square lattice so that in the figure p = 0
represents the regular square lattice, while in the limit p
→ 1 a random graph is obtained. It
can be observed that for p
= 0 the value of the fixed point does not depend on r in the range
considered (see also the above analysis). However, as the rewiring probability increases, i.e.
as the degree distribution gets broader, two important changes appear: φ
1
c3
has a continuous
dependence on the value of p, and the interval of r splits up into s everal sub-intervals inside
348
Cellular Automata - Simplicity Behind Complexity
1
1.5
2
2.5
0
0.2
0.4
0.6
0.8
1
0
0.05
0.1
0.15
0.2
0.25
0.3
0.35
r
p
φ
c
4/3
5/4
5/3
2
3/2
7/3
1
0.8
0.6
0.2
0
0.4
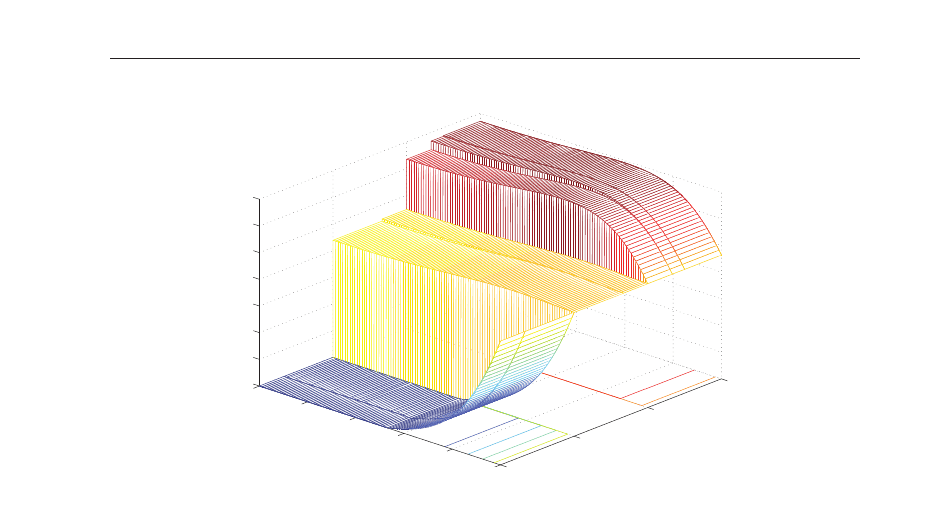
Fig. 4. The unstable fixed point of the system φ
1
c3
as a function of the rewiring probability p in
the range of the cost factor 1
< r < 3. The polidispersity of the number of connections makes
the system more sensitive to advantages provided by more advanced technologies. The
numbers on the surface plot provide the interval limits of r inside which φ
1
c3
is constant.
which φ
1
c3
has different values. This simple master equation analysis demonstrates that the
topology of social contacts may have a strong effect on the spreading process of technologies
in social systems. More details on the effect of the underlying social network will be revealed
by cellular automata simulations in the next section.
5. Cellular automata simulations
To be able to carry out analytical investigations of the model system in the previous section,
serious simplifications had to be applied. The advantage of the approach is that interesting
characteristic quantities could be obtained in closed analytic forms, important global features
could be revealed, however, the results are limited either by the range of interaction,
simplified topology of social contacts, bimodal distribution of initial technological levels, or
by neglecting any spatial correlation (clusterization) of agents according to their technological
levels. In order to analyze the time evolution and spatial structure of the model system in its
entire complexity, we perform computer simulations using cellular automata techniques. As
a first case we consider a set of agents organized on a square lattice of size L
× L with nearest
neighbor interactions. Initially agents have randomly distributed technological levels between
0and1withuniformdistribution
p
0
(τ)=1, and P
0
(τ)=τ, for 0 ≤ τ ≤ 1. (21)
In our simulations we assume periodic boundary conditions, thus all agents of the lattice have
four interacting partners. The rejection-adaptation dynamics based on the cost minimization
349
Cellular Automata Modelling of the Diffusion of Innovations
0.5
0.9
0.8
0.6
0.8
0.7
0.5
0.9
0.8
0.6
a=2
2
a=1
1
0.5
0.9
0.8
0.6
0.5
0.9
0.8
0.6
0.5
0.6
0.5
0.9
0.8
0.6
0.8
0.5
0.9
0.8
0.6
0.9
C=1.1
C=0.7
C=0.8
C=1.6
a)
b)
c)
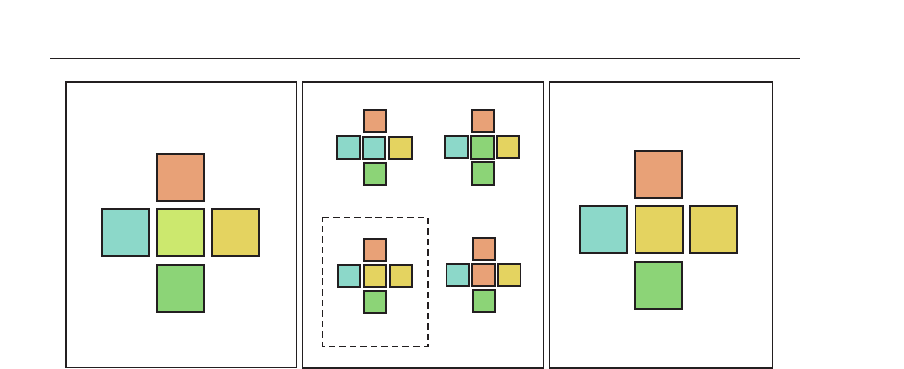
Fig. 5. Illustration of the update rule of cellular automata. (a) presents the current
configuration of an agent with its 4 interacting partners. The value of the technological level
τ and of the two cost factors a
1
and a
2
are given. (b ) demonstrates that the agent in the
middle has 4 possibilities to copy the technology of one of its social partners. The agent will
choose the one which provides the lowest cost C
= 0.7. (c) The final configuration after
decision making. The color of the squares represents the technological level which also
corresponds to the color code of Fig. 1.
results in a non-trivial time evolution of the system which is followed by computer
simulations treating the system locally as a cellular automaton. In the simulations parallel
update is used, i.e. all agents try to minimize their costs in each time step assuming that their
interacting partners keep fixed. This parallel dynamics is one of the sources of the complex
behavior of the system.
If at time t the technological level of agent i which has n neighbors with technological levels
τ
1
, τ
2
,...,τ
n
is τ, the CA rule to get its technological level in time t + 1readsas
τ
t+1
i
= τ
j
, (22)
where j denotes the neighboring agent whose technological level is the most worthy to copy
for agent i,i.e.
C
(i, j)=min {C
(i,1), C
(i,2),...,C
(i, n)}, (23)
where C
(i, j) is the cost of agent i assuming that its technological level has been replaced with
the technological level of neighbor j. The update rule of our cellular automata is illustrated in
Fig. 5 on a square lattice. Snapshots of the cellular automata time evolution of the evolving
system are presented in Fig. 6 for a square lattice of size L
= 100.
Applying the analytical results of Eq. (9) and Eq. (10) for the specific case of n
= 4, the agents
will always copy the first, second, third or fourth highest τ of their local interacting partners
when the value of the parameter r falls in the intervals 0
< r < 1/3, 1/3 < r < 1, 1 < r < 3,
3
< r, respectively. (Note that the behavior of the system is symmetric with respect to r =
1.) Since the dynamics of the system governed by the cost minimization mechanism favors
local communities to have products of the same technological level, the agents tend to form
clusters with equal τ at any value of r . A very interesting special case is r
= 1.0, when being
more advanced than the surroundings does not provide any advantages, it can be seen in
350
Cellular Automata - Simplicity Behind Complexity
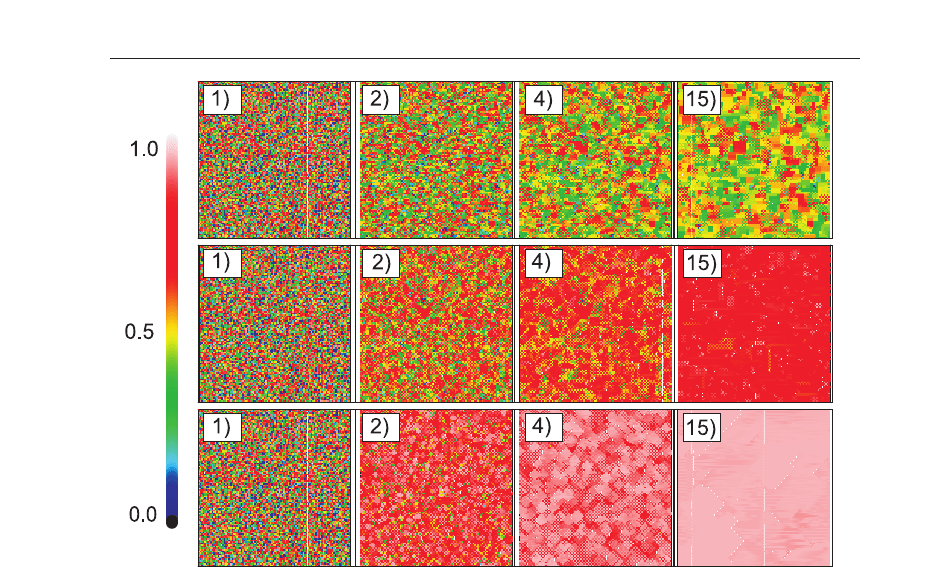
Fig. 6. Snapshots of CA simulations of the model on a square lattice of size L = 100 for
different values of the cost factor: r
= 1 (top), r = 2 (middle),andr = 4 (bottom).Thecolor
code represents the actual technological level of the agents. The numbers indicate the time
step in which the snapshot was taken.
Fig. 6(top row) that the system evolves into a frozen cluster structure. The technological level
τ of these clusters covers practically the entire available range, i.e. the
[0, 1] interval, with a
non-trivial distribution. The clustering implies that communities of low level technologies can
survive in the presence of highly advanced ones (see Fig. 6(top)). At 1
< r < 3, where more
advanced technologies are favored by the agents (locally the second largest τ), the cellular
automata simulation of the system converges into an almost completely homogeneous state
of a relatively high technological level (see Fig. 6(middle) where the specific case of r
= 2is
plotted). In the simulations, initially clusters of agents with identical τ grow and finally the
entire system evolves into a homogeneous state with all agents adopting the same technology.
Since locally the agents choose the second highest τ to adopt, both very low and very high
level technologies disappear during the evolution. The colors also illustrate that the limiting
value of τ adopted by almost all agents is smaller than the highest available value τ
max
= 1,
namely, it falls between 0.8 and 1. It follows from Eq. (10) that to reach the most advanced
technologies, r has to surpass the threshold value r
= 3 in the case of constant n = 4number
of neighbors. This regime is illustrated in Fig. 6(bottom) for the specific case of r
= 4, where the
light color in the last snapshots indicates that the most advanced technology τ
max
= 1spraw
onto the entire lattice.
351
Cellular Automata Modelling of the Diffusion of Innovations
5.1 Distribution of technological levels in cellular automata – extreme order statistics
In order to give a quantitative characterization of the time evolution of the cellular automata
on a square lattice, we determined the distribution p
t
(τ) of technological levels τ,andthe
mean
τ
t
of technological levels at different times t
τ
t
=
1
N
N
∑
i=1
τ
t
i
, (24)
where N denotes the total number of agents.
b) c)a)
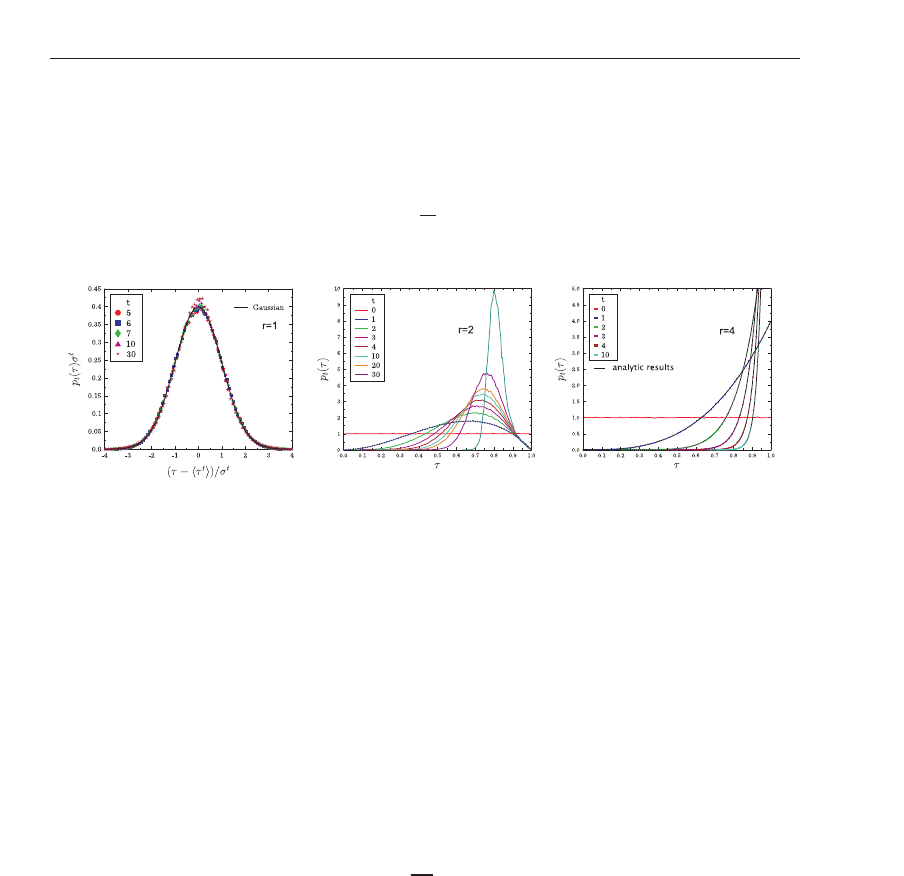
Fig. 7. Probability distribution of technological levels p(τ) obtained at different time values
for three different values of the cost factor r.
(a) For the case of r = 1 the rescaled plot of the
distributions is presented, i.e. the distributions obtained at different times are rescaled by the
mean
τ
t
and by the standard deviation σ
t
of the distributions. The master curve obtained
perfectly agrees with the standard Gaussian.
(b) For r = 2 when the second largest
technological level is favored locally by agents, the distributions converge to a highly peaked
functional form.
(c) In the range r > 3 agents always select the most advanced technology,
hence, the distributions can be very well described by extreme order statistics represented by
the continuous lines.
Figure 7
(a) shows that for r = 1, when higher level technologies do not provide advantages
for agents, the distribution p
t
(τ) rapidly attains a Gaussian shape. In order to demonstrate
the validity of the Gaussian form, we present the rescaled distributions in the figure: the
distributions obtained at different times are rescaled by the average technological level
τ
t
of the corresponding state and by the standard deviation of the distribution σ
t
so that p
t
(τ)σ
t
is plotted as a function of (τ −
τ
t
)/σ
t
. The high quality data collapse that can be seen in Fig.
7
(a) and the good quality fit with the standard Gaussian
g
(x)=1/
√
2πex p(−x
2
/2) (25)
demonstrate the validity of the Gaussian description of the evolution of the cellular automata.
The convergence to the Gaussian is very fast. In our test simulations after 30
− 40 iteration
steps the system completely forgot its initial uniform state and p
t
attained the Gaussian limit
distribution. This form implies that the fraction of agents having very high and very low
level technologies both decrease and agents tend to copy technologies in the vicinity of the
distribution mean. Consequently, the system does not have any technological progress, the
average technological level remains nearly constant d uring the time evolution, and
τ
t
→
0.5.
For the cost factor r
> 1 agents locally prefer to adopt higher level technologies, namely, the
highest or the second highest τ value of the neighborhood will be adopted on the square lattice
352
Cellular Automata - Simplicity Behind Complexity
depending on the exact value of r. These local changes imply that the cellular automata rule
Eq. (23) gives rise to a more complex time evolution involving also extreme order statistics.
For 1
< r < 3 all the agents adopt the second highest available technology; hence, in a large
enough system the distribution of technological levels right after the first iteration step p
t
(τ)
can be described as the k = 3 rank extreme distribution Φ
k
M
of M = 4 variables which are
all sampled from a uniform distribution. In general, the probability density function Φ
k
M
(x)
of choosing the kth largest value among M realizations of the random variable x which has a
probability density p
(x) and a distribution function P(x) can be cast into the form
Φ
k
M
(x)=
M!
(k −1)!(M − 1)!
P
(x)
k−1
(1 − P(x))
M −k
p(x). (26)
It can be seen in Fig. 7
(b) that by substituting the initial uniform distribution Eq. (21) into Eq.
(26) with the parameter setting M
= 4andk = 3, a perfect agreement is obtained between
our analytical predictions Φ
3
4
and p
1
(τ) obtained from CA simulations. Unfortunately, at
higher iteration steps the distributions p
t
do not follow the functional form Eq. (26) when
we substitute Φ
k
M
and the corresponding distribution function recursively on the right-hand
side. The reason is the overlap of the local neighborhoods of the lattice sites which modifies
the statistics of technological levels. By increasing the number of iterations, p
t
gets narrower
and converges to a sharply peaked function as the final homogeneous state is approached (see
Fig. 7
(b) and Fig. 6). Consequently, the average value of the technological levels increases and
converges to a limit value which is lower than the available maximum τ
max
= 1. It has to be
emphasized that under this parameter settings the system exhibits considerable technological
progress due to the disappearance of low level technologies and to the proliferation of the
more advanced ones.
In the extreme case when the control parameter r becomes larger than 3, more advanced
technologies provide so much benefit that it is always advantageous for agents to adopt the
highest available technological level in the local neighborhood. Thus, p
t
(τ) rapidly converges
to a sharply peaked form the position of which approaches τ
max
= 1 through extreme
order distributions (see Fig. 7 c). It is interesting to note that contrary to the previous case
of 1
< r < 3, in this regime r > 3thedistributionp
t
can be described by the extreme order
density function Φ
k
M
Eq. (26) with k = M at any time t by taking into account that the size of
the neighborhood M increases as a function of time t. We found a recursive formula for the
time dependence of the parameter M
M
t+1
= M
1
+ 5 + 2(t −1),with M
1
= 4, (27)
which shows how information spreads in the system. The lines in Fig. 7
(c) demonstrate
the excellent agreement of the above analytic prediction with the numerically obtained
distribution functions. Note that due to the symmetry of the system with respect to the
parameter value r
= 1, the same holds also for r < 1/3 with Φ
1
M
, where the smallest value
(k = 1) of M
t
variables given by Eq. (27) is selected. These results imply that the average
technological level in these regimes can easily be obtained analytically, i.e. the average of the
largest and of the smallest value of M
t
variables with uniform distribution can be cast into the
form
τ
max
=
M
t
M
t
+ 1
,
τ
min
=
1
M
t
+ 1
. (28)
Substituting the recursive formula of M
t
into Eq. (28) a perfect agreement is obtained with the
numerical results of
τ
t
Kun et al. (2007).
353
Cellular Automata Modelling of the Diffusion of Innovations
6. Agents on complex networks
The success or failure of newly introduced technologies on the market can also depend on
the complexity of social contacts of users. This is especially valid for so-called networking
technologies where the practical value of the technology for an agent depends on the number
of social partners which already use the technology. Telecommunication technologies we are
also focusing on are prototypical examples where the topology of social contacts may play a
crucial role Mahajan & Peterson (1985); Rogers (1962).
0.0 0.5 1.0 1.5 2.0 2.5 3.0
0.0
0.2
0.4
0.6
0.8
1.0
r
τ
p=0
p=0.02
p=0.05
p=0.07
p=0.2
p=0.5
p=0.7
meanfield
(a)
0.0 0.2 0.4 0.6 0.8 1.0
0.65
0.7
0.75
0.8
0.85
0.9
0.95
p
τ
r=1.4
r=1.7
r=2.4
(b)
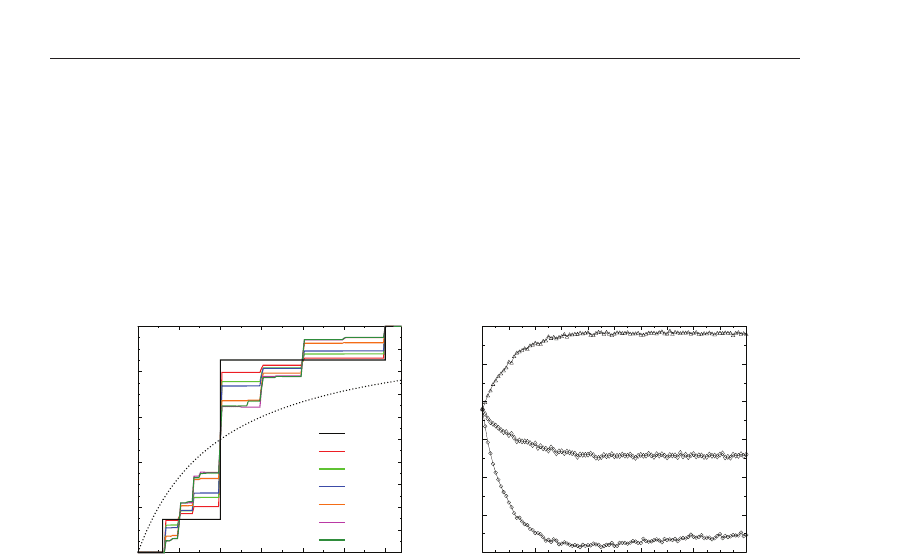
Fig. 8. (a) Average technological level
τ
of the system obtained after long time evolution as
afunctionofr for several different values of the rewiring probability p.
(b)
τ
as a function
of the rewiring probability p for three specific values of r. The presence of long range
connections can increase and even decrease the average technological level of the system
depending on the cost factor r.
In order to have a more quantitative understanding of this phenomenon in the framework
of our model, we implemented cellular automata simulations on a complex network of
agents obtained by the Watts-Strogatz method varying the value of the rewiring probability p
between 0 and 1 (see Section 3.3). The complexity of the underlying social network of agents
introduces two important features:
(i) as the rewiring probability p increases, more and more
connections are established between remote agents introducing long range correlations in the
system and reducing the “diameter” of the network.
(ii) The probability distribution of the
number of connections, i.e. the degree distribution of agents gets broader so that the number
of connections can span from 1 to high values. One of the outcomes of the master equation
approach was that the scatter of the degree makes the system more sensitive to the advantages
technologies provide so in CA simulations more interesting details can be expected.
To go beyond the limitations of the analytic approaches we carried out cellular automata
simulations on different topologies to determine the average technological level
τ
in the final
state of the time evolution when a frozen configuration is attained. The average technological
level of the final state
τ
is presented in Fig. 8 (a) as a function of r for several different
values of the rewiring probability p. Note that the average technological level
τ
(
r) is a
354
Cellular Automata - Simplicity Behind Complexity

monotonically increasing function of r for any value of the rewiring probability p. The plotted
functions are composed of distinct steps whose height and number are sensitive to the details
of the network topology. The steps are the consequence of the behavior described by Eq. (9),
i.e. the steps mark the interval borders for different degrees: e.g. for agents of n
= 4social
contacts we have 4 intervals – taking also into account the symmetric cases of r
< 1and
1
< r < 3 as well (see Eq. (9)) – which result in 3 steps. Increasing the rewiring probability p,
the degree distribution ρ
(n) gets broader giving rise to an increase in the number of different
degrees in the network which then results in a higher number of steps of
τ
(
r). It can be seen
in the degree distribution of a rewired lattice of rewiring probability p
= 0.05 in Fig. 2(b) that
in this case the possible degrees of the network are n
= 2, 3,4, 5, 6. Using Eqs. (9) and (10) one
can determine the interval limits of r for each n value, from which the overall r limits of the
entire networkcan be obtained as 1/5,1/4,1/3,1/2,2/3,1,3/2,2,3,4,5. For comparison,in
Fig. 8
(a) we also present the mean field solution Eq. (6) of the model obtained analytically for
the fully connected case, when all agents are connected with all others.
A very important outcome of the above calculations is that the degree polydispersityof agents’
social contacts makes the socio-economic system more sensitive to the details of the novel
technology, i.e. to the specific value of the cost factor r. It can be observed in Fig. 8
(a) that
increasing the connectivity of the system, the presence of long range connections can increase
but can also decrease the average technological level attained in the final state depending on
the value of the cost factor r. For high enough cost factor r the long range contacts facilitate
the spreading of advanced technologies, while for lower r values the opposite effect occur s, i.e.
the dominance of low level technologies enhanced also by the long range contacts prevents
technological advancement. Figure 8
(b) provides some quantitative insight into this effect,
where we present
τ
as a function of the rewiring probability p for three different values of r.
All the curves start from the same point at p
= 0, since on a regular square lattice always the
third highest technology is selected when r falls in the interval 1
< r < 3. For increasing p the
curves converge to r dependent asymptotic values which can be both lower and higher than
the one at p
= 0.
7. Discussion
In this chapter we presented an agent based model of the spreading of technological
advancements, where the technology is used for the interaction/communication of agents.
The model realizes a bottom-up approach to socio-economic systems which is especially
designed for a cellular automata reprezentation. Agents/cells of the model can represent
individuals or firms which use different level technologies to collaborate with each other.
Costs arise due to the incompatibility of technological levels measuring the degree of
difficulties in the usage of technologies. Agents can reduce their costs by adopting the
technologies of their interacting partners. We showed by analytic calculations and computer
simulations that the local adaptation-rejection mechanism of technologies results in a
complex time evolution accompanied by microscopic rearrangements of technologies with
the possibility of technological progress on the macro-level.
As a first step, simplified configurations of the model system were analyzed by analytical
calculations: A mean field approach was considered where each agent communicates with
all other agents. As to the next a master equation was derived which describes the discrete
time evolution of the system assuming no spatial correlation, i.e. no clustering of agents
according to their technological level. Already these simplified approaches revealed that the
355
Cellular Automata Modelling of the Diffusion of Innovations

rejection-adoption rule of our cellular automata leads to a homogeneous final state whose
stability depends on the relative amount of advantages technologies provide for the users.
These results also reflected the phenomenon that competition in the market takes much longer
and it can be much more violent if the actors of the competition start from a nearly balanced
initial scenario.
The analysis of the model system in its entire complexity was carried out by cellular
automata simulations performed on a square lattice and on complex network topologies
of social contacts. Computer simulations revealed that agents tend to form clusters of
equal technological levels. If higher level technologies provide advantages for agents, the
system evolves to a homogeneous state but clusters show a power law size distribution for
intermediate times. The redistribution of technological levels involves extreme order statistics
leading to an overall technological progress of the system. We also demonstrated that the
topology of agents’ social contacts plays a crucial role in the spreading process leading to a
broad spectrum of novel behaviors. Analytical calculations and computer simulations showed
that long range connections on the social network can facilitate but it can also hinder the
diffusion of the advanced technology depending on the amount of advantages more advanced
technologies provide with respect to the low level ones.
Our model emphasizes the importance of copying in the spreading of technological
achievements and considers one of the simplest possible dynamical rule for the decision
mechanism. In the model calculations no innovation was considered, i.e., agents could
not improve their technological level by locally developing a new technology instead of
only taking over the technology of others. Compared to opinion spreading models like the
Sznajd-model Sznajd-Weron (2005); Sznajd-Weron & Sznajd (2000); Sznajd-Weron & Weron
(2002) and its variants A.T. Bernardes (2002); Stauffer (2002a;b), the main difference is that
in our case the technological level of agents is a continuous random variable; furthermore,
the decision making is not a simple majority rule but involves a minimization procedure.
Opinion of individuals can also be represented by a continuous real variable which makes
possible to study under which conditions consensus, polarization or fragmentation of the
system can occur. Such models show more similarities to our spreading model of technologies
Gandica et al. (2010); Gilbert (2008); Hegselmann & Krause (2002). It is interesting to note
that our model captures some of the key aspects of the spreading of telecommunication
technologies, where for instance mobile phones of different technological levels are used by
agents to communicate/interact with each other. In this case, for example, the incompatibility
of MMS-capable mobile phones with the older SMS ones may motivate the owner to reject or
adopt the dominating technology in his social neighborhood by taking into account the offers
of provider companies of the interacting partners.
8. Acknowledgment
The work is supported by TÁMOP 4.2.1-08/1-2008-003 project. The project is implemented
through the New Hungary Development Plan, co-financed by the European Social Fund and
the European Regional Development Fund. F. Kun acknowledges the Bolyai Janos fellowship
of the Hungarian Academy of Sciences. The authors are grateful for the generous support of
Toyota Central R&D Labs., Aichi, Japan.
356
Cellular Automata - Simplicity Behind Complexity