Salcido A. (ed.) Cellular Automata - Simplicity Behind Complexity
Подождите немного. Документ загружается.

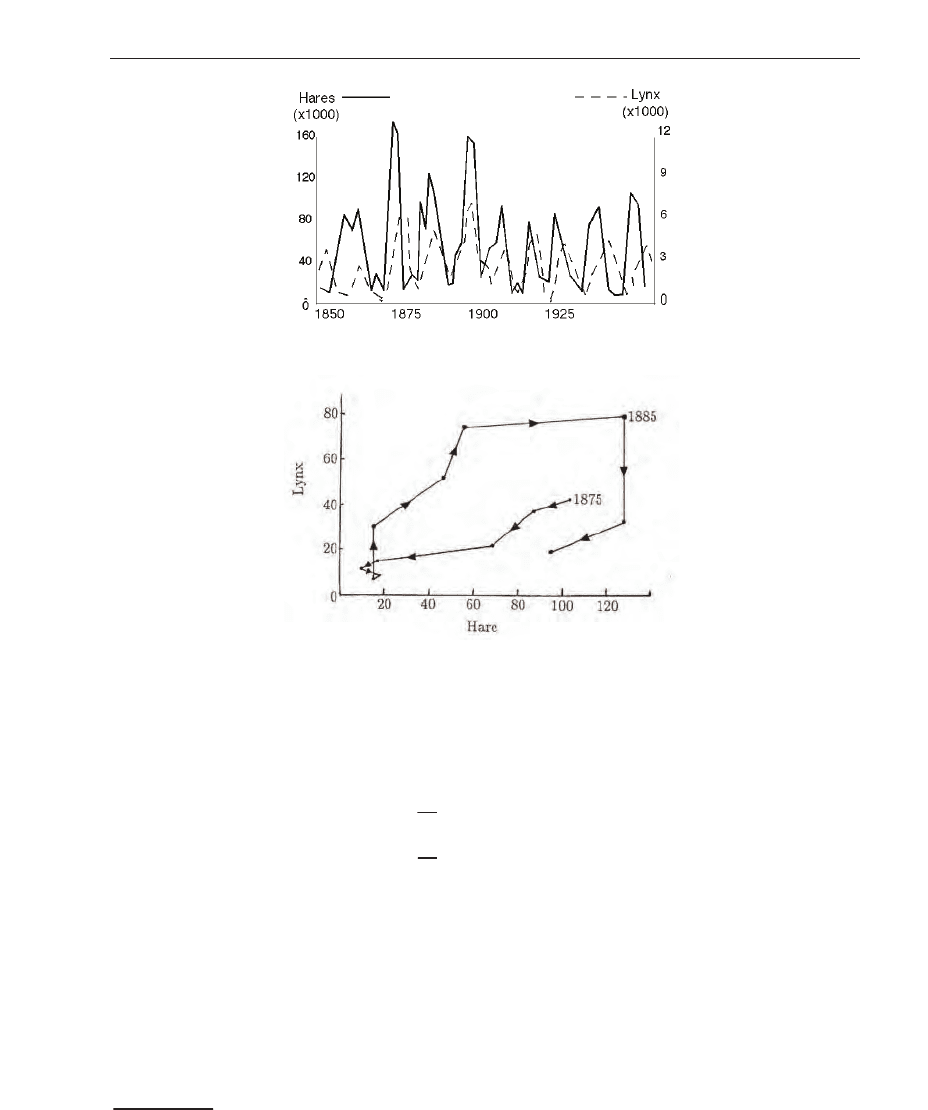
Fig. 1. Hares and lynxes population as a function of time (Renning, 1999-2000).
Fig. 2. Detail of the phase plane plot of the data presented in Fig.1 (Murray, 1990).
hare cycle while Stenseth et al. (1999) observed that lynx population dynamics are consistent
with a regional structure caused by climatic features.
In order to formulate the interaction between preys and predators, a deterministic model (that
became a classic model) was used
2
. It is given by the differential equations system:
dx
dt
= ax − αxy
dy
dt
= −by + βxy (1)
In this model, the state variables x and y are, respectively, the number of preys and predators
in each instant t. The parameters are:
• a: preys relative growth rate;
• α: predation rate (probability of a predator to kill the prey in each time they encounter);
• b predators mortality rate in the absence of preys;
• β preys conversion rate into predators.
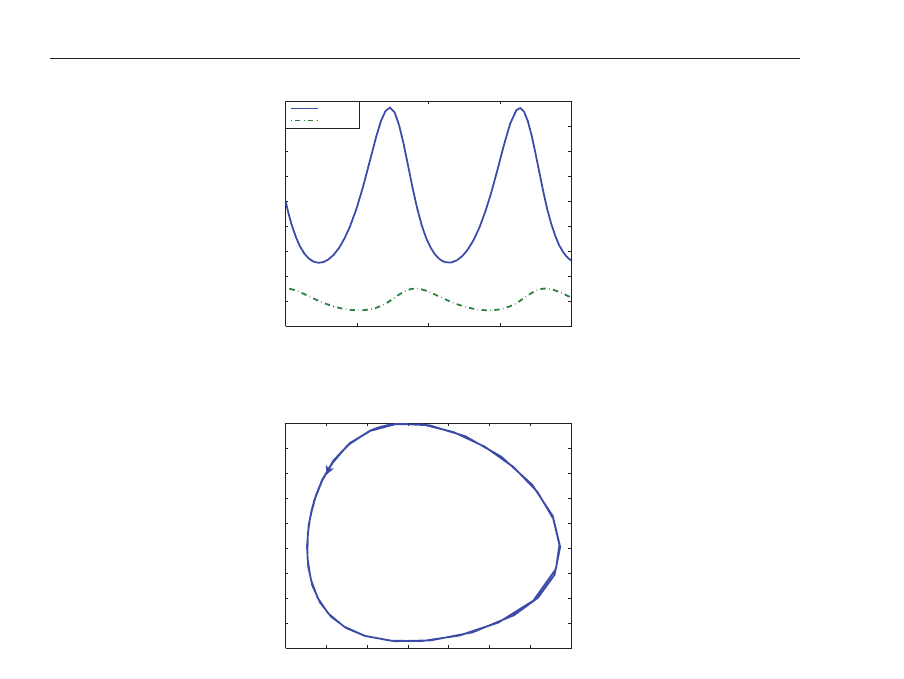
Solving the differential equations with the parameters a
= 0.1, α = 0.01, b = 0.05 and β =
0.001, we obtain the graph of the Fig. 3 and the phase plane, Fig. 4.
2
See Wangersky (1978) for a review on Lotka-Volterra population models.
107
Studies on Population Dynamics Using Cellular Automata
0 50 100 150 200
0
10
20
30
40
50
60
70
80
90
time (t)
population
prey
predator
Fig. 3. Solution of the differential equation system.
20 30 40 50 60 70 80 90
6
7
8
9
10
11
12
13
14
15
prey (x)
predador ( y)
Fig. 4. Phase plane.
Since the classical model ignores spatial correlations it does not take into account important
effects that spatial inhomogeneity may cause on the dynamics of the system. Moreover in such
a model we do not have any information about the spatial distribution of the populations.
2.3 Description of the cellular automata simulation
The following five parameters need to be chosen to set up a simulation: 1. number of fish;
2. number of sharks; 3. fish reproductive age; 4. sharks reproductive age; 5. sharks starvation
period. The initial number of sharks and fish as their respective ages are randomly distributed
in a rectangular grid whose opposite sides are identified in pairs. The cells states in the grid are
updated according to the local dynamics rules of each cell. For instance, in a 40x40 cell grid,
300 fish and 10 sharks are placed at random positions. All fish and sharks have a reproductive
age, i.e., 3 and 10 iterations respectively and sharks starvation period is 3.
2.3.1 Behavior of fish in Wa-Tor
Each fish chooses a free place in its neighborhood, moves and ages there (if all places are
occupied, then it remains where it is and ages). When it achieves the reproductive age, it
leaves behind a single offspring. They move according to a randomly assigned integer that
indicates a direction. More specifically, depending on whether the value of the integer is equal
108
Cellular Automata - Simplicity Behind Complexity
to 1, 2, 3, 4, 5, 6, 7 or 8, they move north, east, south, west, northeast, northwest, southeast or
southwest (Silva & Jafelice, 2010), in the grid, respectively.
2.3.2 Behavior of sharks in Wa-Tor
First, each shark searches for fish in its neighborhood. If there are fish, the shark randomly
chooses one, catches it and the variable (starve variable) is set to zero. It goes to the cell
of the eaten fish and might propagate if the occasion arises. If it does not find any fish in
its neighborhood, it moves like a fish and the starve variable is increased by 1. When the
starve variable reaches its maximum (sharks starvation period) the shark dies. Also, sharks
reproduction is similar to the fish.
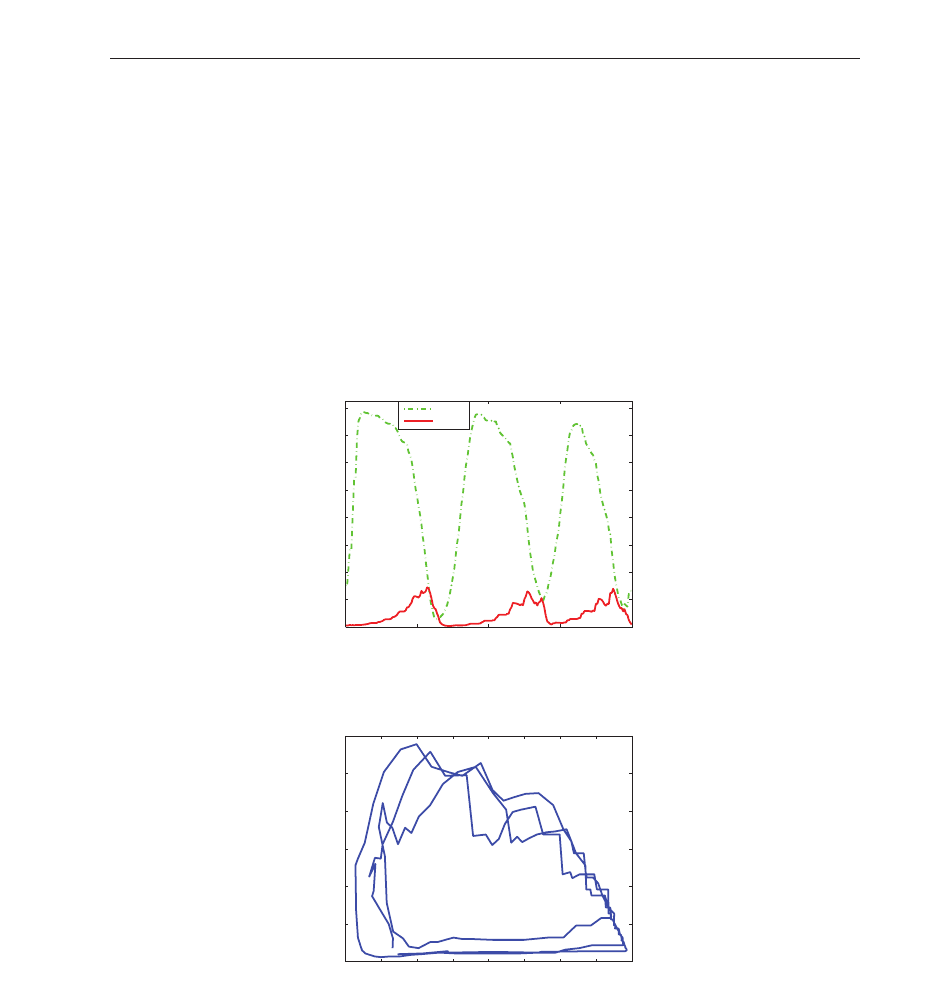
Simulation results of the Wa-Tor system for 200 iterations (or time steps) are depicted in
Figs. 5-7. Notice that the behavior of the fish and sharks shown in Fig. 5 are close to the ones
in similar phase shown in Fig. 3.
0 50 100 150 200
0
200
400
600
800
1000
1200
1400
1600
Iterations
Populations
fishes
sharks
Fig. 5. Wa-Tor simulation results.
0 200 400 600 800 1000 1200 1400 1600
0
50
100
150
200
250
300
Sharks
Fishes
Fig. 6. Phase plan for a simulation in Wa-Tor.
2.4 Computational graphical interface
We have used Matlab 7.0 to build our computational graphical interface for the Wa-Tor system
(see its initial interface in Fig. 8 – (Jafelice & Silva, 2001)). To set up your own simulation,
109
Studies on Population Dynamics Using Cellular Automata
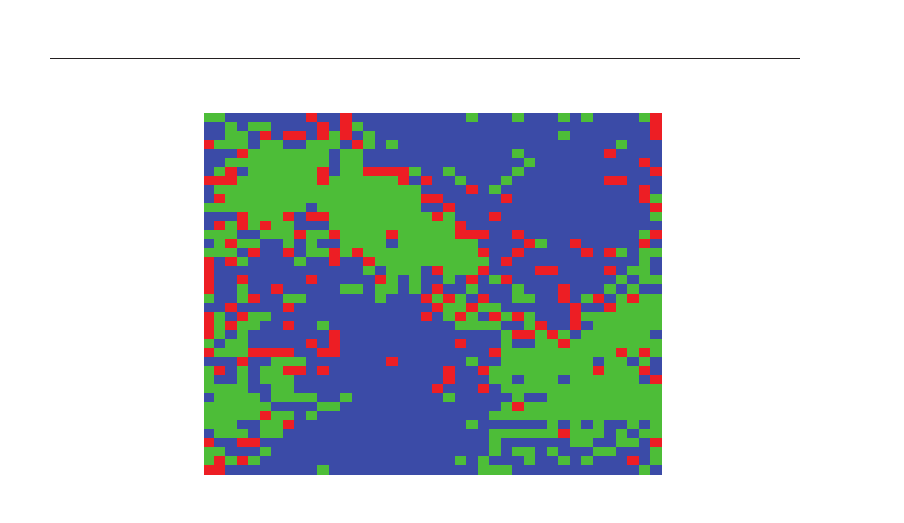
Fig. 7. Snapshot of the cellular automata model output: the blue background is the sea, the
fish are in green and the sharks in red.
the following six parameters need to be chosen: 1. number of iterations 2. initial number of
fish; 3. initial number of sharks; 4. fish reproductive age; 5. sharks reproductive age; 6. sharks
starvation period. It is also possible to run the four simulations listed below with previously
assigned parameters:
1. stable ecological cycle
2. fish extinction
3. shark extinction
4. fish and shark extinction.
Furthermore, at the end of each simulation, the graphs of fish and sharks population as a
function of time and of the phase plane are plotted.
2.5 Conclusion
This section has introduced a cellular automata approach to a prey-predator dynamics. The
obtained results (as well as the Dewdney (1984) ones) resemble the Lotka-Volterra ones but
go further. The population fluctuations of fish and shark resemble better the hare and lynx
charts than the Lotka-Volterra solutions do. Another interesting feature of the CA model is
that it is a spatially distributed prey-predator model. Nowadays, the crucial role of spatial
inhomogeneity into the dynamics of biological species has been recognized (see Durrett &
Levin (2000), Ermentrout & Edelstein-Keshet (1993) and the references therein for further
discussion. See also, Pekalski (2004) for an overview on predator-prey systems approaches and
remarks on some open problems). Saila (2009) presents Wa-Tor as a complex adaptive system
of interacting autonomous agents and points out that the utility of conventional mathematics
in understanding the dynamics of such complex ecosystems is limited. The evolution of the
110
Cellular Automata - Simplicity Behind Complexity
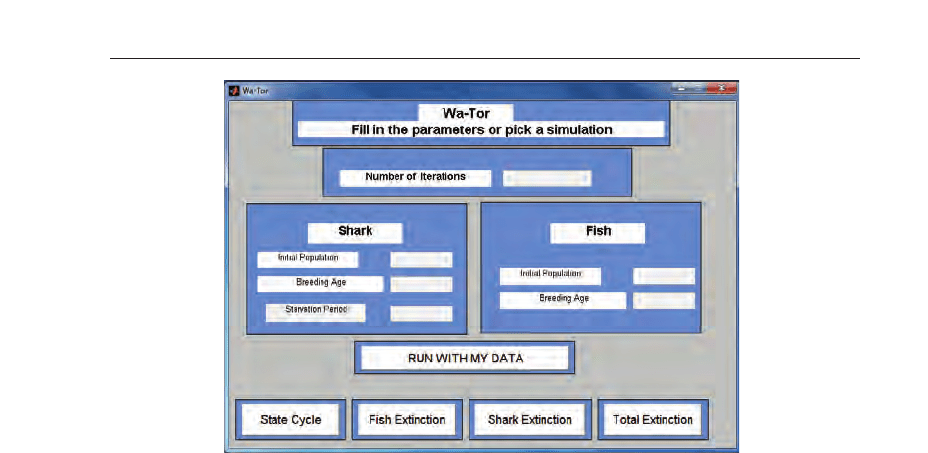
Fig. 8. Computational Graphical Interface of Wa-Tor.
system does not seem to depend on the initial random distribution but the choice of the five
initial parameters is a critical point for the future behavior of the system. The model presents
a complex behavior and the simulations give a qualitative image of the reality.
Cellular automata models for the Human Immunodeficiency Vi rus (HIV) infection dynamics
are the subject of the next sections. Deciding which are the dynamics rules of each cell
demands a deep knowledge on the HIV behavior. HIV is a spherical retrovirus composed
of RNA or ribonucleic acid. Its replication occurs within host cells. Three virus proteins
are of paramount importance for the replication process: Reverse Transcriptase, Integrase
and Protease. After HIV gains entry to its human host, it is disseminated throughout the
lymphatic tissues. When HIV reaches the blood stream, it attacks mainly the lymphocyte
ToftheCD4
+ type. The quantity of cells CD4+ in periphery blood has prognostic
implications in HIV infection evolution. The gradual loss of CD4+ T cells to the AIDS-defining
level of 200 cells/mm
3
and progressive immune deficiency lead to opportunistic infections
that characterizes the HIV infection (Haase, 1999; Hazenberg et al., 2000). Nowadays, the
amount of immunocompetent cells is the most clinically used and acceptable measurement
during treatment of infected individuals. The antiretroviral treatment works inhibiting both
reverse transcriptase and protease. The inhibitions of reverse transcriptase prevents free virus
particles to infect CD4
+ cells. Protease inhibition delays the viral replication, allowing the
organism to react naturally. Combination of reverse transcriptase and protease inhibition has
led to a substantial improvement in HIV therapy.
Microscopic models for HIV infection dynamics in human individuals provide helpful
information to construct cellular automata models, especially when the growth rate of T
lymphocyte of CD4
+, the death rate of infected and non infected cells, free virus load, specific
antibodies CTL, interaction rate between non infected cells of the T CD4
+ and the virus,
and the interaction rate between the infected cells of the lymphocyte T of the CD4
+ and the
antibody are constant.
In the next section, we introduce the cellular automaton model for the HIV infection dynamics
with no antiretroviral therapy (Jafelice et al., 2009).
111
Studies on Population Dynamics Using Cellular Automata
3. Cellular automata of the HIV evolution in the blood stream of positive individuals
with no antiretroviral therapy
AIDS (Acquired Immunodeficiency Syndrome) has become a worldwide health problem. In
countries where AIDS control is poor or even nonexistent, as in some African nations, the
HIV-positive population shows high mortality rates. Zorzenon dos Santos & Coutinho (2001)
reported a cellular automaton approach to simulate the three-phases patterns of HIV infection
consisting of primary response, clinical latency and onset of acquired immunodeficiency
syndrome (AIDS). The robustness of the results obtained from their cellular automata model
were analyzed in Figueiredo et al. (2008). The CA model from Ueda et al. (2006) considers the
diversity exhibited by both HIV and T cells. Their results indicate the diversity of the virus
is the major factor affecting the success rate of the escape of HIV from the immune response
and they were also able to resemble the incubation time variability observed in vivo. Mielke
& Pandey (1998) developed a fuzzy interaction model for mutating HIV with a fuzzy set of 10
interactions for macrophages, helper cells, cytotoxic cells and virion. These models are cellular
automata models with no antiretroviral treatment. We consider a cellular automaton to model
the behavior of the three-phases pattern of HIV infection which consists of: primary infection,
asymptomatic and symptomatic phases for the cells of T lymphocyte of CD4
+ of the HIV and
specific antibodies called CTL. We compare our CA model results with the natural history of
HIV infection and also with the HIV dynamics model proposed by Nowak & Bangham (1996).
3.1 Microscopic models of HIV dynamics
Nowak & Bangham (1996) developed three microscopic models for HIV infection dynamics
within the organism of human individuals, considering no antiretroviral therapy.
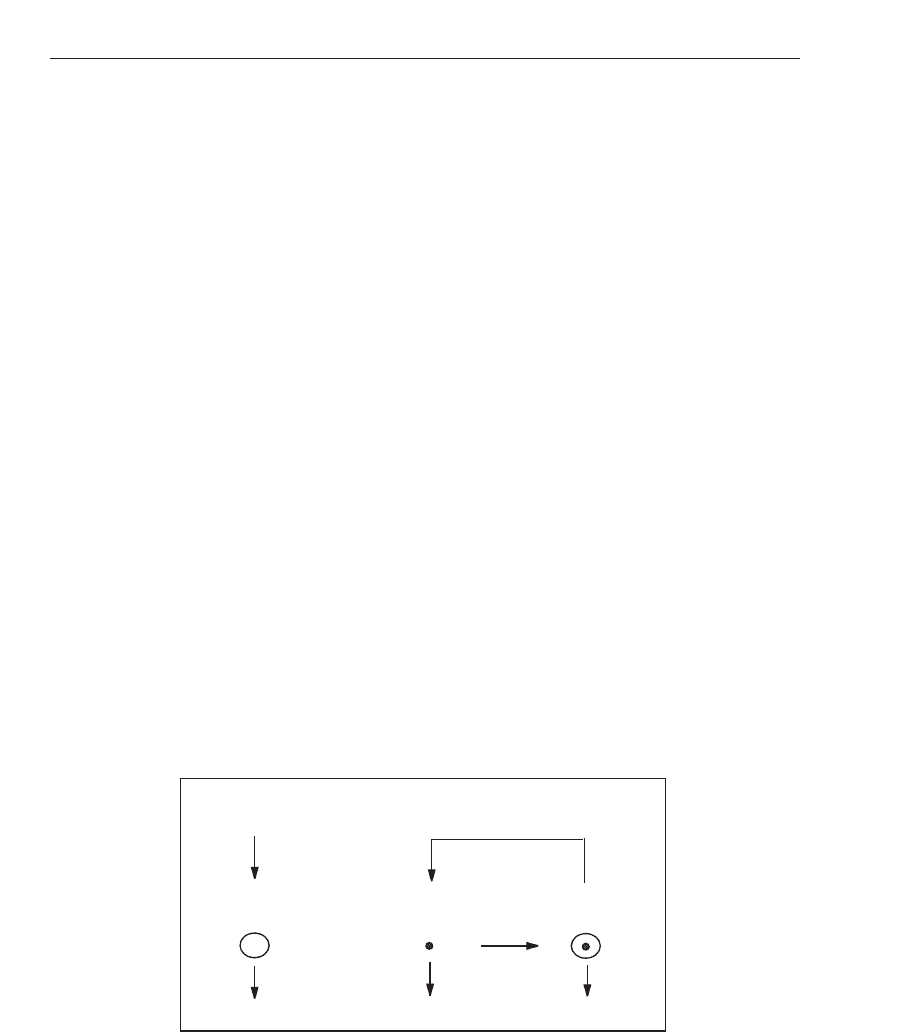
The first model captures the interaction between replicating virus and host cells. In this case,
three variables are considered: uninfected cells n, infected cells i and free virus particles v.
This model assumes that infected cells are produced from uninfected cells and free virus at
rate βnv and die at rate bi. Free virus is produced from infected cells at rate ki and declines at
rate sv. Uninfected cells are produced at a constant rate, r, from a pool of precursor cells, and
die at rate an. Fig. 9 illustrates the HIV dynamics developed by this model.
HIV DYNAMICS
UNINFECTED CELL FREE VIRUS
INFECTED CELL
+
r
( n )
a
( v )
( i )
k
s
β
b
Fig. 9. Microscopic models HIV virus dynamics (Nowak, 1999).
112
Cellular Automata - Simplicity Behind Complexity
Modeling assumptions lead to the following system of differential equations:
dn
dt
= r − an −βnv
di
dt
= βnv − bi
dv
dt
= ki −sv.
(2)
The second model includes immune responses against infected cells, and extends the system
of equations (2) adding an equation to describe the immune responses against infected cells:
dn
dt
= r −an − βnv
di
dt
= βnv −bi − pi z
dv
dt
= ki −sv
dz
dt
= ciz − dz.
(3)
The variable z denotes the magnitude of the antibodies CTL (cytotoxic T lymphocyte) – that
is, the abundance of virus-specific CTLs. The rate of CTL proliferation in response to antigen
is ciz. In the absence of stimulation, CTLs decay at rate dz. Infected cells are killed by CTLs at
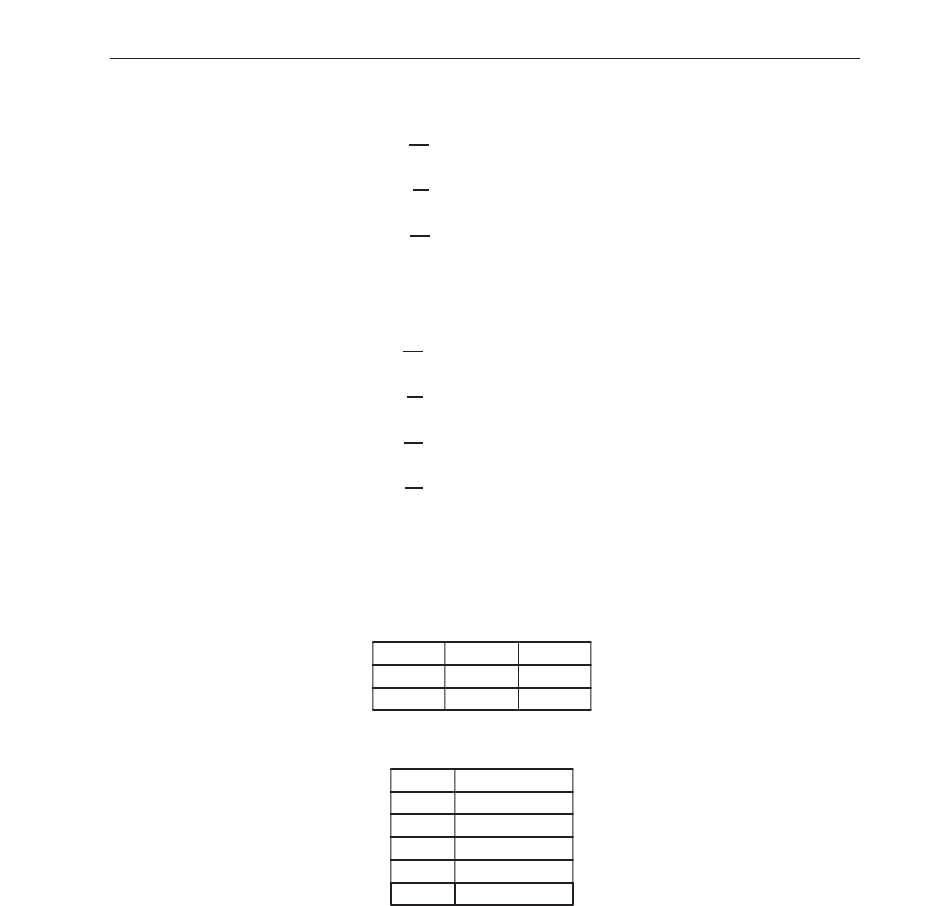
rate piz. Fig. 10 shows the solution of (3) using the parameters of Table 1 and initial conditions
of Table 2, obtained from Caetano & Yoneyama (1999).
r = 0.3 a = 0.1 β = 1
b = 0.01 p = 0.03 k = 0.5
s = 0.01 c = 0.01 d = 0.01
Table 1. Parameters of the microscopic HIV model.
n(0) 0.99
i(0) 0.01
v(0) 0.1
z(0) 0.01
t initial 0
t final 500 time units
Table 2. Initial conditions of the microscopic HIV model.
From Fig. 10 one can see that, in logarithmic scale, the uninfected cells of CD4
+ show a rapid
decline in the first weeks and a slow recovery when the number of lymphocytes is close to
the maximum. The increase in the number of lymphocytes is related to virus replication in the
infected cells.
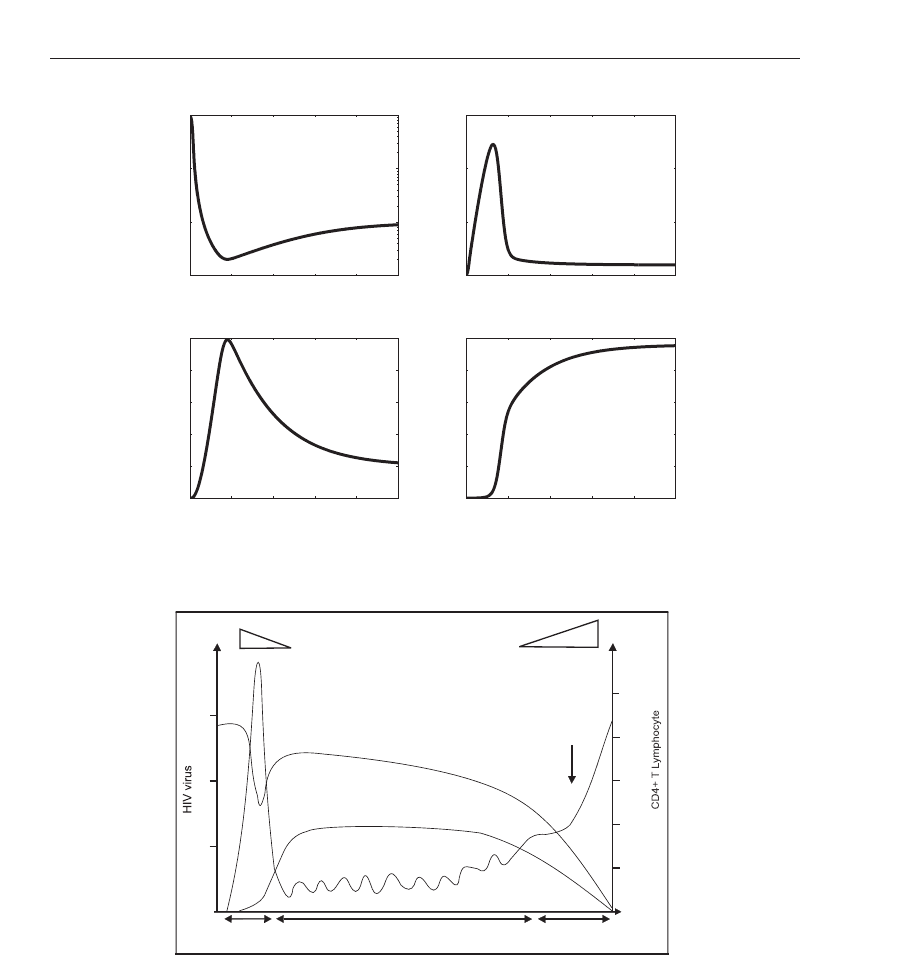
Comparing the solution of system (3), shown in Fig. 10, with the plots of Fig. 11, which gives
the dynamics of HIV infection history currently accepted (Coutinho et al., 2001; Perelson
& Nelson, 1999; Saag, 1995), we notice that the uninfected cells of CD4
+ identify with the
CD4
+ level, the free virus with the HIV virus, and the virus-specific CTLs with the HIV
113
Studies on Population Dynamics Using Cellular Automata
0 100 200 300 400 500
10
−3
10
−2
10
−1
10
0
time (t)
uninfected cells of CD4+ ( n)
0 100 200 300 400 500
0
5
10
15
time (t)
infected cells of CD4+ ( i)
0 100 200 300 400 500
0
50
100
150
200
250
time (t)
free virus ( v)
0 100 200 300 400 500
0
2
4
6
8
10
time (t)
virus specific CTL ( z)
Fig. 10. Solution of the microscopic HIV model (3).
10
10
10
10
6
5
4
3
Symptoms
Symptoms
AIDS
CD4+ T Lymphocyte
HIV antibodies
HIV virus
4-8 weeks
Primary Infection
10-12 years
Asymptomatic Phase
2-3 years
Symptomatic Phase
1800
1200
600
Fig. 11. The natural history of HIV infection dynamics as currently accepted (Coutinho et al.,
2001; Perelson & Nelson, 1999; Saag, 1995).
antibodies. This result will help to validate the cellular automata model for individuals under
no antiretroviral therapy.
The next section details the Blood-Tor system, the cellular automaton model for the HIV
infection dynamics.
114
Cellular Automata - Simplicity Behind Complexity
4. Blood-Tor system
The name B lood-Tor comes from Bloodstream-Toroidal which is similar to the name of the
cellular automaton Wa-Tor, that means Water-Toroidal (Dewdney, 1984; Renning, 1999-2000).
The Blood-Tor System (BTS) is shaped like a torus in which coexist artificially uninfected
cells, infected cells of lymphocytes T of CD4
+, free virus particles, and specific antibodies
CTL (cytotoxic T lymphocyte) that attack infected cells in an individual blood stream with no
antiretroviral therapy. These elements are the same as those associated with the state variables
of the differential equation system (3).
4.1 Description of the simulation process
Eleven parameters need to be chosen to set up a simulation run. The parameters are the
following:
• number of uninfected cells
• number of infected cells of the lymphocytes T of CD4
+
• number of free virus particles
• number of specific antibodies CTL (cytotoxic T lymphocyte)
• life span limit of uninfected cells
• life span limit of infected cells
• life span limit of free virus particles
• life span limit of specific antibodies CTL (cytotoxic T lymphocyte)
• infected cells reproductive age
• specific antibodies CTL reproductive age
• uninfected cells production rate
The cells states in the grid are updated according to the local dynamics rules of each cell. For
instance, in a 31x31 cell grid 200 uninfected cells, 16 infected cells of the lymphocytes T of
CD4
+, 120 free virus particles and 25 specific antibodies CTL (cytotoxic T lymphocyte) are
placed at random positions. All uninfected cells, infected cells of the lymphocytes T of CD4
+,
free virus particles and specific antibodies CTL have a life span set according to a specific
time limit. Table 3 gives the values of the life spans. An initially random assortment of ages
are distributed to the elements (uninfected cells, infected cells of lymphocytes T of CD4
+,
free virus particles and specific antibodies CTL that attack infected cells) according to their
respective life span limits.
cell uninfected infected HIV CTL
life span limit (iterations) 4 5 3 15
Table 3. Life span limits.
4.1.1 Behavior of uninfected cell of the lymphocytes T of CD4+ in BTS
Each uninfected cell of the lymphocytes T of CD4+ chooses a free place in its neighborhood,
moves and ages there (if all places are occupied, then it remains where it is and ages). They
move according to a randomly assigned integer that indicates a direction. More specifically,
depending on whether the value of the integer is equal to 0, 1, 2 or 3, they move north, east,
115
Studies on Population Dynamics Using Cellular Automata

south or west in the grid, respectively. Lymphocytes T of CD4+ are produced with a constant
rate. During simulation the rate is 18 cells for each iteration. When they reach their life span
limit they die.
4.1.2 Behavior of HIV in BTS
First, each HIV searches for uninfected cells of the lymphocytes T of CD4+ in its
neighborhood. If there are uninfected cells, the HIV randomly chooses one and the cell chosen
becomes an infected cell. If there are no uninfected cells, then the HIV chooses a place in its
neighborhood and moves and ages there (if all places are occupied, it remains in its place and
ages). When HIVs reach their life span limit they die.
4.1.3 Behavior of infected cell of the lymphocytes T of CD4+ in BTS
When free HIVs encounter uninfected cells of CD4+, the uninfected cells become infected.
Those cells begin to replicate HIV when they reach the age of 5 iterations. The simulation
program puts a HIV in the position of the infected cell and assigns zero age to the new HIV.
They move and age similarly as the uninfected cells lymphocytes T of CD4
+. After their life
span limit, they die.
4.1.4 Behavior of specific antibodies CTL in BTS
Each specific antibody CTL looks for infected cells of the lymphocytes T of CD4+ in its
neighborhood. When specific antibodies CTL encounter infected cells, the infected cells are
destroyed. The specific antibodies CTL move to the cells infected in previous position. The
specific antibodies reach the reproduction period after 14 iterations. They move and age
similarly as the uninfected cells of lymphocytes T of CD4
+. After their life span limit, they
die.
The Blood-Tor system simulates the dynamics of the evolution of HIV within the blood stream
human individual with no treatment.
Fig. 12 shows a snapshot of the Blood-Tor system cellular automaton model. The uninfected
cells are shown in blue, the HIVs in black, the infected cells in green, and the antibodies in
white. The Blood-Tor simulation system was developed using Matlab 7.0.
Simulation results of the Blood-Tor system (BTS), after 50 iterations (or time steps) are depicted
in Fig. 13. Notice that the behavior of the uninfected cells of CD4
+, infected cells of CD4+,
free virus, and virus specific antibodies shown in Fig. 13 are close to the ones in similar
(asymptomatic) phase shown in Fig. 11. Clearly, BTS does give a good description of the
evolution of HIV in the blood stream of human individuals with no treatment.
Next section extends the BTS to encompass the natural phases of HIV dynamics of the Fig. 11.
4.2 Extended Blood-Tor system
To expand the ability of cellular automaton to model the natural history of HIV infection,
the Blood-Tor System was extended to include the symptomatic phase behavior, as Fig. 11
suggests.
The cellular automaton that produces the outputs shown in Fig. 13, was modified such that,
after a certain number of iterations, antibodies production decrease and, consequently, the
number of free virus particles increases. In a grid of 31x31 cells, 120 uninfected cells, 18
infected cells of the lymphocytes T of CD4
+, 180 free virus particles and 18 specific antibodies
CTL (cytotoxic T lymphocyte) were introduced at random positions. All of these cells move
116
Cellular Automata - Simplicity Behind Complexity