Peng S., Zhang J., Engineering Geology for Underground Rocks
Подождите немного. Документ загружается.

3 In-situ stress and pore pressure
3.1 In-situ stress regimes
In-situ stress magnitudes and orientations play a very important role in
geological engineering, and they are the most basic parameter inputs in de-
sign of underground structures. One of the main functions of rock mechan-
ics has been to determine in-situ stress. In-situ stress is characterized by
the magnitudes and directions of three principal stresses. Generally, in-situ
principal stresses are consisted of three mutually orthogonal stresses, i.e.
vertical stress (
V
V
), minimum horizontal stress (
V
h
), and maximum hori-
zontal stress (
V
H
). In different geographic, geologic, and tectonic regions,
in-situ stress magnitudes and orientation are very different. The three in-
situ stresses correspond to three principal stresses, namely greatest stress
(
V
1
), intermediate stress (
V
2
), and least stress (
V
3
). According to the rela-
tionships between principal stresses and vertical, minimum and maximum
horizontal stresses, three in-situ stress regimes (Fig. 3.1) can be used to de-
scribe the stress states, i.e.:
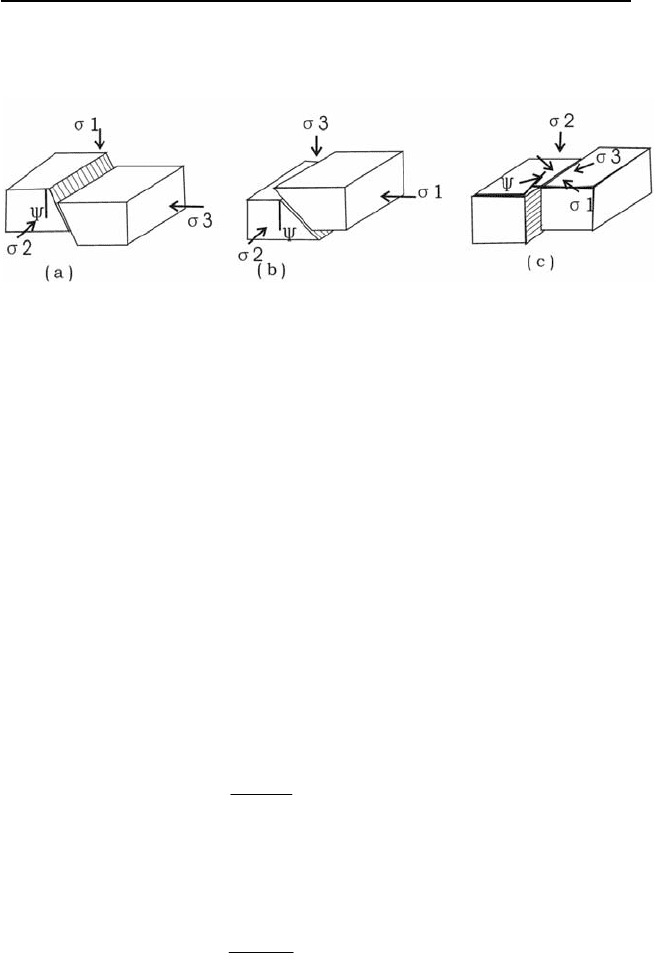
1. Normal faulting stress regime. In this case, gravity or vertical stress
drives normal faulting and fault slip occurs when the minimum
stress reaches a sufficiently low value (Zoback et al. 2003). In this
stress state the vertical stress is the greatest principal stress (
V
V
=
V
1
), i.e.
V
V
tV
H
tV
h
.
2. Strike-slip faulting stress regime. In this case, the vertical stress is
the intermediate principal stress (
V
V
=
V
2
). When the difference be-
tween maximum and minimum stresses is sufficiently large, slip
faulting occurs. Therefore, this case also represents slip faulting re-
gion. In this stress state, one has
V
H
tV
V
tV
h
.
3. Reverse (or thrust) faulting stress regime. In this case, the vertical
stress is the least principal stress (
V
V
=
V
3
). When the stress field is
very compressive, both horizontal stresses exceed the vertical stress,
and folding and reverse faulting could occur when the maximum
horizontal principal stress is sufficiently large relative to the vertical
46 3 In-situ stress and pore pressure
stress. Some thrust fault regions belong to this category. In this
stress state, one has
V
H
tV
h
tV
V
.
Fig. 3.1. Illustration of different faulting stress regimes: a. Normal faulting; b.
Reverse faulting; and c. Strike-slip faulting. In the figure,
f
M
S
\
2/
.
It can be seen that knowing the stress regime can better constrain in-situ
stress magnitudes. Assuming there are critically oriented faults constrain-
ing stress magnitudes, the Mohr-Coulomb criterion in faults can be ex-
pressed as follows:
'
3
'
1
VV
ff
qC d
(3.1)
where
'
1
V
is the maximum effective stress, and p
DVV
1
'
1
;
'
3
V
is the
minimum effective stress,
p
DVV
3
'
3
; C
f
is the cohesion of the fault;
)sin1/()sin1(
fff
q
M
M
;
M
f
is the angle of internal friction of the
fault, ranging from 30 to 45q; p is the pore pressure.
In significant depth, the effect of cohesion of a fault is relatively unim-
portant in terms of the stress magnitudes, thus the cohesion can be ne-
glected. Consequently the stress relationship in faults can be rewritten as
the following form, assuming
D
=1:
f
q
p
p
d
3
1
V
V
(3.2)
In different stress regimes, according to stress magnitudes and Eq. 3.2
the following relationships exist:
1) Normal faulting stress regime
f
h
V
q
p
p
d
V
V
(3.3)
2) Strike-slip faulting stress regime

3.2 Overburden stress 47
f
h
H
q
p
p
d
V
V
(3.4)
3) Reverse/thrust faulting stress regime
f
V
H
q
p
p
d
V
V
(3.5)
Equations 3.2 to 3.5 give a bound between in-situ stresses. These equa-
tions allow to define the limiting stress magnitudes for different tectonic
environments: in normal faulting areas
V
h
# 0.6
V
V
, in reverse faulting areas
V
H
# 2.3
V
V
, and in strike-slip faulting areas if
V
V
# (
V
H
+
V
h
)/2,
V
H
# 2.2
V
h
(Zoback and Zoback 1989).
It is noted that the world stress map presents globally measured data of
in-situ stresses, where both stress regimes and maximum stress directions
can be obtained in some areas (Reinecker et al. 2006).
3.2 Overburden stress
Overburden stress, also called vertical stress, is induced by the weight of
the overlying formations. If the overlying formations have an average den-
sity of
U
a
, then the overburden stress can be calculated by:
gz
aV
U
V
(3.6)
where g is the acceleration due to gravity.
If density varies with depth, the vertical stress can be calculated by inte-
gration of rock densities from the surface to the depth of interest, z, i.e.:
³
z
bV
gdzz
0
)(
UV
(3.7)
where
U
b
(z)is the rock density as a function of depth.
In offshore areas, water depth (z
w
) needs to be considered to calculate
the vertical stress, that is:
³
z
z
bwwV
w
gdzzgz )(
UUV
(3.8)
where
U
w
is the density of water.
48 3 In-situ stress and pore pressure
Density log can be used to calculate overburden stress. However, den-
sity log is usually not recorded at shallow depth. In this case some empiri-
cal methods can be used to estimate rock density at shallow depth. Most
clastic rocks have an average density of 2.3 g/cm
3
, as shown in Chap. 1.
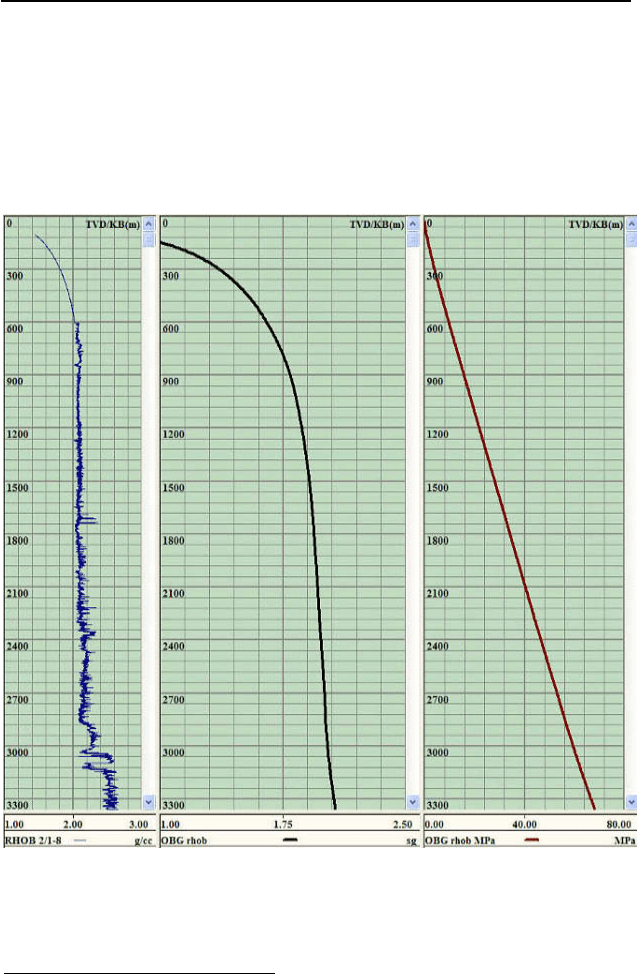
Overburden stress gradient is normally in range of 18 to 25 kPa/m (about
1.0 psi/ft). Figure 3.2 gives an example to calculate overburden stress and
stress gradient using density log.
(a) (b) (c)
Fig. 3.2. Density log data versus the true vertical depth (TVD in meters) and
Drillworks
1
calculation of overburden gradient and overburden stress in offshore
11
Drillworks is a suite of software developed by Knowledge Systems, Inc. for pre-
dicting in-situ stress, pore pressure and wellbore stability.

3.3 Minimum horizontal stress 49
drilling: a. density log data in g/cm
3
; b. overburden gradient in specific gravity
(sg); and c. overburden stress in MPa.
Worldwide in-situ stress measurements show that the vertical stress and
depth have linear relationships, as shown in the following:
z
V
)0028.00266.0()26.19.1( rr
V
(3.9)
z
V
027.0
V
(3.10)
where
V
V
is the vertical stress in MPa and z is the depth in m.
3.3 Minimum horizontal stress
In normal faulting stress regime, the minimum horizontal stress is the
minimum principal stress and can be calculated by the following equation:
)(
0
pKp
Vh
D
V
D
V
(3.11)
where p is the pore pressure;
D
is the Biot’s constant; K
0
is the effective
stress ratio; and
p
p
K
V
h
DV
D
V
Q
Q
1
0
(3.12)
where
Q
is the Poisson’s ratio. The effective stress ratio, K
0
, ranges from
0.33 to 1.
According to the joint industry projects conducted at Knowledge Sys-
tems (2001), the K
0
of 0.8 is fairly accurate to predict the minimum hori-
zontal stress and fracture gradient in shaly formations in depth of below
3000 m in the Gulf of Mexico.
By considering horizontal strain and deformation effect, Hooke’s law
can be applied to derive the horizontal minimum stress and strain relation-
ships. The following equation can be obtained, and it can be used to calcu-
late the minimum horizontal stress with tectonic strain effects:
hHVh
EE
pp
H
Q
H
Q
Q
DV
Q
Q
DV
22
11
)(
1
(3.13)
where E is the elastic modulus of the rock;
H
H
and
H
h
are the tectonic strains
in maximum and minimum horizontal stress directions, respectively.
Using fracture data from the US Gulf Coast, Breckels and van Eekelen
(1982) proposed the relationships between minimum horizontal stress and

50 3 In-situ stress and pore pressure
depth. In these relationships the abnormal pore pressure effects were also
considered. They can be written as follows:
)500,3()0105.0(46.07.310264.0
)500,3()0105.0(46.00053.0
145.1
mDDpD
mDDpD
h
h
!
V
V
(3.14)
where D is the depth in meters; p is the pore pressure in MPa.
V
h
is the
minimum horizontal stress in MPa.
Breckel and van Eekelen pointed out that their minimum stress predic-
tion is fairly reliable in the depth range down to 3500 m, and it can be used
with a fair degree of confidence in other tectonically relaxed areas such as
the North Sea (Fjær et al. 1992).
Hydraulic fracturing is a common technique for stress measurements in
deep boreholes. Hydraulic fracturing stress determination aims to deter-
mine both minimum and maximum horizontal stresses. Hydraulic pressuri-
zation is conducted with specialized equipment for high pressure injection.
During hydraulic fracturing, the borehole is pressured by fluid injection,
and the pump injection flow and the well pressure are measured (Rutqvist
et al. 2000). A similar test, leak-off test (LOT), has been conducted in
drilling industry to evaluate cement job and estimate formation fracture
gradient. Hubbert and Willis (1957) concluded that hydraulic fractures in
the earth always propagate perpendicular to the orientation of the least
principal stress, because it is the least energy configuration. This provides
a fundamental principle for conventional hydraulic fracturing measure-
ments and LOT.
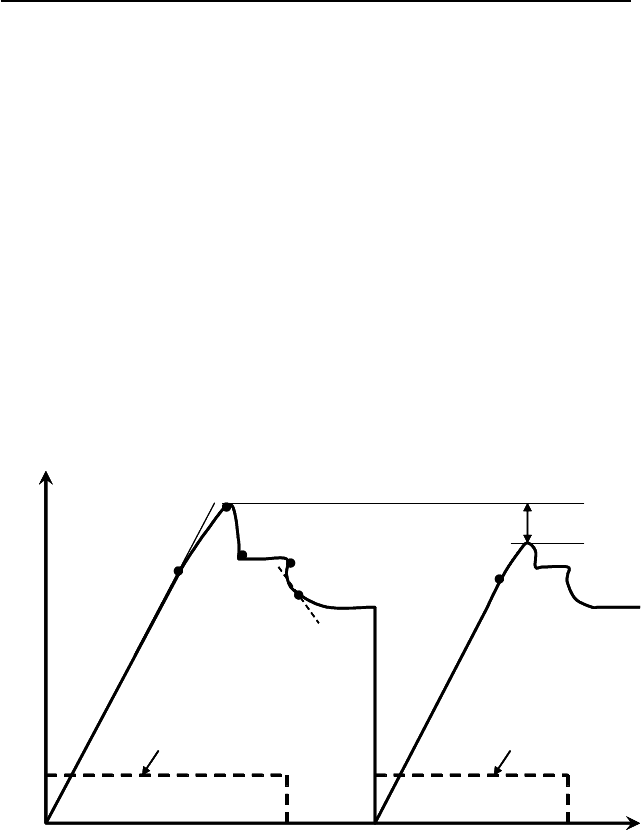
Figure 3.3 illustrates the pressure, volume/time plot for a typical hydrau-
lic fracturing or LOT measurement with the first and second pressurization
cycles.
In a hydraulic fracture test, an interval of borehole is isolated and sealed
with inflatable packers. In a LOT, only the hole below the casing and any
new formation drilled prior to the test are exposed (Edwards et al. 2002).
The fluid is then pumped into the hole with a constant flowrate. The pres-
sure increase in the hole is typically linear as long as there are no leaks in
the system, and the exposed formation is not highly permeable. As the
pressure increases at some point, the rate of pressure increase changes such
that the pressure-time curve departs from linearity. This departure from
linearity is called (Fig. 3.3) fracture initiation pressure (p
i
).
After departure from linearity, pressure is typically seen to increase at a
lower rate until a maximum pressure is reached, and this pressure is rock
breakdown pressure (p
b
). After this point the pressure falls rapidly, or re-
mains steady. Horizontal stress magnitudes can be estimated from the frac-
ture breakdown pressure (Haimson and Fairhurst 1970):
3.3 Minimum horizontal stress 51
0
3 Tpp
Hhb
V
V
(3.15)
where p is the pore pressure; p
b
is the fracture breakdown pressure; and T
0
is the tensile strength of the rock.
This relationship assumes that the rock behaves elastic and isotropic. It
indicates that fracture breakdown pressure is greater in magnitude than the
minimum horizontal stress.
After the rock is broken down (hydraulic fracture created), at some
point the pressure in the hole levels off and remains fairly constant (p
prop
)
at the same flowrate. During this stage, the fracture is propagating. When
the pumps are turned off, the pressure immediately drops to the instantane-
ous shut-in pressure (p
isip
). After the well is shut-in, the pressure begins to
drop as fluid leaks into the formation. As the pressure declines, the fracture
starts to close. If the fracture is vertical and largely in the far field, then the
stress acting to close the fracture is equal to the minimum horizontal stress
(
V
h
).
p
i
p
b
p
isip
P
c
= S
h
Pressure
Volume/time
T
0
p
r
Volume Volume
p
prop
p
i
p
b
p
isip
P
c
= S
h
Pressure
Volume/time
T
0
p
r
Volume Volume
p
prop
Fig. 3.3. Schematic pressure versus volume/time plot of a hydraulic fracture proc-
ess. The figure also shows the determination of minimum stress/closure pressure
(S
h
or
V
h
) using the tangent method.

52 3 In-situ stress and pore pressure
In the LOT test the minimum horizontal stress (
V
h
or S
h
) is determined
from the shut-in pressure. The minimum horizontal stress is equal to the
closure pressure (p
c
), as shown in Fig. 3.3.
ch
p
V
(3.16)
3.4 Maximum horizontal stress
3.4.1 Determinations from field tests
The maximum horizontal stress can be estimated from the LOT with frac-
ture reopening test, as shown in Fig. 3.3. In an ideal case, when no fluid
penetrates the fracture until fracture reopening, the maximum horizontal
stress (
V
H
) may be calculated using the following equation for a vertical
borehole (Bredehoeft et al. 1976):
0
3 pp
rhH
V
V
(3.17)
where p
r
is the reopening pressure and p
0
is the pore pressure in the frac-
ture.
This equation is derived from the Kirsch solution for a circular hole sub-
jected to an internal pressure in an isotropic, homogeneous, and linear elas-
tic medium. The assumption in the derivation is that the reopening occurs
when the fluid pressure applied on the borehole wall is high enough to
cancel out the minimum tangential stress at the borehole wall.
If the fracture is slightly conductive, the fluid pressure at the wellbore
wall may only partially penetrate, and the pressure inside the fracture at the
wellbore wall is equal to the well-pressure. In this case, the maximum
horizontal stress can be obtained by (Ito et al. 1997):
rhH
p23
V
V
(3.18)
In the extreme case with a more conductive fracture, the fluid pressure
may completely penetrate to the crack tip. This implies that the reopening
is dominated by total force formed by the fluid pressure on the fracture
surfaces, and reopening pressure would be equal to the minimum horizon-
tal stress (Rutqvist et al. 2000):
rh
p
V
(3.19)

3.4 Maximum horizontal stress 53
3.4.2 Determinations from various equations
If there is no direct measurement available for determination of the value
of the maximum horizontal stress, the following relationship can be used to
estimate the maximum horizontal stress:
)(
hVhH
m
V
V
V
V
(3.20)
where m is a constant, normally m = 0 - 2. In the normal faulting stress re-
gime, m can generally be taken as 0.5.
While drilling, when the mud weight in a borehole is high enough, the
mud pressure will start to fracture the rock, and tensile failure will occur.
At this moment, the minimum tangential stress around wellbore is equal to
rock tensile strength. From the Kirsch equation (refer to Chap. 7) the fol-
lowing relationship can be obtained:
0
3 Tpp
mhH
V
V
(3.21)
where p is the pore pressure; p
m
is the mud pressure in the borehole.
Using elasticity theory and the Mohr-Coulomb failure criterion for slip-
page on the faults, the relationship between horizontal stress and pore pres-
sure during mobilization of normal and thrust faulting are as follows (Ad-
dis et al. 1996):
Normal faulting:
pp
h
f
H
)(
sin1
2
V
M
Q
V
(3.22)
Thrust faulting:
]})1([{
)1(
1
QQV
Q
V
fhf
f
H
qpq
q
(3.23)
where is
M
f
is the internal friction angle of the fault and
f
f
f
q
M
M
sin1
sin1
.
When the stress concentration around a wellbore exceeds the rock com-
pressive strength, breakouts are induced around the wellbore rocks. Be-
cause breakout width is expected to remain stable as breakout growth oc-
curs, Barton et al. (1988) presented a method to determine the maximum
horizontal stress utilizing observations of breakout width when the rock
uniaxial compressive strength is known, that is:

54 3 In-situ stress and pore pressure
b
bh
T
m
H
ppUCS
T
TVV
V
2cos21
)2cos21(
'
(3.24)
where UCS is the uniaxial compressive strength of the rock;
T
b
is the
breakout angle;
V
'
T
is the thermal stress arising from the difference (
'
T)
between the mud temperature (T
m
) and the formation temperature (T
f
) , and
Q
D
V
'
1
)(
fmt
T
TTE
(3.25)
where
D
t
is the thermal expansion coefficient of the rock; E is the Young’s
modulus of the rock.
Worldwide in-situ stress measurements show that the mean horizontal
stress components and vertical stress at a depth of 3000 m have the fol-
lowing relationship (Hoek and Brown 1980):
5.0
1500
3.0
100
z
k
z
(3.26)
where z is the burial depth in meters; k is defined as the ratio of the average
horizontal stress,
2)(
hH
V
V
, to the vertical stress,
V
V
. That is:
v
hH
k
V
V
V
2
In-situ stress measurements show that the maximum and minimum hori-
zontal stress components have the following relationship:
hH
V
V
/
1.4 to 3.3
3.5 Pore pressure prediction
Pore pressure is one of the most important parameters for geomechanical
and geological analyses. One cannot obtain a correct prediction for any ge-
omechanical model without a right pore pressure input for the porous for-
mations (Zhang et al. 2006, Madge et al. 2006). Pore pressure varies from
hydrostatic (pressure gradient of about 1.0 MPa/km, or 0.44 psi/ft), which
is normal pressure, to severely overpressured (48% to 95% of the overbur-
den stress). The abnormal pore pressure is caused by abnormal formation
compaction. When sediments compact normally, their porosity is reduced
at the same time as pore fluid is expelled. This causes hydrostatic pore