Pecharsky V.K., Zavalij P.Y. Fundamentals of Powder Diffraction and Structural Characterization of Materials
Подождите немного. Документ загружается.

Fundamentals
of
diffraction
4
b*
Ewald's
sphere
....
I
Reciprocal
lattice
Figure
2.28.
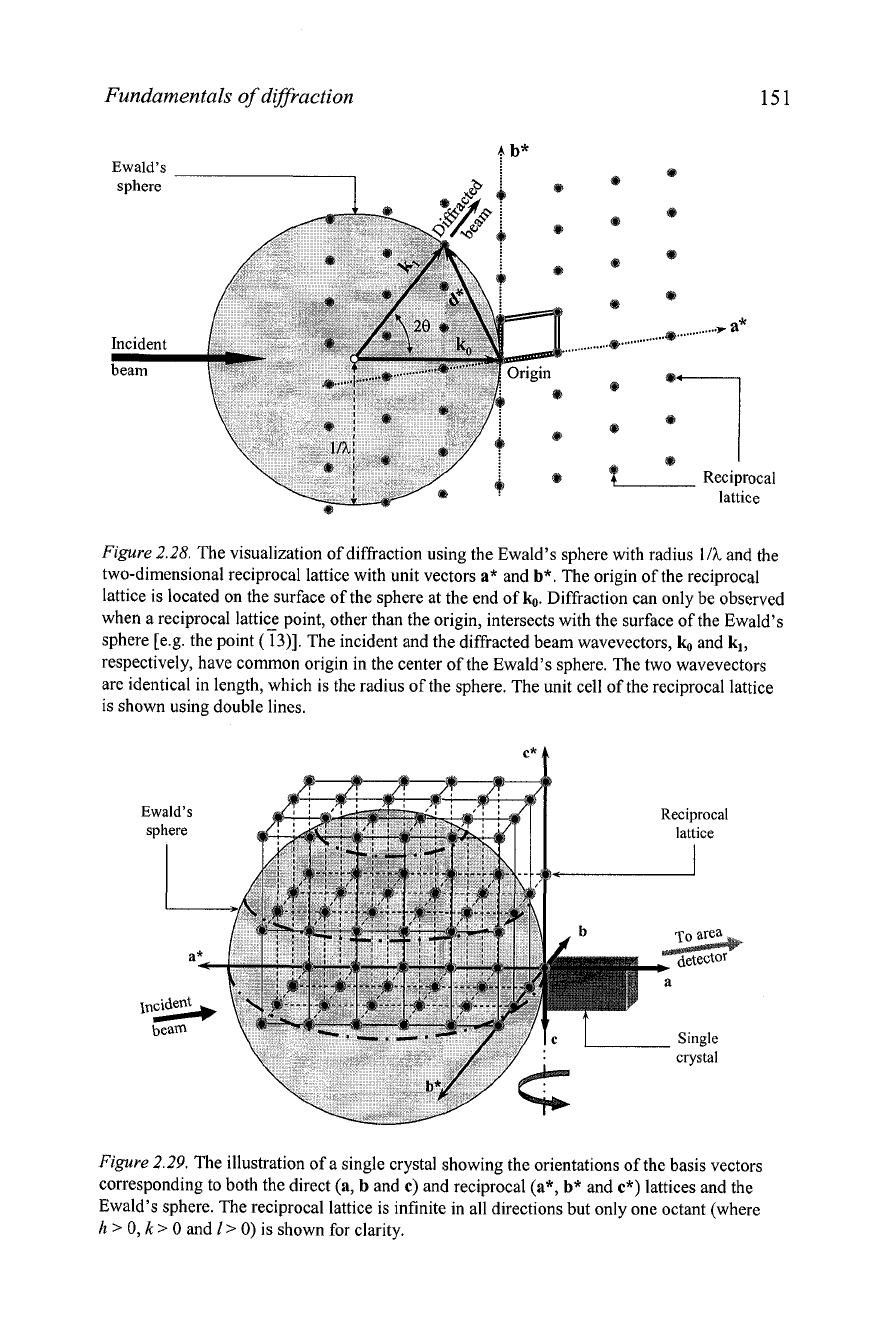
The visualization of diffraction using the Ewald's sphere with radius
111
and the
two-dimensional reciprocal lattice with unit vectors
a*
and
b*.
The origin of the reciprocal
lattice is located on the surface of the sphere at the end of
b.
Diffraction can only be observed
when a reciprocal lattice point, other than the origin, intersects with the surface of the Ewald's
sphere [e.g. the point
(i3)].
The incident and the diffracted beam wavevectors,
and
kl,
respectively, have common origin in the center of the Ewald's sphere. The two wavevectors
are identical in length, which is the radius of the sphere. The unit cell of the reciprocal lattice
is shown using double lines.
Reciprocal
Figure
2.29.
The illustration of a single crystal showing the orientations of the basis vectors
corresponding to both the direct
(a,
b
and
c)
and reciprocal
(a*,
b*
and
c*)
lattices and the
Ewald's sphere. The reciprocal lattice is infinite in all directions but only one octant (where
h
>
0,
k
0
and
1
>
0)
is shown for clarity.
152
Chapter
2
Figure
2.30.
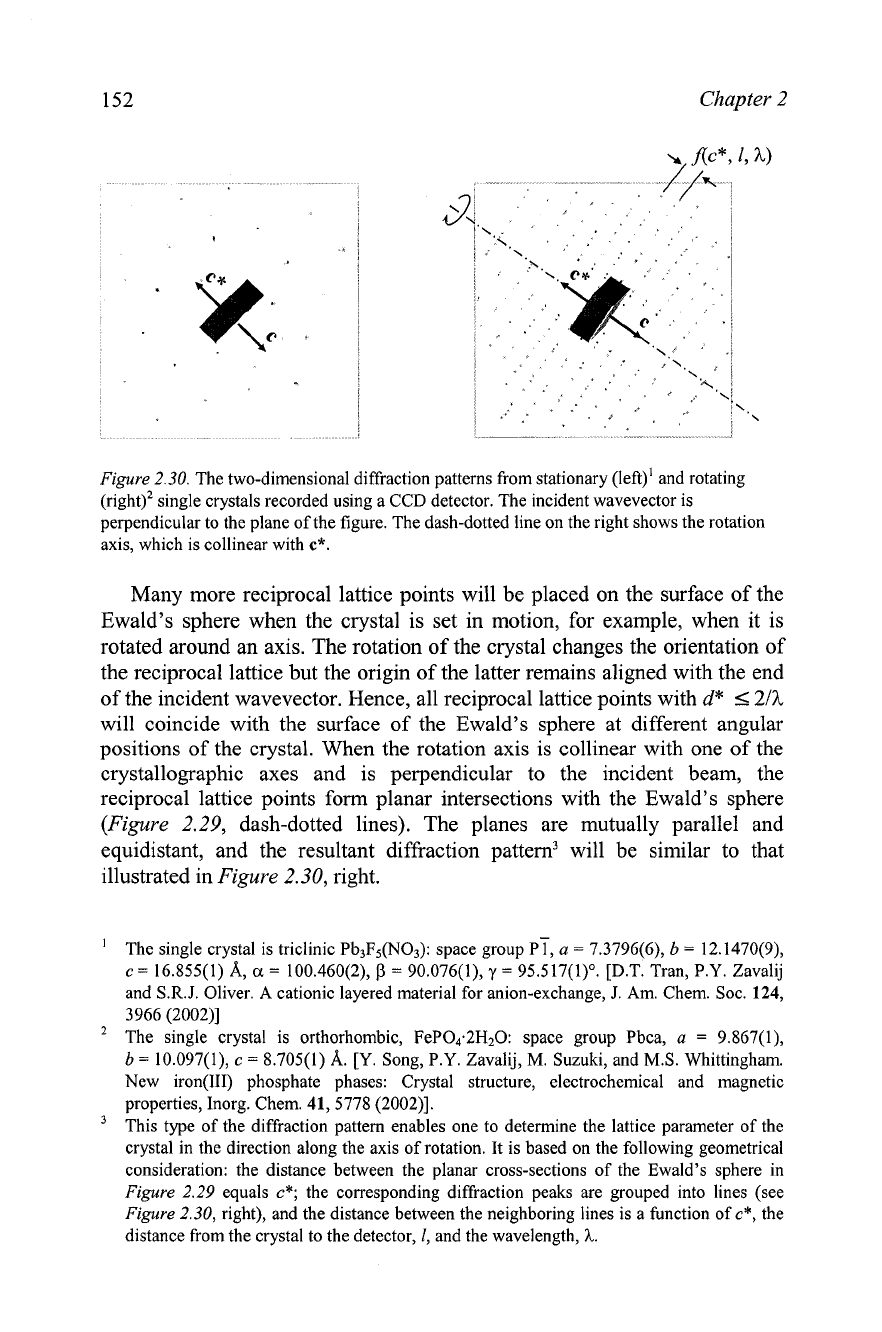
The two-dimensional diffraction patterns from stationary (left)' and rotating
(right)' single crystals recorded using a CCD detector. The incident wavevector is
perpendicular to the plane of the figure. The dash-dotted line on the right shows the rotation
axis, which is collinear with
c*.
Many more reciprocal lattice points will be placed on the surface of the
Ewald's sphere when the crystal is set in motion, for example, when it is
rotated around an axis. The rotation of the crystal changes the orientation of
the reciprocal lattice but the origin of the latter remains aligned with the end
of the incident wavevector. Hence, all reciprocal lattice points with
d*
I2/h
will coincide with the surface of the Ewald's sphere at different angular
positions of the crystal. When the rotation axis is collinear with one of the
crystallographic axes and is perpendicular to the incident beam, the
reciprocal lattice points form planar intersections with the Ewald's sphere
(Figure
2.29, dash-dotted lines). The planes are mutually parallel and
equidistant, and the resultant diffraction pattern3 will be similar to that
illustrated in
Figure
2.30,
right.
'
The single crystal is triclinic Pb3F5(N03): space group pi,
a
=
7.3796(6),
b
=
12.1470(9),
c=
16.855(1)
A,
a
=
100.460(2),
P
=
90.076(1),
y
=
95.517(1)". [D.T. Tran, P.Y. Zavalij
and S.R.J. Oliver. A cationic layered material for anion-exchange,
J.
Am. Chem. Soc. 124,
3966 (2002)l
The single crystal is orthorhombic, FePO4.2H2O: space group Pbca,
a
=
9.867(1),
b
=
10.097(1),
c
=
8.705(1)
A.
[Y. Song, P.Y. Zavalij,
M.
Suzuki, and MS. Whittingham.
New iron(II1) phosphate phases: Crystal structure, electrochemical and magnetic
properties, Inorg. Chem. 41,5778 (2002)l.
This type of the diffraction pattern enables one to determine the lattice parameter of the
crystal in the direction along the axis of rotation. It is based on the following geometrical
consideration: the distance between the planar cross-sections of the Ewald's sphere in
Figure
2.29
equals
c*;
the corresponding diffraction peaks are grouped into lines (see
Figure
2.30,
right), and the distance between the neighboring lines is a function of
c*,
the
distance from the crystal to the detector,
I,
and the wavelength,
h.
Fundamentals of diffraction
153
2.7 Origin of the powder diffraction pattern
A
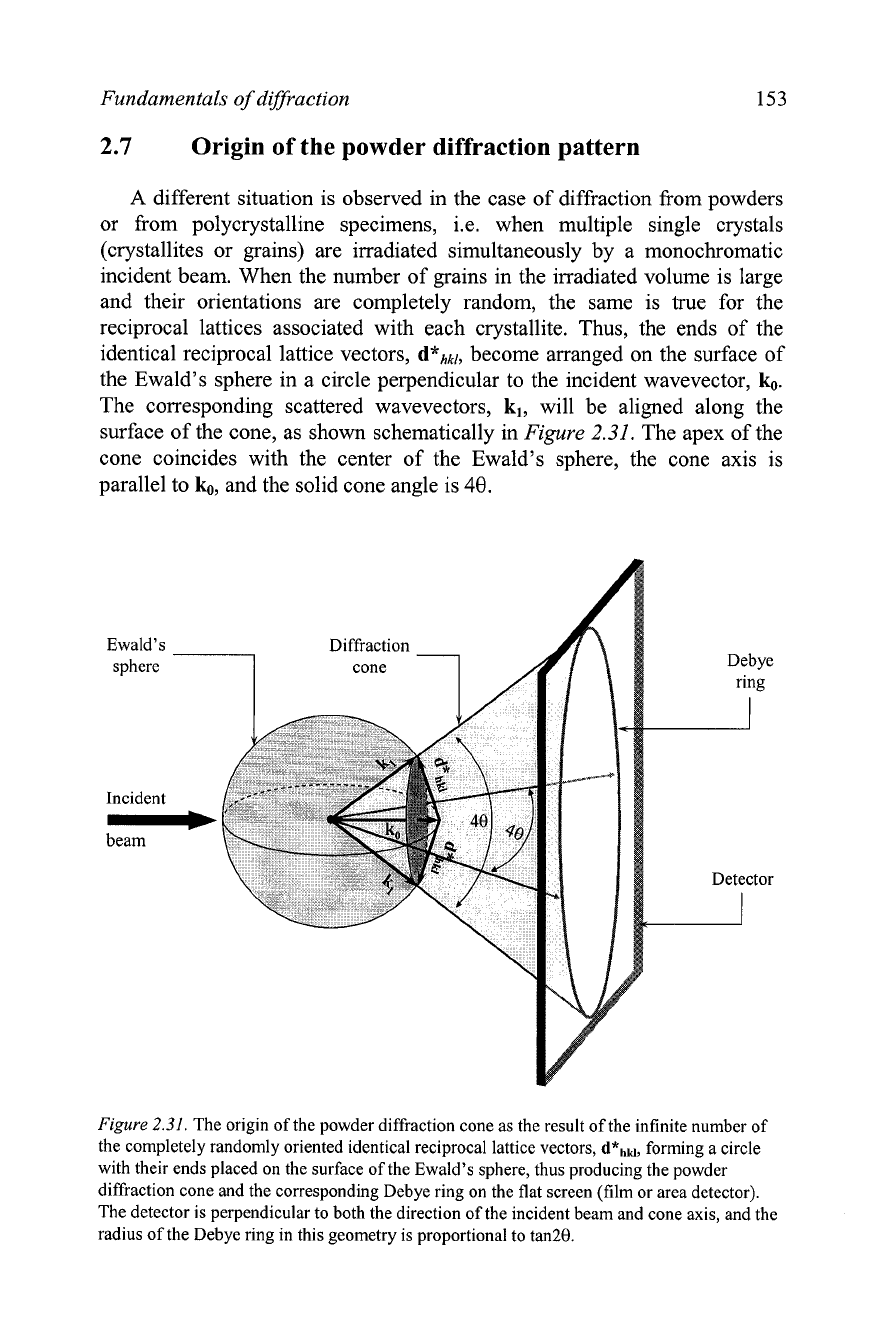
different situation is observed in the case of diffraction from powders
or from polycrystalline specimens, i.e. when multiple single crystals
(crystallites or grains) are irradiated simultaneously by a monochromatic
incident beam. When the number of grains in the irradiated volume is large
and their orientations are completely random, the same is
.true for the
reciprocal lattices associated with each crystallite. Thus, the ends of the
identical reciprocal lattice vectors,
d*hkl,
become arranged on the surface of
the Ewald's sphere in a circle perpendicular to the incident wavevector,
k,,.
The corresponding scattered wavevectors,
kl,
will be aligned along the
surface of the cone, as shown schematically in
Figure
2.31.
The apex of the
cone coincides with the center of the Ewald's sphere, the cone axis is
parallel to
k,,,
and the solid cone angle is
48.
Ewald's
-
sphere
Incident
beam
Figure
2.31.
The origin of the powder diffraction cone as the result of the infinite number of
the completely randomly oriented identical reciprocal lattice vectors,
d*hkl,
forming a circle
with their ends placed on the surface of the Ewald's sphere, thus producing the powder
diffraction cone and the corresponding
Debye ring on the flat screen (film or area detector).
The detector is perpendicular to both the direction of the incident beam and cone axis, and the
radius of the Debye ring in this geometry is proportional to tan28.
154
Chapter
2
Assuming that the number of crystallites approaches infinity (the
randomness of their orientations has been postulated in the previous
paragraph), the density of the scattered wavevectors,
k,,
becomes constant
on the surface of the cone. The diffracted intensity will therefore, be constant
around the circumference of the cone base or, when measured by a planar
area detector as shown in
Figure
2.31, around the ring, which the cone base
forms with the plane of the detector. Similar rings but with different
intensities and diameters will be formed by other independent reciprocal
lattice vectors, and these are commonly known as the
Debye rings.'
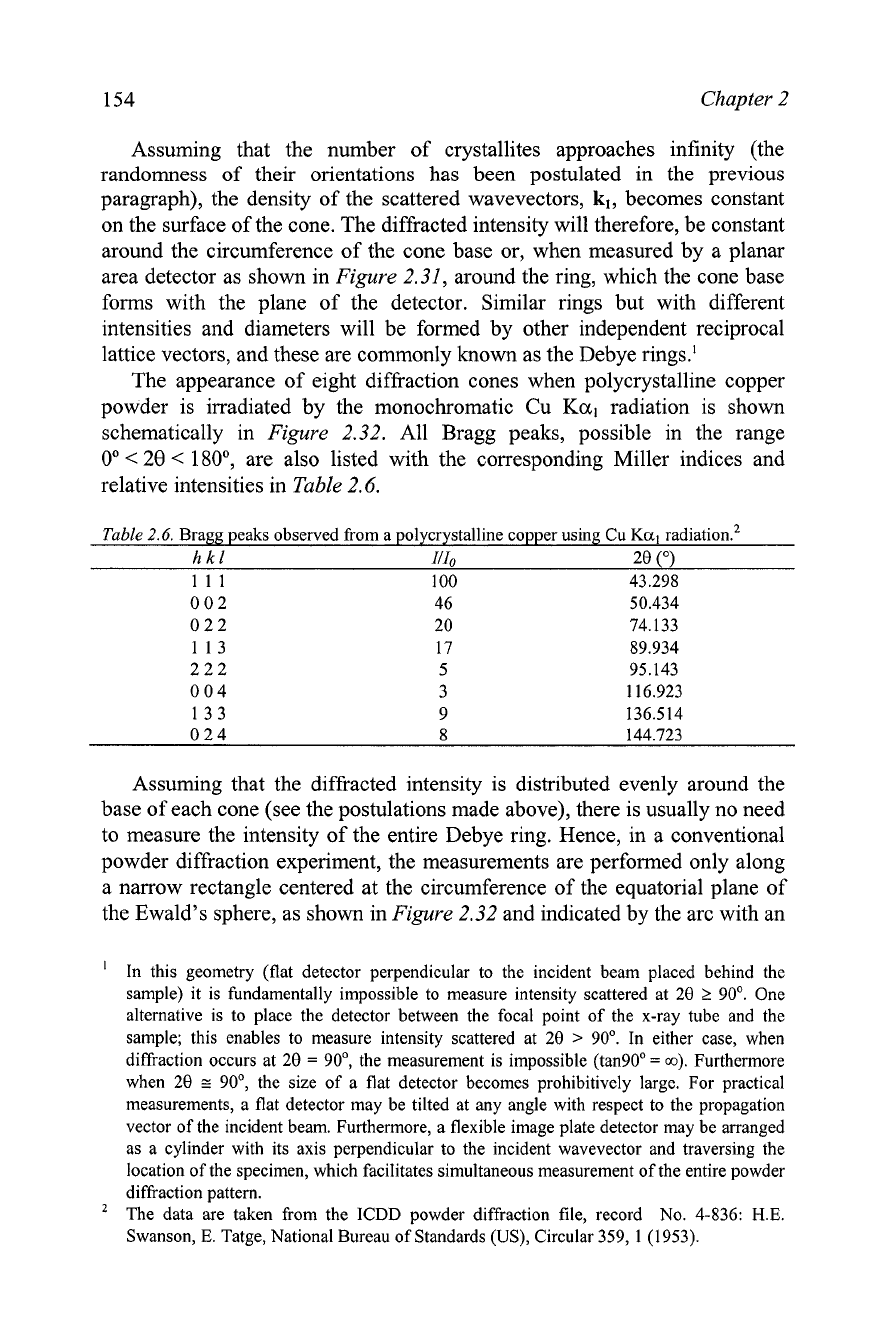
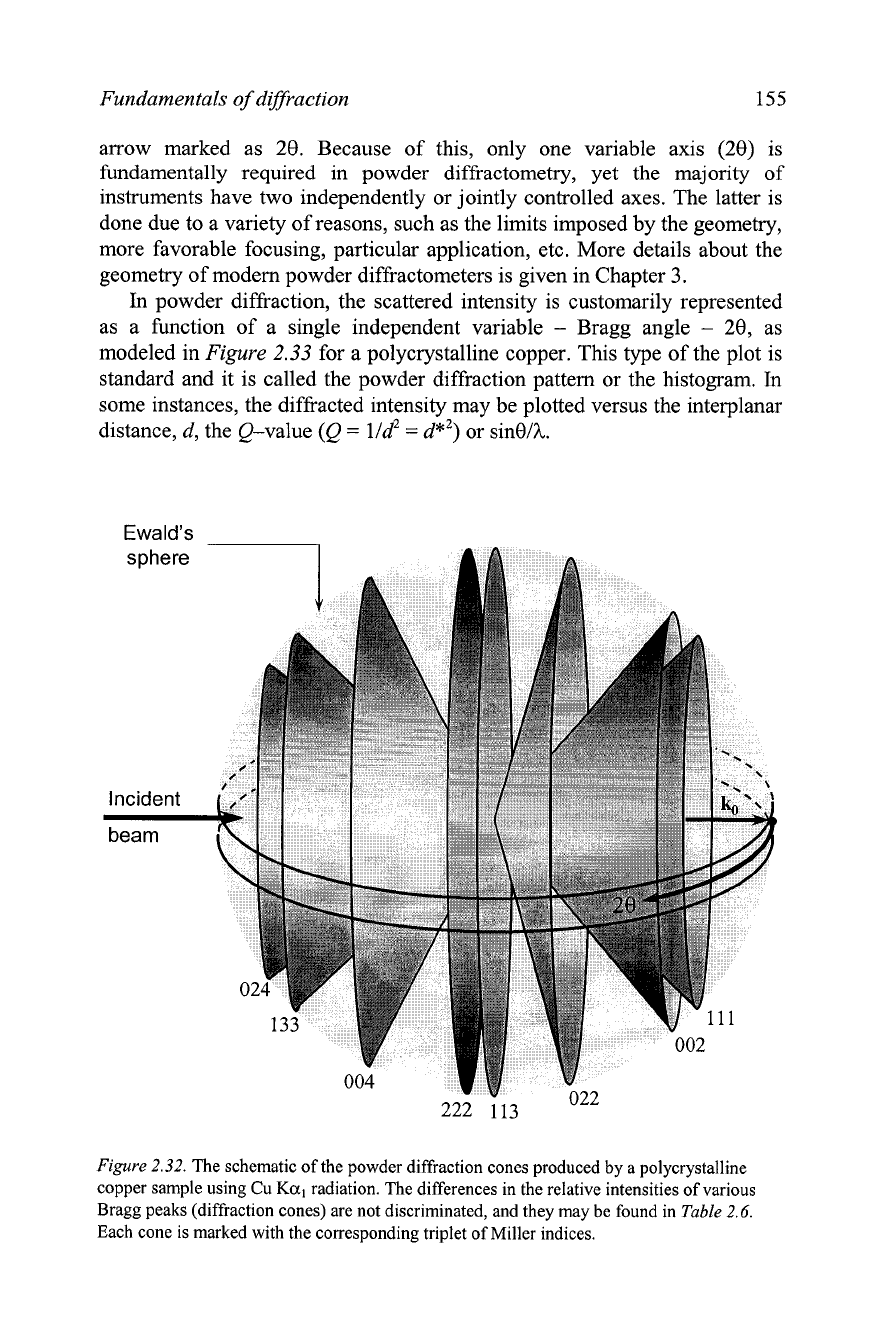
The appearance of eight diffraction cones when polycrystalline copper
powder is irradiated by the monochromatic Cu
Ka,
radiation is shown
schematically in
Figure
2.32. All Bragg peaks, possible in the range
0"
<
28
<
180•‹, are also listed with the corresponding Miller indices and
relative intensities in
Table
2.6.
Table
2.6.
Bragg peaks observed from a polycrystalline copper using Cu
Kal
radiatiom2
hkl
IIIo
20
(0)
111 100 43.298
002 46 50.434
0 2
2
20 74.133
113 17 89.934
2 2 2 5 95.143
004 3 116.923
133 9 136.514
024
8
144.723
Assuming that the diffracted intensity is distributed evenly around the
base of each cone (see the postulations made above), there is usually no need
to measure the intensity of the entire
Debye ring. Hence, in a conventional
powder diffraction experiment, the measurements are performed only along
a narrow rectangle centered at the circumference of the equatorial plane of
the Ewald's sphere, as shown in
Figure
2.32 and indicated by the arc with an
'
In this geometry (flat detector perpendicular to the incident beam placed behind the
sample) it is fundamentally impossible to measure intensity scattered at
20
2
90'.
One
alternative is to place the detector between the focal point of the x-ray tube and the
sample; this enables to measure intensity scattered at
20
>
90'.
In either case, when
diffraction occurs at
20
=
90•‹,
the measurement is impossible
(tan90•‹
=
m).
Furthermore
when
20
G
90•‹,
the size of a flat detector becomes prohibitively large. For practical
measurements, a flat detector may be tilted at any angle with respect to the propagation
vector of the incident beam. Furthermore, a flexible image plate detector may be arranged
as a cylinder with its axis perpendicular to the incident wavevector and traversing the
location of the specimen, which facilitates simultaneous measurement of the entire powder
diffraction pattern.
The data are taken from the ICDD powder diffraction file, record No.
4-836:
H.E.
Swanson,
E.
Tatge, National Bureau of Standards
(US),
Circular
359, 1 (1953).
Fundamentals of diffraction 155
arrow marked as 20. Because of this, only one variable axis (20) is
fundamentally required in powder diffractometry, yet the majority of
instruments have two independently or jointly controlled axes. The latter is
done due to a variety of reasons, such as the limits imposed by the geometry,
more favorable focusing, particular application, etc. More details about the
geometry of modem powder diffractometers is given in Chapter
3.
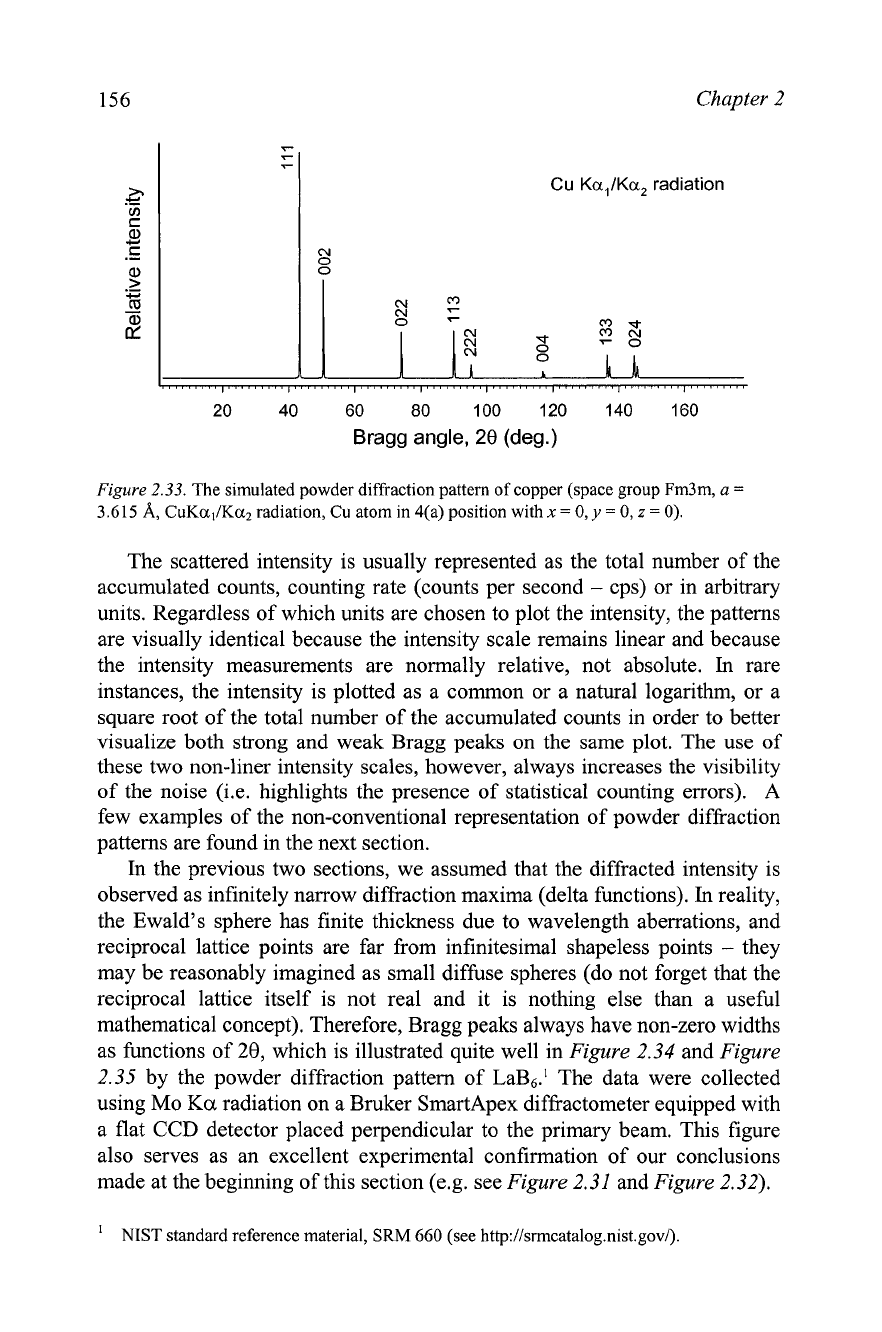
In
powder diffraction, the scattered intensity is customarily represented
as a function of a single independent variable
-
Bragg angle
-
20, as
modeled in Figure
2.33
for a polycrystalline copper. This type of the plot is
standard and it is called the powder diffraction pattern or the histogram.
In
some instances, the diffracted intensity may be plotted versus the interplanar
distance, d, the Q-value (Q
=
lld2
=
d*2) or sinelk.
Ewald's
sphere
Incident
beam
Figure
2.32.
The schematic of the powder diffraction cones produced by a polycrystalline
copper sample using Cu
Kal
radiation. The differences in the relative intensities of various
Bragg peaks (diffraction cones) are not discriminated, and they may
be
found in
Table
2.6.
Each cone is marked with the corresponding triplet of Miller indices.
Chapter
2
Cu
Ka,lKa,
radiation
20 40 60 80 100 120 140 160
Bragg angle,
28
(deg.)
Figure
2.33.
The simulated powder diffraction pattern of copper (space group Fm3m,
a
=
3.615
A,
CuKul/Ku2 radiation, Cu atom in 4(a) position with
x
=
0,
y
=
0,
z
=
0).
The scattered intensity is usually represented as the total number of the
accumulated counts, counting rate (counts per second
-
cps) or in arbitrary
units. Regardless of which units are chosen to plot the intensity, the patterns
are visually identical because the intensity scale remains linear and because
the intensity measurements are normally relative, not absolute.
In
rare
instances, the intensity is plotted as a common or a natural logarithm, or a
square root of the total number of the accumulated counts in order to better
visualize both strong and weak Bragg peaks on the same plot. The use
of
these two non-liner intensity scales, however, always increases the visibility
of
the noise (i.e. highlights the presence of statistical counting errors).
A
few examples of the non-conventional representation of powder diffraction
patterns are found in the next section.
In
the previous two sections, we assumed that the diffracted intensity is
observed as infinitely narrow diffraction maxima (delta functions).
In
reality,
the Ewald's sphere has finite thickness due to wavelength aberrations, and
reciprocal lattice points are far from infinitesimal shapeless points
-
they
may be reasonably imagined as small diffuse spheres (do not forget that the
reciprocal lattice itself is not real and it is nothing else than a useful
mathematical concept). Therefore, Bragg peaks always have non-zero widths
as functions of
28,
which is illustrated quite well in
Figure
2.34 and
Figure
2.35 by the powder diffraction pattern of La&.' The data were collected
using Mo
Ka
radiation on a Bruker SmartApex diffractometer equipped with
a flat
CCD
detector placed perpendicular to the primary beam. This figure
also serves as an excellent experimental confirmation of our conclusions
made at the beginning of this section (e.g. see
Figure
2.31 and
Figure
2.32).
NIST standard reference material, SRM
660
(see
http://srmcatalog.nist.gov/).
Fundamentals of diffraction
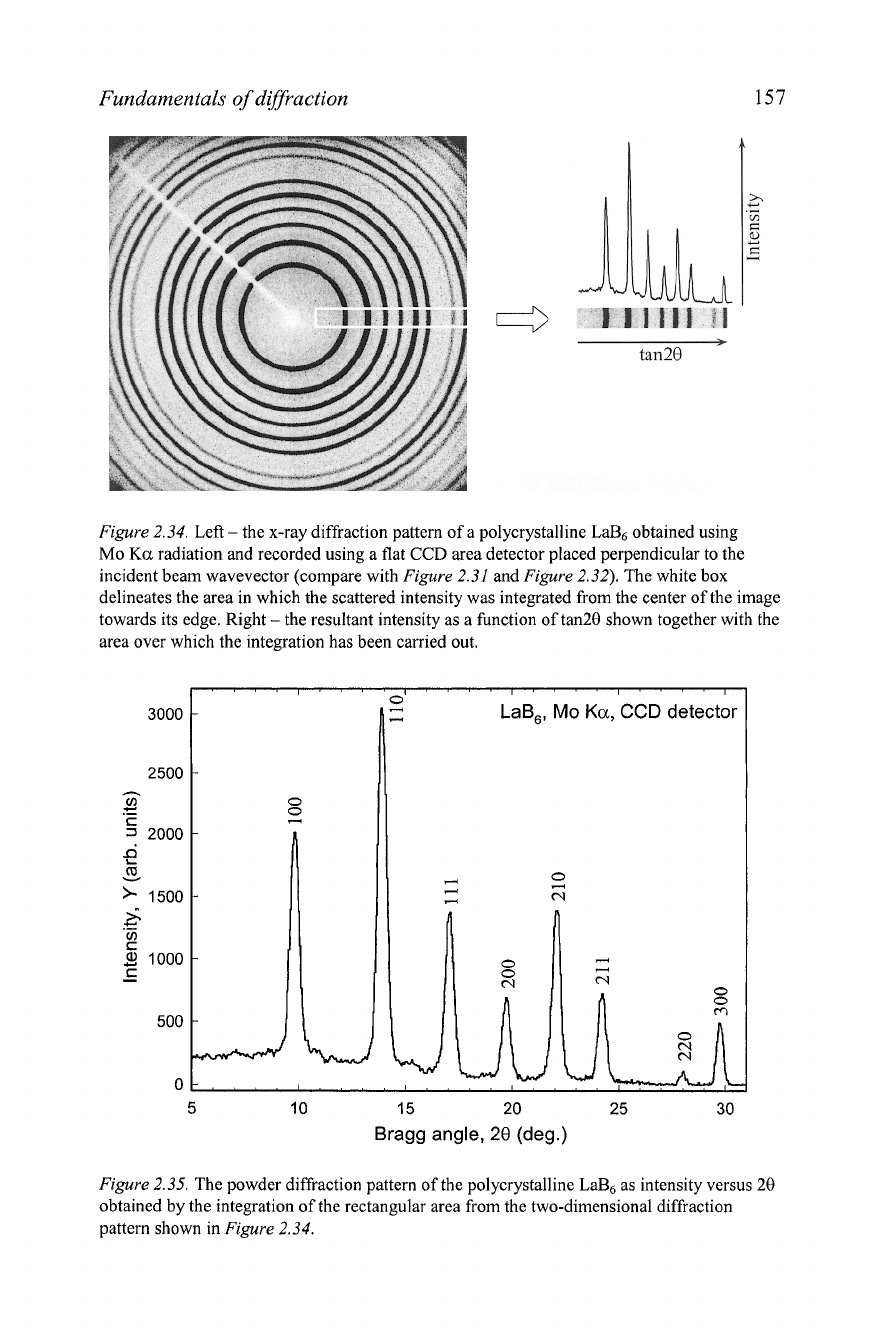
Figure
2.34.
Left
-
the x-ray diffraction pattern of a polycrystalline La& obtained using
Mo
Ka
radiation and recorded using a flat
CCD
area detector placed perpendicular to the
incident beam wavevector (compare with
Figure
2.31
and
Figure
2.32).
The white box
delineates the area in which the scattered intensity was integrated from the center of the image
towards its edge. Right
-
the resultant intensity as a function of tan28 shown together with the
area over which the integration has been carried out.
I'"'I'"'I
LaB,,
Mo
Ka,
CCD
detector
5
10
15
20
25
30
Bragg angle,
28
(deg.)
Figure
2.35.
The powder diffraction pattern of the polycrystalline La& as intensity versus 28
obtained by the integration of the rectangular area from the two-dimensional diffraction
pattern shown in
Figure
2.34.
158 Chapter 2
As shown in Figure 2.34, when diffraction cones, produced by the LaB6
powder, intersect with the flat detector placed perpendicularly to the incident
wavevector, they create a set of concentric
Debye rings. As in a typical
powder diffi-actometer, only a narrow band has been scanned and the result
of the integration is also shown in Figure 2.34 as the scattered intensity
versus tan29 (note, that the radial coordinate of the detector is tan29 and not
29). The resultant diffi-action pattern is shown in the standard format as
relative intensity versus
28
in Figure 2.35, where each Bragg peak is labeled
with the corresponding Miller indices.
It is worth noting that the diffractometer used in this experiment is a
single crystal diffractometer, which was not designed to take full advantage
of focusing of the scattered beam. As a result, the Bragg peaks shown in
Figure 2.35 are quite broad and the
Kalla2 doublet is unresolved even when
29 approaches
30'. As we will see in Chapter 3 (e.g. see Figure 3.37) a
much better resolution is possible in high resolution powder diffi-actometers,
where the doublet becomes resolved at much lower Bragg angles.
2.7.1
Representation of powder diffraction patterns
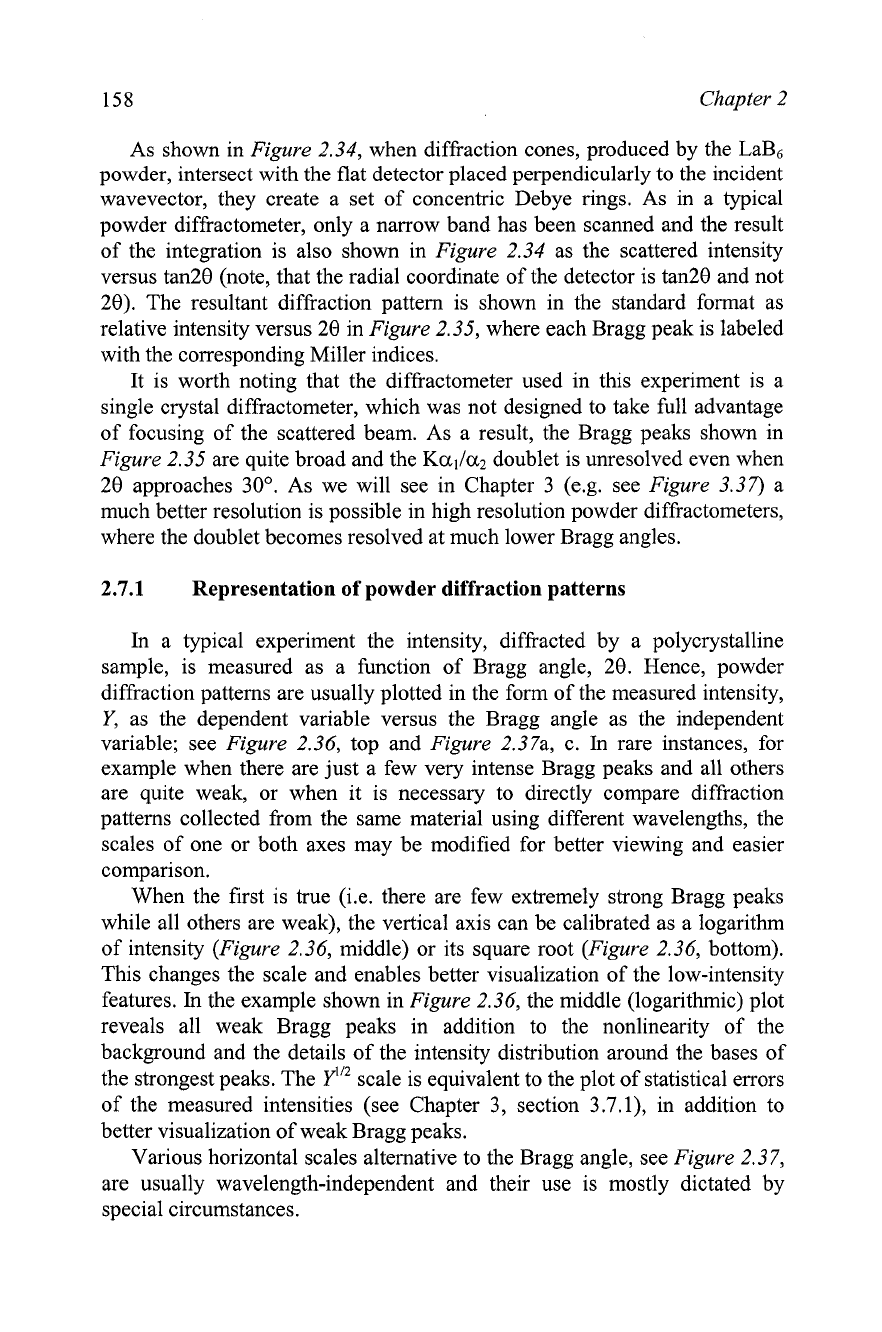
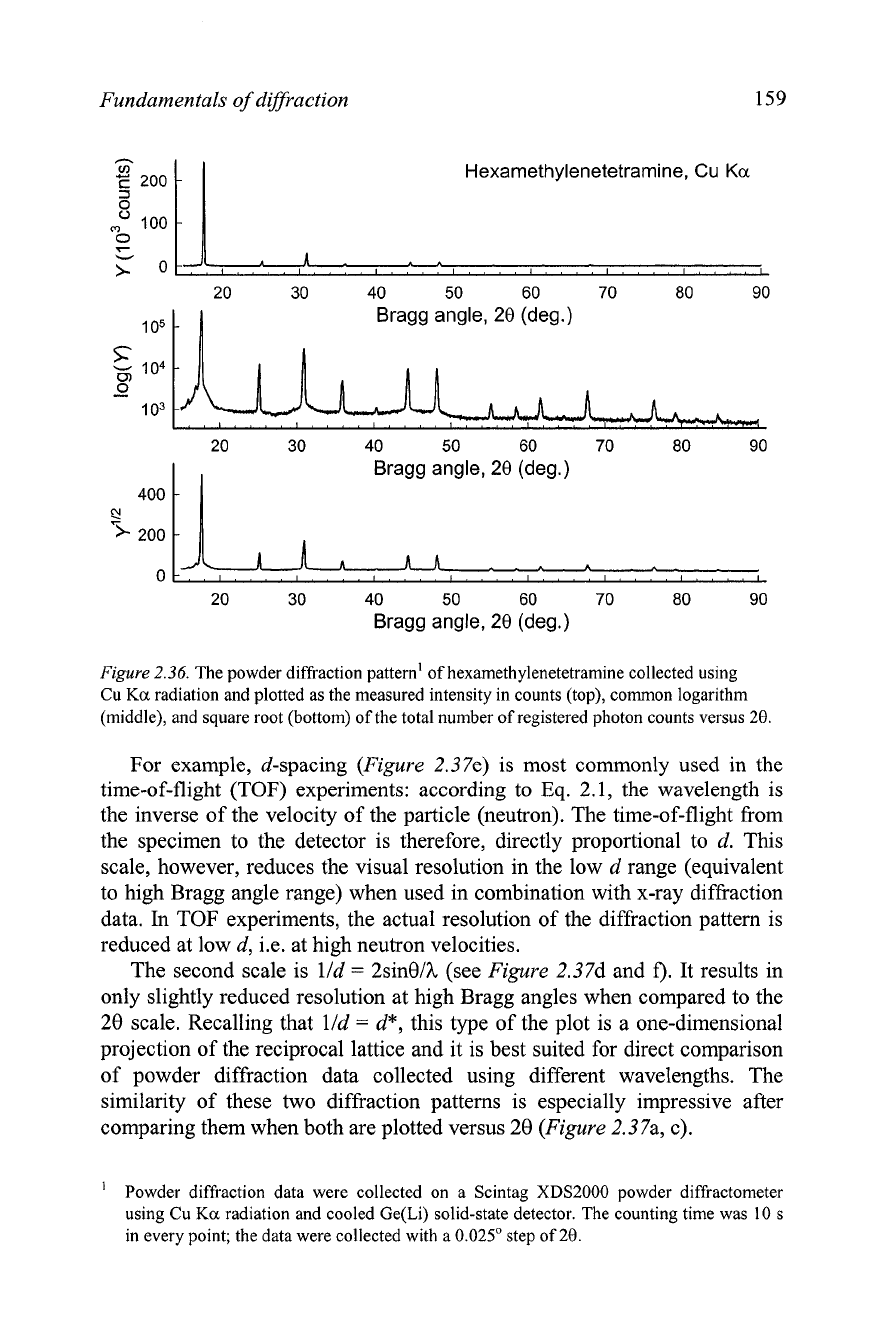
In a typical experiment the intensity, diffracted by a polycrystalline
sample, is measured as a function of Bragg angle, 29. Hence, powder
diffraction patterns are usually plotted in the form of the measured intensity,
Y, as the dependent variable versus the Bragg angle as the independent
variable; see Figure 2.36, top and Figure
2.37a, c. In rare instances, for
example when there are just a few very intense Bragg peaks and all others
are quite weak, or when it is necessary to directly compare diffraction
patterns collected from the same material using different wavelengths, the
scales of one or both axes may be modified for better viewing and easier
comparison.
When the first is true
(i.e. there are few extremely strong Bragg peaks
while all others are weak), the vertical axis can be calibrated as a logarithm
of intensity (Figure 2.36, middle) or its square root (Figure 2.36, bottom).
This changes the scale and enables better visualization of the low-intensity
features.
In
the example shown in Figure 2.36, the middle (logarithmic) plot
reveals all weak Bragg peaks in addition to the nonlinearity of the
background and the details of the intensity distribution around the bases of
the strongest peaks. The
Y'"
scale is equivalent to the plot of statistical errors
of the measured intensities (see Chapter 3, section 3.7.1), in addition to
better visualization of weak Bragg peaks.
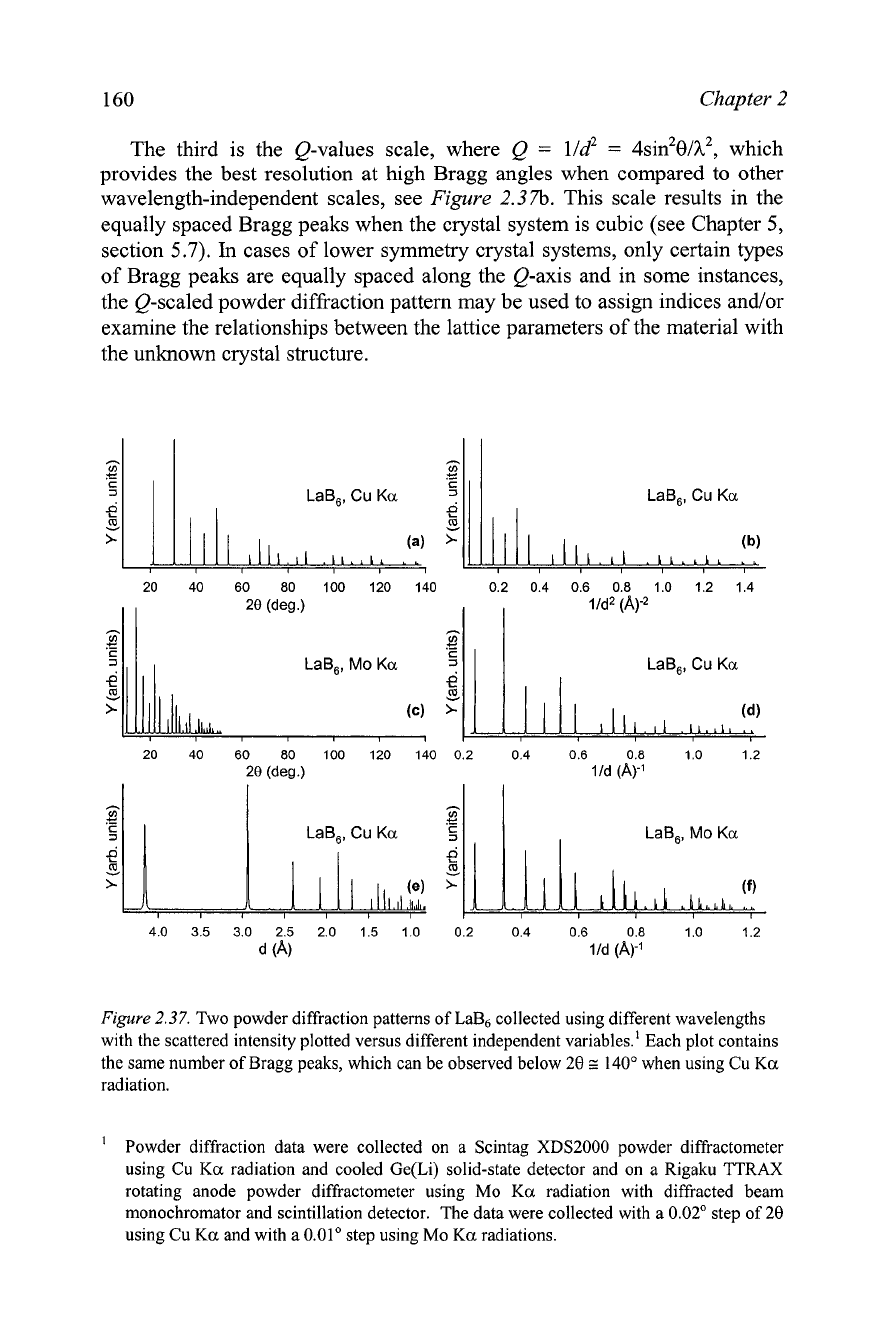
Various horizontal scales alternative to the Bragg angle, see Figure 2.37,
are usually wavelength-independent and their use is mostly dictated by
special circumstances.
Fundamentals of diffvaction 159
20 30 40 50 60 70 80 90
.Io5
t
I
Bragg angle, 28 (deg.)
20 30
40
50 60 70 80 90
Bragg angle, 29 (deg.)
C!
3-
200
20 30 40 50 60 70 80 90
Bragg angle, 28 (deg.)
Figure
2.36.
The powder diffraction pattern' of hexamethylenetetramine collected using
Cu Ka radiation and plotted as the measured intensity in counts (top), common logarithm
(middle), and square root (bottom) of the total number of registered photon counts versus
20.
For example, d-spacing (Figure 2.37e) is most commonly used in the
time-of-flight (TOF) experiments: according to Eq. 2.1, the wavelength is
the inverse of the velocity of the particle (neutron). The time-of-flight
from
the specimen to the detector is therefore, directly proportional to d. This
scale, however, reduces the visual resolution in the low d range (equivalent
to high Bragg angle range) when used in combination with x-ray diffraction
data.
In
TOF
experiments, the actual resolution of the diffraction pattern is
reduced at low d, i.e. at high neutron velocities.
The second scale is lld
=
2sin9lh (see Figure 2.37d and
f).
It results in
only slightly reduced resolution at high Bragg angles when compared to the
29 scale. Recalling that lld
=
d*, this type of the plot is a one-dimensional
projection of the reciprocal lattice and it is best suited for direct comparison
of powder diffraction data collected using different wavelengths. The
similarity of these two diffraction patterns is especially impressive after
comparing them when both are plotted versus 29 (Figure 2.3 7a, c).
'
Powder diffraction data were collected on a Scintag XDS2000 powder diffractometer
using Cu
Ka
radiation and cooled Ge(Li) solid-state detector. The counting time was 10 s
in every point; the data were collected with a 0.025' step of
20.
Chapter
2
The third is the Q-values scale, where Q
=
lld2
=
4~in~8/~~, which
provides the best resolution at high Bragg angles when compared to other
wavelength-independent scales, see
Figure
2.37b.
This scale results in the
equally spaced Bragg peaks when the crystal system is cubic (see Chapter
5,
section
5.7).
In
cases of lower symmetry crystal systems, only certain types
of Bragg peaks are equally spaced along the Q-axis and in some instances,
the Q-scaled powder diffraction pattern may be used to assign indices
andor
examine the relationships between the lattice parameters of the material with
the unknown crystal structure.
20 40 60 80 100
120 140
0.2 0.4
20
(deg.)
0.6 0.8
1.0
1.2
lld
(A)-'
Figure
2.37.
Two powder diffraction patterns of La& collected using different wavelengths
with the scattered intensity plotted versus different independent variables.' Each plot contains
the same number of Bragg peaks, which can be observed below
20
G
140" when using Cu
Ka
radiation.
'
Powder diffraction data were collected on a Scintag XDS2000 powder diffractometer
using Cu
Ka
radiation and cooled Ge(Li) solid-state detector and on a Rigaku
TTRAX
rotating anode powder diffractometer using Mo
Ka
radiation with diffracted beam
monochromator and scintillation detector. The data were collected with a 0.02' step of
20
using Cu
Ka
and with a 0.01" step using Mo
Ka
radiations.
