Paulo D.J. Surface Integrity in Machining
Подождите немного. Документ загружается.

2 Surface Texture Characterization and Evaluation Related to Machining 41
2.2 Surface Texture Parameters
A plethora of surface parameters has been adopted by international standards and
proposed in view of numerous research studies [1−4]. As aforementioned, this fact
is ascribed to the usually complex form of surface profiles, and on the other hand
to the need for the detailed description required in functional applications.
The parameters presented, with brief definitions and comments, in Sec-
tions 2.2.1 and 2.2.2 are mostly included in ISO 13565-2: 1997 standard, which is
based on the “M” (mean line system).
2.2.1 Arithmetic Parameters
Amplitude Parameters
• R
a
(CLA), arithmetic average roughness (center line average): the arithmetic
average value of filtered roughness profile determined from deviations about the
center line within the evaluation length; the most popular parameter for
a machining process and product quality control. This parameter is easy to de-
fine, easy to measure even in the least sophisticated profilometers and gives
a general description of surface amplitude. Though it lacks physical signifi-
cance, it is established in almost every national standard for measuring rough-
ness. On the other hand, it is insensitive to small variations in the profile and
gives no information on the in-length characteristics, also no distinction is made
between peaks and valleys.
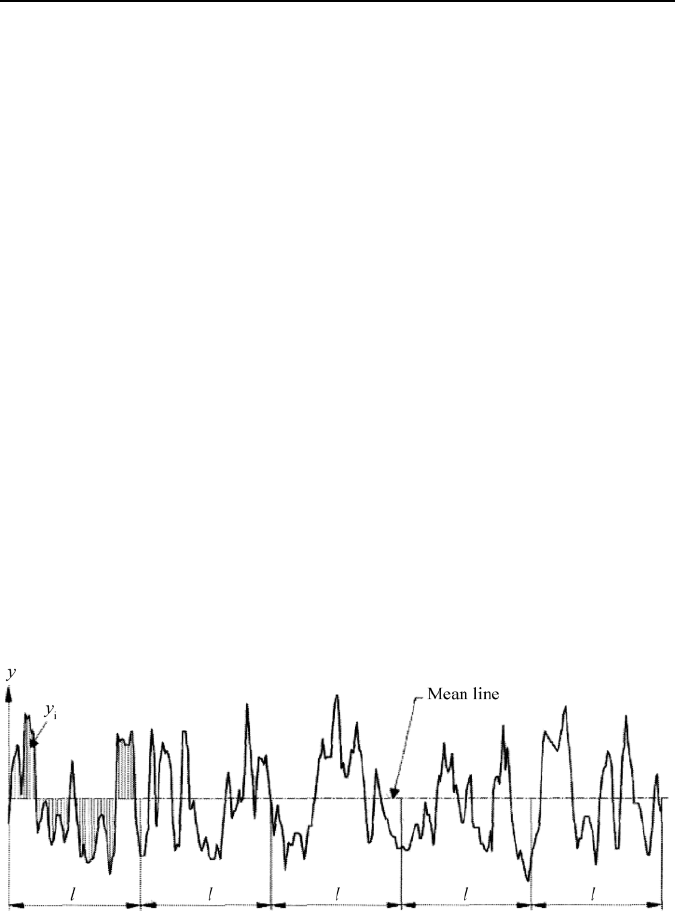
An indicative calculation of R
a
is shown in Figure 2.2.
Figure 2.2. Mean line system and definition of R
a
• R
t
, maximum peak to valley, the maximum peak to valley height of the filtered
profile over the evaluation length; it is very sensitive to large deviations from
the mean line and scratches. Very commonly used along with R
a
as a general in-
dicator.
• R
z
, average peak to valley height; it smoothens large deviations that are not
representative of the surface finish compared to R
t
.
42 G.P. Petropoulos, C.N. Pandazaras, J.P. Davim
• R
q
, root mean square or RMS roughness: the root mean square average of the
roughness profile ordinates; it is more sensitive to peaks and valleys than R
a
.
• R
p
, the value of the highest single peak above the center line; it is sensitive to
material removal from peaks.
• R
pm
, the mean leveling depth; it gives proper characterization of bearing and
sliding surfaces, and substrates to be coated.
• R
v
, the deepest valley below the center line; it is an indicator of oil retention or
the mechanical behavior of the surface under high stress.
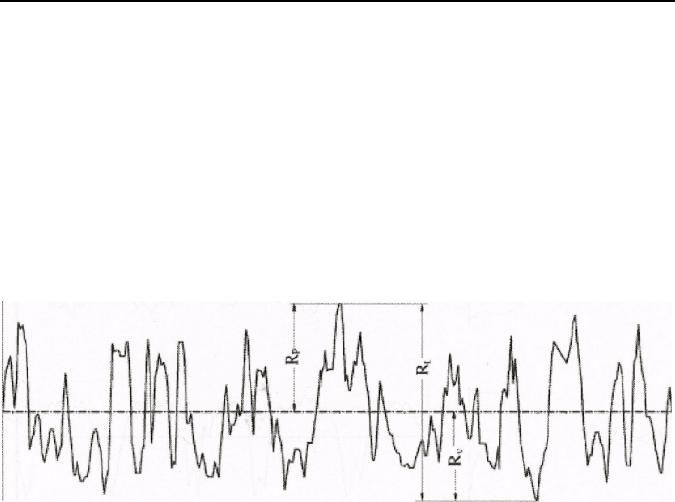
In Figure 2.3 the representation of different characteristics by R
t
, R
p
and R
v
is
shown.
Figure 2.3. Definition of the R
t
, R
p
and R
v
amplitude parameters
Spacing Parameters
• R
sm
, the mean spacing of the asperities at the level of the central line; it provides
approximation of the distance between successive peaks.
• λ
a
, the average wavelength in the profile; the principal wavelength of the profile
can be related to machining condition (feed, for instance).
• m, peak count: the number of profile peaks per unit length; it is useful in adhe-
sive and coating applications.
• n(0), number of intersections of the profile at the mean line; it gives rough in-
formation about the peak form.
Hybrid Parameters
• RΔ
a
, the average slope of the profile; it is closely associated with friction and
hydrodynamic lubrication.
• RΔ
q
, the root mean square slope of the profile; it is more sensitive than RΔ
a
to
drastic changes in the profile due to wear.
• r
p
, the average radius of asperities; a crucial parameter closely related to contact
mechanics, wear and fatigue.
• R
lo
, the developed length of the profile; it is a measure of the profile openness
related directly to the profile slope and is a useful parameter for coating applica-
tions.

2 Surface Texture Characterization and Evaluation Related to Machining 43
Surface Waviness
Surface roughness has attracted a lot of attention as an important machinability
parameter. Surface waviness is usually considered more as a symptom of malfunc-
tions in the machine tool system or poor machining, than a dependent machining
variable.
Regarding its characteristics it is characterized by introduction of equivalent to
roughness arithmetic and statistical function parameters in the corresponding stan-
dards.
• W
a
, mean value of the waviness of the unfiltered profile.
• W
t
, maximum value of the waviness of the unfiltered profile.
Both parameters should be considered in the case of severe vibration within the
machine tool or from an external source, or eccentricity of the tool or the work-
piece.
2.2.2 Statistical and Random Process Functions and Parameters
Surface texture analysis obtained by statistical and random process tools is more
sophisticated and of scientific foundation than evaluation by arithmetic parameters.
Considering that a real profile y(x) of a machined surface is one out of a statisti-
cal ensemble of possible profiles, it can be represented by a random process that
can be sufficiently described by two functions; the height statistical distribution
function f(y) and the autocorrelation function R(λ) or equivalently by the spectral
density function or autospectrum S(ω), being the Fourier transform of R(λ).
The height distribution f(y) assigns a probability to some ordinate of the profile
to lie at a given depth in regard to the central line. The most widespread distribu-
tion model is typically a Gaussian distribution that matches with reasonable ap-
proximation a significant number of engineering surfaces. f(y) gives evidence and
sometimes characterization of the profile shape and is directly associated with
surface loading, wear, corrosion, etc. Interesting parameters are the central mo-
ments of first up to fourth order. The first-order central moment is the average
height R
a
and the second-order central moment stands for variance σ
2
(or R
q
=
σ
2
).
The third- and fourth-order central moments are skewness and kurtosis, accord-
ingly; both provide more information on the real profile form.
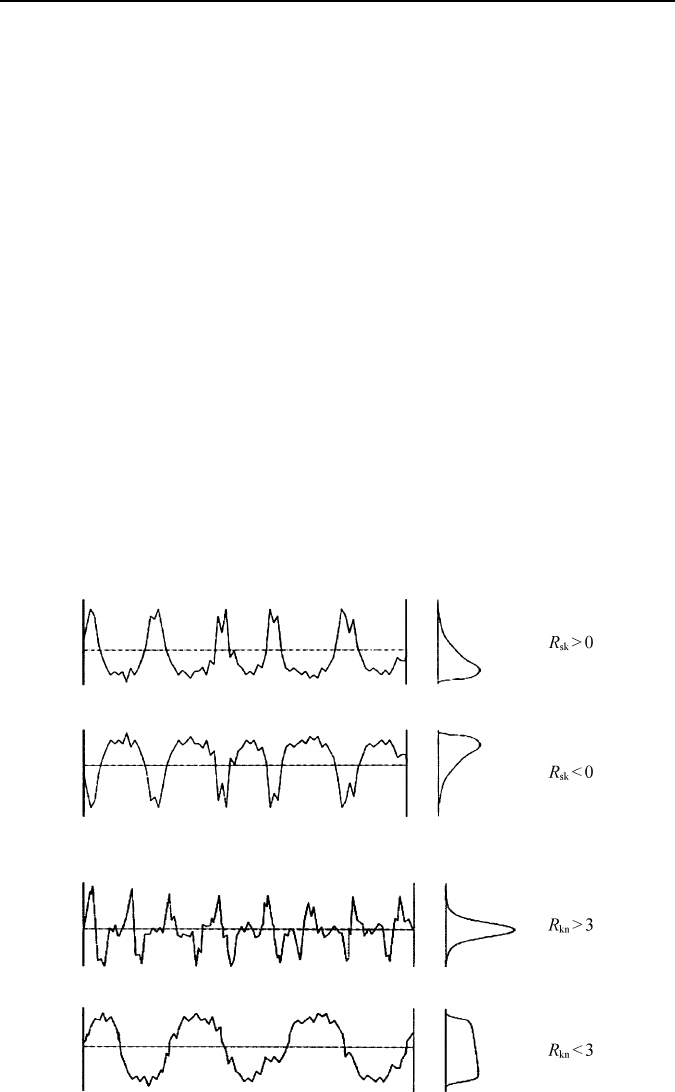
Skewness ζ (R
sk
=
ζ) evaluates the degree of asymmetry in cases of asymmetric
distribution and is characterized as positive or negative, relevantly. Surfaces “emp-
ty” of material exhibit positive skewness, whereas negative skewness is presented
by “full” surfaces. It is a significant parameter for tribological applications, such as
bearing surface functionality, wear control and others. A Gaussian distribution
presents ζ
=
0.
Kurtosis ξ (R
ku
=
ξ) describes the distribution sharpness and takes the value 3 for
the normal distribution. For ξ>3 the surface is dominated by sharp peaks (spiky),
whereas if ξ<3 the peaks are bumpy. In this regard, information is provided on the
real area of contact and wear resistance, it is also possible to detect the periodicity
of the profile (ξ<3).
44 G.P. Petropoulos, C.N. Pandazaras, J.P. Davim
Another aspect of the profile height statistical distribution is given alternatively
by the cumulative probability function P(y>h), which reflects the cumulative prob-
ability of a profile height to be higher than a given level h, below the higher profile
reference line. This function has a direct physical meaning, that of representing the
real material cross section at each level h and it is also called the bearing area
curve or Abbott
−
Firestone curve. Evidently, there is plenty of information pro-
vided by this curve about real contact and bearing capacity of surface.
The physical significance of R
sk
and R
ku
with regard to surface roughness is illus-
trated in Figures 2.4 and 2.5, respectively.
Every machining process, its mode and the conditions employed, imparts spe-
cific topographic features to technological surfaces. Thus, the cutting process will
directly affect the bearing curve features. However, the literature on the connection
of bearing ratio parameters to cutting conditions or to their interrelationship with
other surface roughness parameters is quite rare.
As an indicator of the Abbott curve of the profile, the R
tp
[%] bearing ratio pa-
rameter at 10% level below the upper reference line is usually used and is related
to probable run-in behavior and wear resistance of surfaces.
Towards a surface roughness classification, β (beta) and Fisher
−
Pearson statis-
tical systems have been proposed. Both possess the advantage of higher distinction
of profile components, periodic and random, that are rendered to the machining
method performed.
The determination of statistical distributions for the inclination and the curva-
ture (radius) of profile peaks contributes useful information on the shape of the
Figure 2.4. Oppositely signed values for skewness correspond to different surfaces
Figure 2.5. Different values of kurtosis reveal different surface features
2 Surface Texture Characterization and Evaluation Related to Machining 45
asperities and further, about the machining process (for instance, the form of the
tool nose during cutting), as well as the tribological behavior of the surface (elasto-
hydrodynamic lubrication, thermal contacts, etc.).
The autocorrelation function Ryy(λ) or R(λ) describes rigorously some surface
features and its form reveals periodic and random characteristics of the profile. It is
possible to analyze R(λ) into a declining exponential term that corresponds to the
random component and a trigonometric term that is relevant to a periodic compo-
nent. The initial slope and the dropping rate are also indicators of randomness.
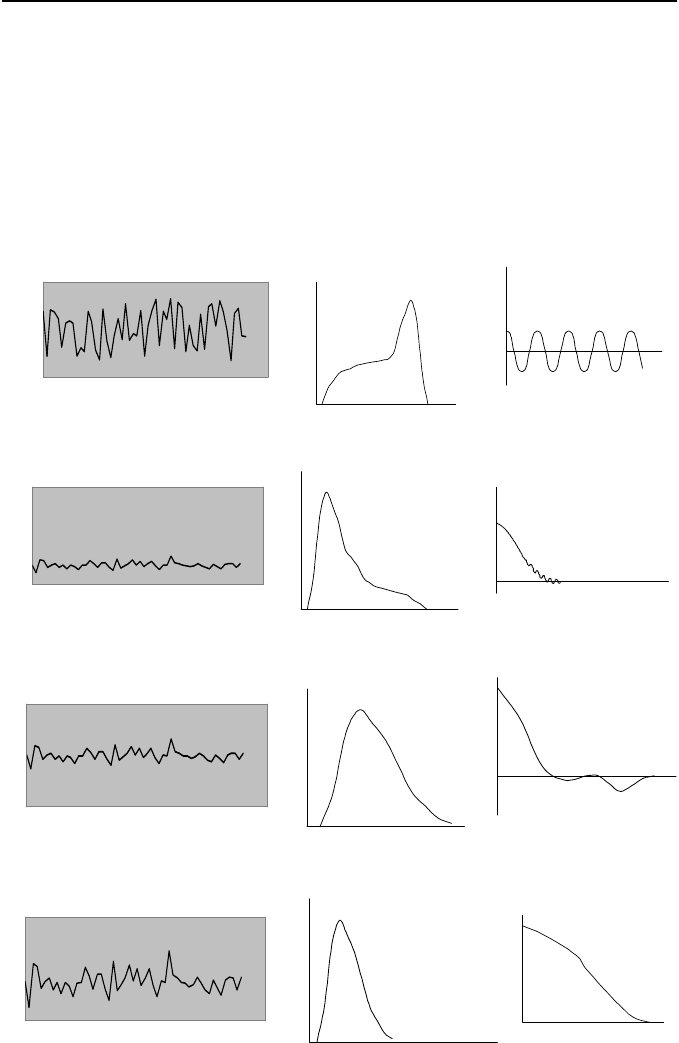
Different forms of autocorrelation along with the corresponding height distribu-
tion for different machining processes are shown in Figure 2.6.
μm 500 finish shaping
μm 20
f(z)
λ
r(λ)
Finish shaping (1.40 μm)
μm 100 finish turning
μm 5
f(z)
λ
r(λ)
Finish turning (1.0 μm)
μm 100 grinding
μm 5
f(z)
λ
r(λ)
Grinding (1.0 μm)
μm 20 supergrinding
μm 0,2
f(z)
λ
r(λ)
Supergrinding (0.18 μm)
Figure 2.6. Shapes of height distribution and autocorrelation functions for given machining
processes

46 G.P. Petropoulos, C.N. Pandazaras, J.P. Davim
Useful parameters of the autocorrelation function are:
• The correlation length λ* is defined as the necessary length for reducing R(λ) to
1/10 of its initial value R(0), which is also its maximal value. The physical in-
terpretation of λ* is that it expresses the minimal distance between two profile
points not interrelated; their generation is due to different causes during the ma-
chining operation or in the process of wear.
• The mean correlation wavelength λ
w
indicates the mean wavelength of the pro-
file asperities.
• In the case of three-dimensional illustration of the surface, the cross correlation
function R
xy
(λ) characterizes the orientation of the asperities in regard to the
third dimension (z).
The spectral density function Syy(ω) constitutes an equivalent to the autocorre-
lation function, interconnected through a Fourier transform and expresses the spac-
ing profile characteristics in the frequency domain. It offers direct evaluation of the
periodic components of the profile under the form of discrete peaks.
The parameters for surface roughness analysis according to ISO 13565-2: 1997
standard are given in Table 2.2.
Table 2.2. The “conventional” ISO I13565-2: 1997
parameters
Parameter Description
R
a
Profile average height
R
t
Maximum profile height
R
q
Standard deviation of the profile height distribution
R
p
Maximum profile peak height
R
v
Maximum profile valley depth
R
DelA
Average slope of the profile
R
sk
Skewness of the profile height distribution
R
ku
Kurtosis of the profile height distribution
R
sm
Mean spacing of the profile
R
DelQ
Root mean square slope of the profile
R
z
Average maximum height of the profile
R
tp
Bearing length ratio of the profile
2.2.3 Other Morphological Parameters
The surface motif combination is a method of analyzing surface texture alter-
natively to the “M” system and was introduced in the French automotive industry
[5]. Now it is issued as an international standard, ISO 12085: 1996. It provides

2 Surface Texture Characterization and Evaluation Related to Machining 47
a graphical evaluation of a surface profile without filtering waviness from rough-
ness. A motif consists of the portion of a profile between two peaks and the final
combination of these motifs eliminates “insignificant” peaks and retains “signifi-
cant” ones. This method determines the upper points of the profile, which have
functional importance by an envelope-based algorithm.
Another function-oriented system of surface analysis was developed in Ger-
many (DIN 4776) and is now adopted in ISO 13565-2: 1996 to characterize strati-
fied textures like the honed surfaces in internal combustion engine cylinders [6]. It
is met many times in the technical literature as the “R
k
” parameter group (R
k
is the
first out of five parameters used). The concept is to describe the shape of the rele-
vant bearing (material ratio or Abbott) curves and to provide information on char-
acteristics at different portions of the surface profiles.
In Tables 2.3 and 2.4 the parameters proposed by the two aforementioned stan-
dards are listed.
Table 2.3. The motif (R & W) parameters
Parameter Description
R Average depth of roughness motifs
R
x
Maximum depth of roughness motifs
A
r
Average spacing of roughness motifs
W Average depth of waviness motifs
W
x
Maximum depth of waviness motifs
W
te
Maximum depth of the waviness profile
A
w
Average spacing of waviness motifs
K
r
Average slope of roughness motifs
K
w
Average slope of waviness motifs
P
t
Maximum depth of the raw profile
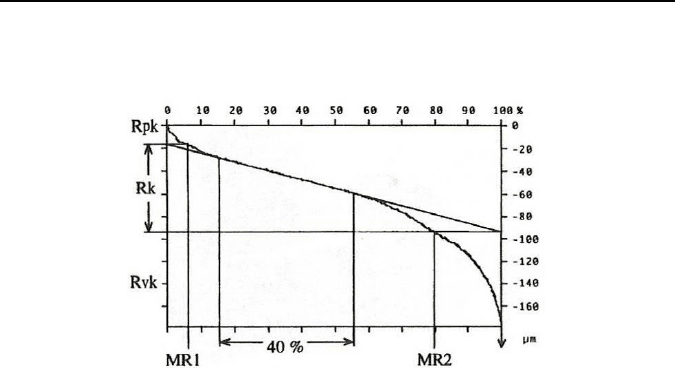
Table 2.4. The “R
k
” family of parameters
Parameter Description
R
k
Depth of the roughness core profile
R
pk
Top portion of the surface to be worn away
R
vk
Lowest part of the surface retaining the lubricant
MR1 Upper limit of the core roughness
MR2 Lowest limit of the core roughness
48 G.P. Petropoulos, C.N. Pandazaras, J.P. Davim
The representation of Abbott curves by the “R
k
” parameters is given in Fig-
ure 2.7.
Figure 2.7. Definition of “R
k
” parameters
2.2.4 Fractal Geometry Analysis
Fractal geometry is aimed at characterizing texture independently from the measur-
ing instrument and the evaluation length and such an analysis has been introduced
to render the microroughness of machined surfaces [7].
The main fractal parameters are fractal dimension D and topothesy L. To give
a physical definition of these parameters, the fractal dimension D is an intrinsic
property of the surface, which is scale independent and reflects the “complexity” of
the profile structure. The topothesy L is a characteristic length representing the
horizontal separation of profile heights corresponding to an average slope of one
radian; it takes very small values.
Furthermore, the description provided by a fractal at the microroughness level
may allow the control of the material properties and the type of the occurring chip
formation, desirable or unwanted accordingly. But fractals, as expected, cannot
provide a full-scale representation of a typical machined surface dominated by feed
marks, it ignores the geometry of the cutting edge, while it is sensitive to cracks
and microdefects.
2.2.5 ISO Standards on Surface Finish
• ISO 1302 – 2001 Indication of Surface Texture
• ISO 3274 – 1996 Nominal Characteristics of Contact (Stylus) Instruments
• ISO 4287 – 1997 Terms, Definition and Surface Texture Parameters
• ISO 4288 – 1996 Rules and Procedures for Assessment of Surface Texture
• ISO 5436-1 – 2000 Calibration, Measurement Standards
• ISO 5436-2 – 2000 Calibration, Soft Gages

2 Surface Texture Characterization and Evaluation Related to Machining 49
• ISO 8785 – 1999 Surface Imperfections – Terms, Definitions and Parameters
• ISO 11562 – 1996 Metrological Characteristics of Phase Correct Filters
• ISO 12179 – 2000 Calibration of Contact (Stylus) Instruments
• ISO 12085 – 1996 Surface Roughness and Waviness – Motif Method
• ISO 13565-2 – 1996; Geometrical Product Specifications (GPS) − Surface tex-
ture: Profile method; Surfaces having stratified functional properties − Part 2:
Height Characterization using the linear material ratio curve.
2.3 Shape Characterization of Surface Roughness Profiles
High functional requirements nowadays imply the control of profile shapes every
manufacturing process imparts on the surface. Characteristics like periodicity or
randomness, “emptiness” or “fullness” of the profile play an important role.
The following parameters, parameter ratios and functions are proposed and/or
established to be sensitive in profile form [8]. They will be briefly discussed in
view of their distinctive power and tribological significance.
Arithmetic Amplitude Parameters
These parameters cannot be considered alone, as they do not give information
about the shape of the profile. Some combined ratios have been proposed though,
as follows:
a) R
a
/R
q
: for the extreme theoretical cases of a sinusoidal and a random profile
conforming to the Gaussian distribution this ratio takes the values 0.9003 and
0.7979, respectively; this ratio is simply indicative.
b) R
p
/R
t
: provides only general information on the “emptiness” or “fullness” of the
surface, and is related to skewness of the profile height distribution
c) K: is called the solidity surface ratio, which is defined as K = (R
t
− R
p
)/R
t
and is
associated with skewness.
Spacing parameters
a) R
sm
: a characteristic magnitude in periodic profiles (e.g., turning, milling),
where it corresponds to the feed rate value employed.
b) λ
a
: gives relevant information with S
m
. It can be used as a general measure of the
mean distance of asperities on random profiles.
c) n(0): detects existing periodicity of the profile without providing further infor-
mation.
d) m: is correlated with n(0) and directly to the machining process.
All three aforementioned parameters describe the number of microcontacts from
the tribological standpoint.

50 G.P. Petropoulos, C.N. Pandazaras, J.P. Davim
Hybrid Parameters
a) R
Δa
: is possible to characterize the machining process and is affected by the
machining conditions, but does not determine the profile shape sufficiently.
b) r: is affected to a similar degree by the machining process, but does not describe
particular profile features.
c) R
lr
: the developed profile length to evaluation length ratio is connected to the
profile openness and controls the corrosion resistance; by definition, it is pro-
portional to R
Δa
.
All these parameters, however, may describe indirectly the shape of the profile
peaks.
Statistical Parameters
a) Profile height distribution
The form of this statistical function is very important as it is sensitive to the geo-
metric features of the surface and to their variation. Multiparameter statistical sys-
tems like log-normal, beta, and Fisher–Pearson are used to model a variety of pro-
file shapes and could contribute to any acceptable typology of machined surfaces.
Apart from the shape of the distribution, the corresponding statistical moments are
evaluated:
The standard deviation σ is equal to the R
q
parameter. The third- and fourth-
order moments – skewness and kurtosis – express geometric and physical features
of the surface, respectively. The skewness controls the amount of existing material
in the surface against voids. Kurtosis defines the sharpness of the peaks of the
asperities. Low kurtosis values correspond to broad tips, whereas the opposite
characterizes sharp “hills”.
b) Bearing area or Abbott curve
This is equivalent to the cumulative probability of the profile heights and is di-
rectly related to the surface tribological behavior, and particularly, with the real
contact area, asperities strength, and wear. The bearing area curve has been widely
used in recent studies, and with the introduction of a relatively new standard, it can
easily distinguish between random and periodic profiles and give functional de-
scriptions by the “R
k
” parameters (ISO 13565-2: 1997).
c) Autocorrelation function and autospectrum
• The profile autocorrelation function permits the qualitative discrimination of
periodic and random components. The first attempt made towards surface typol-
ogy.
• by Peklenik [19] defined five different autocorrelation forms, with the extreme
cases corresponding to sinusoidal band white noise, respectively.
• The autocorrelation length β* denotes the minimal distance between profile
characteristics of different origin.
• The spectral density function, or autospectrum, enables the quantitative assess-
ment of the various profile components, periodic and random, and is the Fourier
transform of the autocorrelation function. Strongly periodic profiles, for in-
stance, are characterized by the fundamental component (at the feed value), fol-
lowed by a series of higher harmonics.