Marulanda J.M. (ed.) Electronic Properties of Carbon Nanotubes
Подождите немного. Документ загружается.

28
STM Observation of Interference Patterns near
the End Cap and Its Application to the Chiral
Vector Determination of Carbon Nanotubes
Tadahiro Komeda
1
and Masayuki Furuhashi
2
1
Tohoku University
2
Osaka Univversity
Japan
1. Introduction
There is a rising demand for the development of alternative materials used for the electronic
devices. This is partially due to the difficulties in a further miniaturization of current silicon-
based transistors. Carbon nanotube (CNT) is considered as the most prominent candidate
for this purpose (Joachim et al., 2000, Tans et al., 1997, Saito et al., 1998). The electronic
property of the CNT can be regarded as a combination of those of a molecule and a solid-
state bulk material, which appears as a quantum mechanical behavior at a relatively high
temperature including the ballistic conductivity (Javey et al., 2003). The realization of these
novel phenomena would be the key for the CNT to be widely used in real applications.
For these demands, it requires precise controls of the electronic states whose size reaches to
the spatial structure of the electronic wavefunctions. It cannot be realized without a precise
measurement of those properties, but there are not many characterization tools with the
required resolution.
Scanning tunneling microscopy (STM) has played an important role in atomic scale
characterization. It has been known that the CNT becomes metallic or semiconductive
depending on the wrapping of the CNT, which is often cataloged by its chirality. Despite its
importance, a technique for its precise measurement is not well established. This is partially
because conventional diffraction techniques like as low-energy electron diffraction (LEED)
or reflection high-energy electron diffraction (RHEED) cannot be applied to the
characterization of molecule like CNT tubes.
The atomic scale resolution of STM enables an estimation of the internal structure of the
CNT, which has been employed to the determination of the chirality. However, a precise
determination of the chirality is not an easy task. STM can also detect the electronic structure
in addition to the structural characterization. A clear example can be seen in the observation
of the standing wave formed by the interference of an electronic state of CNT, which is an
appearance of the wavefunctions. (Lemay et al., 2001, Venema et al., 1999) Using this
technique, the band structure of the CNT has been determined. (Ouyang et al., 2002, Lee et
al., 2004)
Here in this chapter, we discuss the STM measurements focusing on the superlattice
structures detected near the end-cap of the CNT. We combine high-resolution STM imaging

Electronic Properties of Carbon Nanotubes
626
and several types of simulation methods both for metallic and semiconducting CNT
(Furuhashi et al., 2007, Furuhashi et al., 2008).
This study is intended partially for the basic understanding of the mechanism how the
interference pattern is formed, unveiling the underlying physics of the complex pattern
observed at the end of CNT. Other important issue is an application to the precise
determination of the chirality of the CNT. For a determination of the atomic ordering, the
analysis of the interference pattern often gives more precise information than the real-space
image, as has been demonstrated with other microscopes. We like to apply the observation
of the interference pattern near the end of the CNT to the precise determination of the
chirality utilizing the sensitivity of the reflection patterns. We like to discuss the possibility
of the application of this technique to a precise determination of the chirality of CNT.
2. STM observation of CNT
In this section we show the STM imaging of the CNT, which is usually executed by
transferring the CNT on a metal surface. First we describe the experimental procedure for
the STM observations. Second we show the actual observed STM images both on the
metallic and semiconductive CNT (Furuhashi et al., 2007, Furuhashi et al., 2008).
2.1 Experimental set-up of STM observation of CNT
We performed STM measurement on CNT deposited on an Au(111) surface. The substrate
was atomically flat Au(111) thin film which was evaporated on a mica surface at 480°C in a
homebuilt evaporation system. The gold surface was cleaned by repeated cycles of Ar
+
sputtering and annealing before CNT deposition in ultra high vacuum (UHV). We
confirmed characteristic herringbone reconstruction on the cleaned gold surface by STM.
Purified single-wall CNTs (SWCNTs) from Carbon Nanotechnologies Incorporated were
used as a sample, which was formed by HiPco method (Nikolaev et al., 1999). After the
SWCNTs were dispersed in 1, 2-dichloroethane with ultrasonic agitation for 1h, a droplet of
the solution was deposited on the Au(111) substrate in air, which was cleaned in the UHV
chamber and take out of it just before the deposition. The sample was then dried with pure
nitrogen gas and returned to the UHV chamber. In the UHV condition, the sample was
annealed at 220 °C for 1 hour in order to remove residual solvent. (Furuhashi et al., 2007)
For the STM measurement, we used JEOL JSTM-4500XT in which the observation was done
at liquid nitrogen temperature. STM tips were electrochemically etched W wires, which
were annealed at 800 °C in the UHV chamber for the removal of tungsten oxides.
Topographic images were obtained by a constant current mode. Current-voltage (I-V)
spectra were taken by recording tunneling current as sweeping bias voltage applied to the
sample with feedback-loop opened.
2.2 STM images of CNT
CNT is a graphene sheet wrapped in a cylindrical shape. Thus, in order to discuss the STM
image of CNT, we should check the observed STM images of the materials composed of the
graphene sheet.
The atomic structure of the graphene layer is illustrated in Fig. 1(a). The unit cell is defined
by the two vectors a
1
and a
2
, which includes two carbon atoms. The lengths of both vectors,
depicted a hereafter, are √3 times of the nearest neighbor distance (nnd) of the carbon atoms
(a = 0.246 nm).
STM Observation of Interference Patterns near the End Cap
and Its Application to the Chiral Vector Determination of Carbon Nanotubes
627
The most studied material is the graphite in which the graphene sheets are stacked.
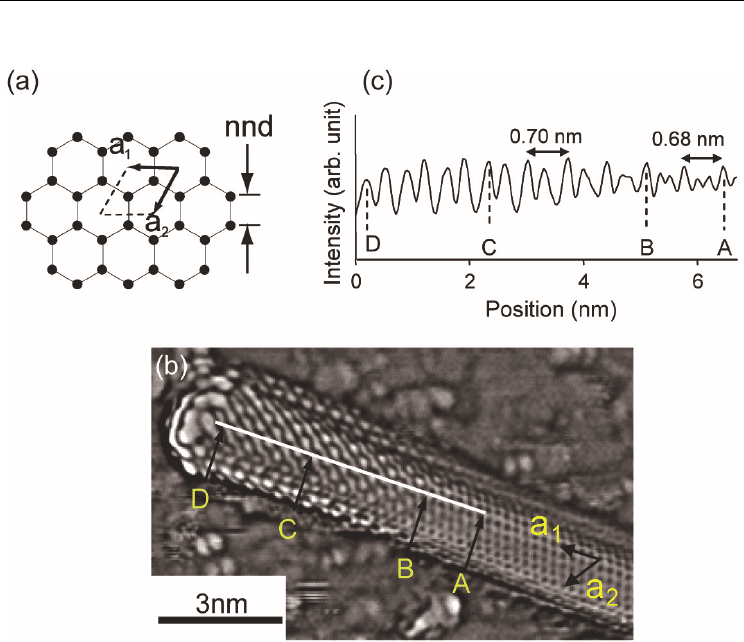
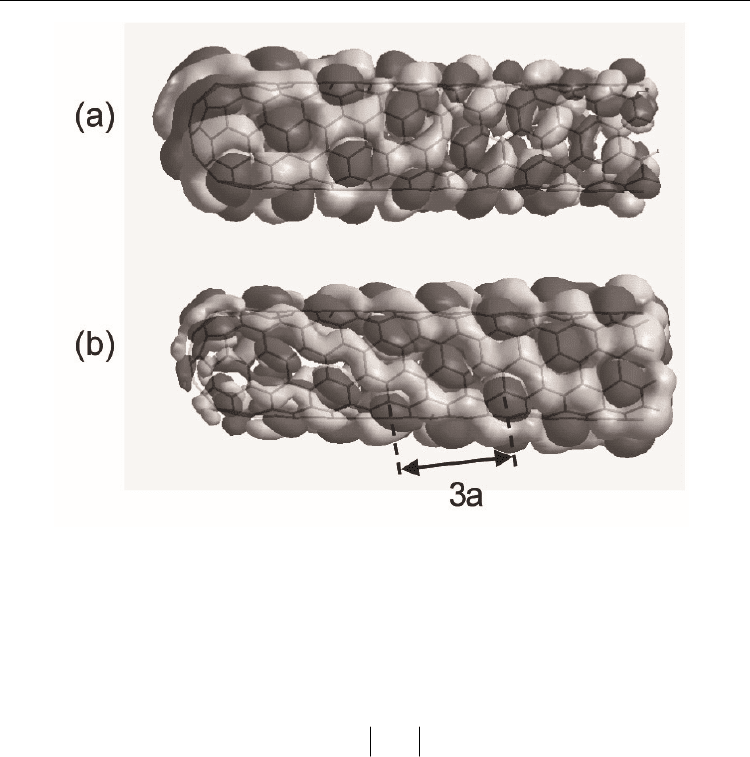
Fig. 1. STM image of armchair-like CNT (a) The atomic structure of the graphene layer. (b)
Derivative STM image of a capped (28, -13) nanotube. The letters A, B, C, and D correspond
to the positions in (c). (c) The line profile along the highlighted line in (b). A is the starting
point of the superlattice structure and two small peaks merge at B. The distance between
large peaks in AB is 0.68 nm. The period of paired peaks in BD is 0.70 nm. The intensity of
paired two peaks becomes nearly same at C.
Though the carbon atoms are ordered in a honeycomb shape in the graphite layer, the
observed STM image shows a close-packed, three-fold symmetry structure. The discrepancy
has been explained by the influence of the subsurface layer. The density of states (DOS) at
the carbon atom of the top layer changes depending on whether it has a carbon atom just
beneath in the second layer. Thus the carbon atoms appear as bright protrusions in an
alternative manner in the STM image, forming a three-fold, close-packed structure with a
periodicity of a (Batra et al., 1987). In the STM image of the single-layer graphene, such an
effect cannot appear and a honeycomb shape structure appears in the STM image.
Figure 1(b) shows an atomically resolved derivative topographic image of a semiconductive
CNT, which was taken at 100 pA and 0.6 V. The 'bulk' area shows a periodic grid pattern,
where dark spots correspond to the centers of hexagons. The ordering of these spots can be
described by using unit vectors (see Fig. 1(a)). Here we define a
1
and a
2
in the directions
Electronic Properties of Carbon Nanotubes
628
shown in Fig. 1(b). The measured length does not really reproduce expected a, 0.22 nm
along a
1
and 0.27 nm along a
2
. The discrepancy from a of 0.25 nm is due to the geometrical
configuration of STM tip and cylindrical CNT surface in which the carbon atoms are
positioned on a curved surface (Venema et al., 2000, Meunier et al., 1998). Since a slight
geometrical difference is not important in our discussion, no correction of the distortion of
the STM images was executed. The end of the CNT has a round shape, and is probably
capped by one of the hemispheric fullerene family members.
Characteristic parallel wavy lines appear within 6−7 nm from CNT end. The height-profile
is measured along the line A-D which is parallel to a
1
(see Fig. 1(c)). In the region between A
and B, we see a characteristic features, i.e., two small peaks were sandwiched between larger
peaks. These small peaks become merged in the region between B and D. The periodicity of
the large peaks is ~0.68-0.70 nm in the whole region, which should correspond to ~3a. We
consider the periodicity is derived from the Fermi wavelength, which is estimated as three
times of the unit vector of the graphene (Saito et al., 1998).
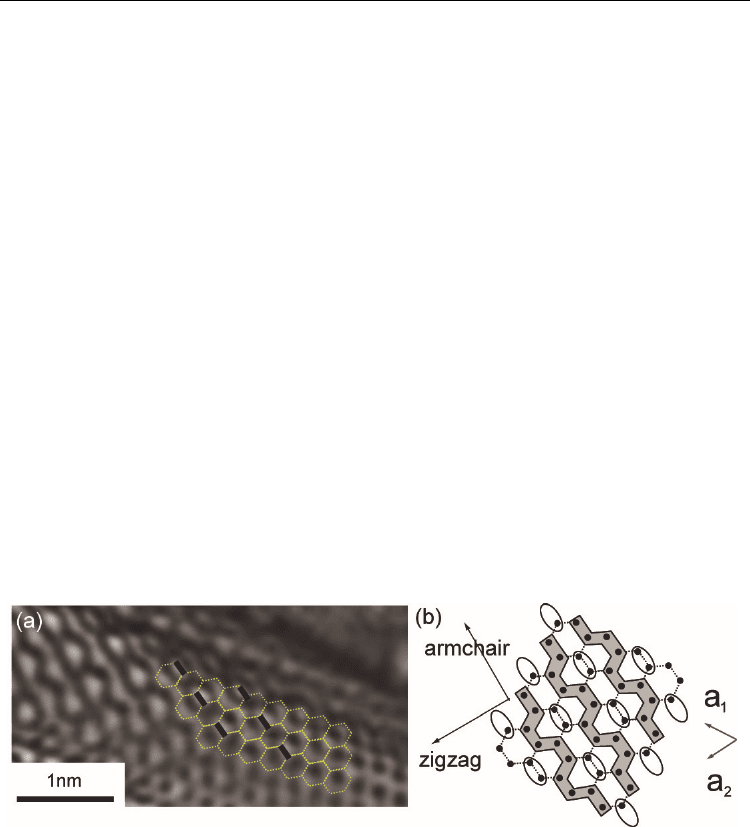
Figure 2(a) shows an enlarged image of Fig. 1(b) at the interface region of the superlattice
and the bulk. The positions of carbon atoms in the superlattice can be clearly identified from
the carbon hexagons in the bulk region. We see superlattice structures in the CNT image,
which is schematically illustrated in Fig. 2(b). The structures can be described by a
combination of cranked lines and oval-shape spots, which were sketched by grey lines and
white ellipses, respectively, in Fig. 2(b). The trace of the line has the same shape as that can
be seen in the edge of the ideal armchair CNT. The direction of the cranked line is parallel to
the 'armchair direction' which is marked in Fig. 2(b). The periodicity of the ovals along this
direction is √3a. A similar superlattice structure with the same periodicity was reported in
the STM images obtained near a particle and an edge on graphite surface (Xhie et al., 1991,
Kobayashi et al., 2005).
Fig. 2. Magnified image of Fig. 1(b) (a) Enlarged image of the point B in Fig. 1(b). The dotted
lines mean the honeycomb structure of primitive graphene. The ellipses are emphasized by
thick bars. (b) Diagram of the relation between the positions of carbon atoms and the
apparent structure in (a). The black circles represent carbon atoms, and the arrows indicate
the a
1
and a
2
.
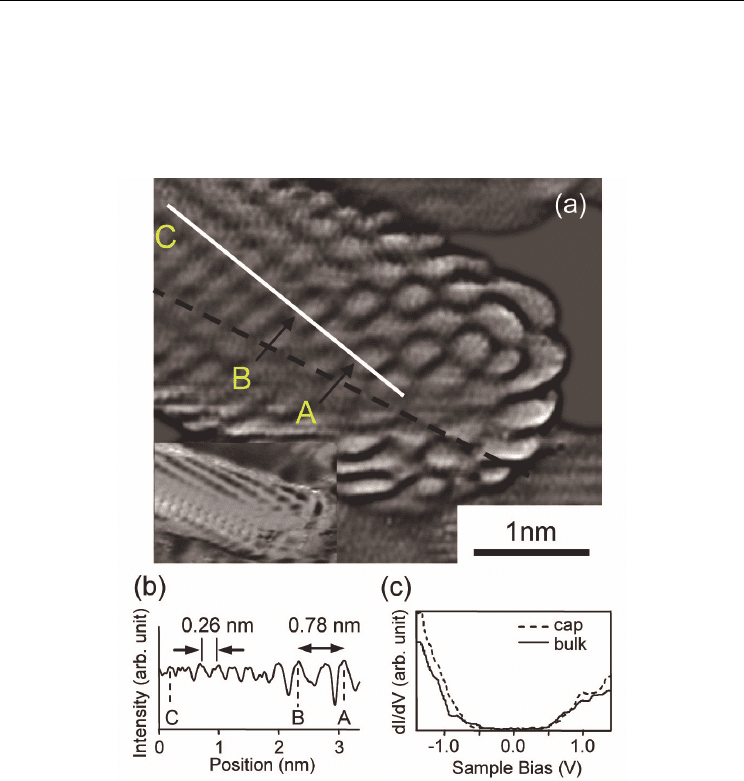
We measured another semiconductive CNT, whose image was obtained with the conditions
of 0.6 V and 100 pA (see Fig. 3(a)). In this image, two CNTs are overlapped with each other,
and we show the border of two CNTs by the dashed line in Fig. 3(a). Due to the conditions
of the STM tip, the two CNTs were convoluted into a single tube in the image. However,
low bias dI/dV mapping image can clearly distinguish the two CNTs (inset figure). The
STM Observation of Interference Patterns near the End Cap
and Its Application to the Chiral Vector Determination of Carbon Nanotubes
629
mapping image was obtained by plotting a derivative conductance at −0.4 eV which was
detected by using a lock-in amplifier, while the tip scanned the surface with a closed
feedback-loop (modulation voltage was superimposed on the sample voltage, which was
small enough to obtain a decent topographic image). We assign the upper CNT as (11, 4) or
(12, 4), whose chiral angle is between armchair and zigzag nanotubes. The ambiguity of the
chiral vector is due to the error bar of the measurement of the diameter.
Fig. 3. STM image of semiconductive CNT (a) Derivative STM image of two nanotubes ends.
The dashed line represents the border of nanotubes. Ellipse rows and cranked lines are
observed. (inset) the dI/dV mapping image of the same nanotubes at -0.4 eV. (b) The line
profile along the highlighted line in (a). AB corresponds to the distance between ellipse rows
in (a), and the point C is on the normal period. (c) dI/dV-V spectra on the cap (dashed line),
and on the bulk (solid line) where is 5 nm far from the end.
The combination of the oval-shape spots and the cranked lines can be observed near the
end-cap, which is similar to the ones observed for the CNT of Fig. 2(a).
Figure 3(b) shows the height-profile along the line A-C in Fig. 3(a). The distance between A
and B is ~ 0.78 nm, which is close to 3a. The superlattice structure appears in a limited area
from the end-cap. The dI/dV curves measured on the cap and the bulk are shown in Fig.
3(c). The band gap was observed on both sites, indicating that they are both semiconductive.

Electronic Properties of Carbon Nanotubes
630
The van Hove singularities were weak and can not be assigned. The electronic states
detected with the condition of the sample bias of 0.6 eV correspond to the ones at the edge
of the conduction band. The band gap of this CNT expected from a theoretical calculation is
~0.7 eV, which was deduced from the equation of E
gap
=2|
0
|a
c-c
/d (Saito et al., 1998), where
0
= -2.7 eV corresponding to the C-C overlap energy, a
c-c
= 0.142 nm is the nearest neighbor
distance between carbon atoms, and d = 1.1 nm is the diameter of the CNT.
Fig. 4. Comparison of STM images of armchair and zigzag CNT (a) Upper panel:
Interference pattern observed near the end-cap of armchair-like semiconducting CNT (chiral
vector (28, -13)), (I
t
= 100 pA V
bias
= 0.6 V). Lower panel: Magnified image of the upper
panel. The thin lines are included as a guide to the eye for the aligned bright spots. The
superlattice structure imposed hexagons are the primitive honeycomb structures. (b)
Interference patterns for the zigzag CNT (I
t
= 100 pA V
bias
= 0.7 V). Bright spots separated by
4a along the arrows. (c)(d) Bias dependence of an interference pattern of the zigzag CNT
measured with I
t
= 100 pA and (c) V
bias
= 0.7 V , (d) V
bias
= 1.0 V at an identical position of the
same CNT(chiral vector (15,-1)).
The band gap estimated by the onsets of the dI/dV curve is in the range of 0.9-1.0 eV, which
is larger than the theoretical prediction. Similar discrepancies are reported previously which
should be due to the band broadening.

STM Observation of Interference Patterns near the End Cap
and Its Application to the Chiral Vector Determination of Carbon Nanotubes
631
Near the end-cap of the CNT, we can find a report that detected a gap-state (Kim et al.,
2005). However we could not see a similar state. Instead we detect a small energy shift (~ 0.1
eV) to the higher sample bias in the dI/dV spectrum at the end-cap region compared to that
observed at the normal region.
Here we compare the structure at the end-cap of the armchair and the zigzag CNT in Fig. 4.
The images are shown in a derivative manner to flatten the background. In the upper panel
of Fig. 4(a), the end-cap is positioned on the left hand side and the infinite tube extends to
the right. We can estimate a chiral angle of ~2.9 and a tube diameter of ~1.9 nm, from
which the most plausible chiral vector of (28, -13) can be deduced. Since this CNT is close to
an armchair type, the CNT axis is close to the K direction in k space.
Near the end-cap, we observe a characteristic structure with a complex pattern. This
structure can be described as a combination of aligned bright spots and wavy lines
sandwiched by the former. The alignment is indicated by thin lines in the figure, which are
rotated 60
o
from the tube axis. The wavy patterns are also aligned along the thin lines. The
separation of the bright spots (pointed by upper-ends of the bars) along the CNT axis is ~
0.68-0.70 nm that is close to 3a. This agrees with the interference periodicity discussed in
metallic CNTs (Lemay et al., 2001, Ouyang et al., 2002, Rubio et al., 1999 ), wherein the
energy band crosses the Fermi level at the K point that corresponds to k =2/3a, which is
the origin of the periodicity of 3a.
When the chirality of the CNT is close to zigzag, the STM image near the end-cap is like the
one shown in Fig. 4(b). Similar to the case of Fig. 4(a), a complex pattern can be observed
within ~6 nm from the end-cap. In the right-hand side area, we can see a hexagonal network
rotated 30
o
from the armchair direction. The CNT axis is aligned to the M direction of the
Brillouin zone. On the left-hand side, we can notice a pattern of bright spots with a large
periodicity perpendicular to the tube-axis. Along the thin-arrows, we note bright spots with
a separation of ~4a (see superimposed hexagons). Along a line between the two, two bright
spots are separated by a.
We show STM images of another zigzag CNT in Fig. 4(c) that was imaged with a condition
of V
bias
= 0.7 V, which exhibits more minute features. We assigned the chirality of the CNT as
(15, -1) which is close to the zigzag but different from the one of Fig. 4(b).
When the same CNT was observed with V
bias
= 1.0 V, the image shows a 1×1 pattern even
near the end-cap. This is shown in Fig. 4(d), which was obtained in the same area with that
of Fig. 4(c). This is caused primarily by a mixture of various electronic states contained in
the allowed energy region.
3. Simulation of STM images of CNT
The electronic property of the CNT is partially determined by how it is wrapped from the
graphene sheet, whose unit vectors of a
1
and a
2
are shown in Fig. 5(a). The wrapping is
characterized with a chiral vector C and translational vector T. The tube axis is parallel to
the latter which is perpendicular to the former.
The chiral vector is expressed with a form of C
h
=na
1
+ma
2
, which is often denoted as (n, m)
(see Fig. 5(a)). Two symmetry lines are often referred in the chiral vector discussion, and are
called armchair and zigzag direction which are shown in Fig.5 (a). The chiral angle () is
defined as the angle between the chiral vector and the armchair direction. The CNT with
=0
o
is called an armchair CNT and the one with =30
o
is called a zigzag CNT.
Electronic Properties of Carbon Nanotubes
632
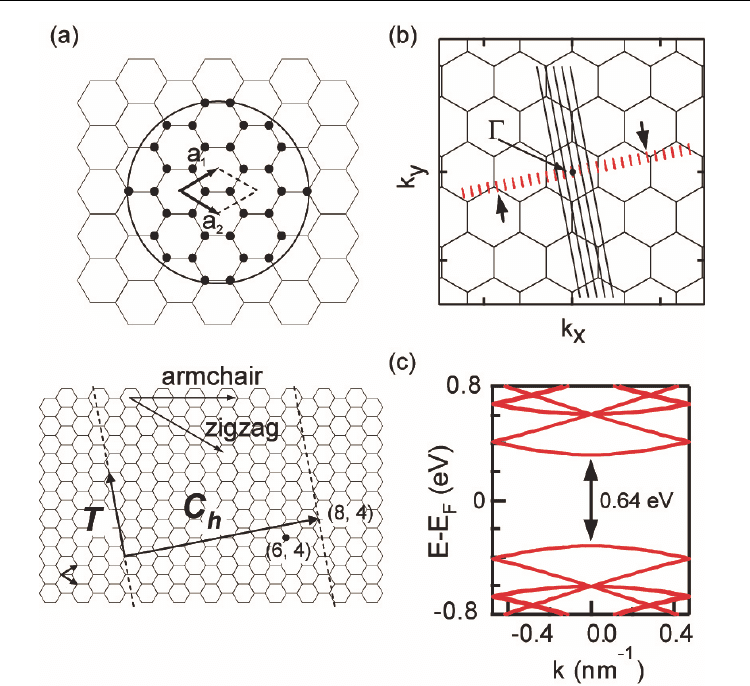
Fig. 5. Chiral vector and band structure of CNT (a) (upper) atomic structure of a graphene
layer. The carbon atoms are indicated by solid circles, and a unit cell is indicated by two unit
vectors and dashed lines which contains two carbon atoms. 34 atoms in the circle are used
for the calculation of electron probability for the STM simulation. (lower) Definition of chiral
vector C
h
and translational vector T of carbon nanotube. (b) Brillouin zones of graphene and
allowed k points for the (4, 2) CNT that are marked by the long black lines. The short red
lines are equivalent to them. The k points that give the energy minimum (maximum) in the
conduction band (valence band) are indicated by arrows, which are the closest points to K
and K’. (c) Calculated band structure for a CNT of (15,-1). The length along the horizontal
axis corresponds to the length of the red lines in (b).
Though the electronic structure of a CNT is close to that of graphene, limited k points are
allowed due to quantization of an electron in the wrapping direction. The allowed k points
can be plotted on straight lines along the tube axis direction, separated by 2/│C
h
│from
each other. In Fig. 5(b), we show an example of such lines for a CNT with a chirality of (4, 2).
These are shown by long black lines. An equivalent expression is a series of short bars
whose lengths are an inverse of the translational vector, which are also shown in Fig. 5(b) by

STM Observation of Interference Patterns near the End Cap
and Its Application to the Chiral Vector Determination of Carbon Nanotubes
633
the short red lines. It has been demonstrated that if the chiral vector (n, m) satisfies the
condition of n-m=0 (mod 3), the CNT is metallic and the energy band (E(k)) curve crosses the
Fermi level at K or K'. For a semiconducting CNT, the lines of the allowed k vectors never
cross the K point. The minimum (maximum) energy in the conduction (valence) band is
given at k
min
, which is on the red lines and is closest to the K or K' point (White et al., 1998).
In Fig. 5(b), we show the positions of k
min
with arrows.
The band structure can be calculated using the standard formula, and the result for (15, -1) is
shown in Fig. 5(c). The length of the x-axis corresponds to that of the short red lines in Fig.
5(b), and the valence band maximum and conduction band minimum is given at k
min
, which
has an energy gap as expected from a semiconducting nature of the CNT.
Kane et al. discussed that the symmetry breaking might occur at semiconductive tube end in
STM image. This is because that the incoming and back-scattered electron waves might be
interfered near the end, and break the rotational symmetry. The expected interference
pattern was 1×1 spiral stripes, which ran along the zigzag direction of nanotube (Kane et al.,
1999). However, the patterns near the end-caps shown above are not simple stripes.
Moreover, they are along the armchair direction instead of the predicted zigzag direction.
These superlattice structures could not be explained by a simple electron wave scattering
theory. Rubio et al. calculated molecular orbitals and STS images of an armchair nanotube
with a finite length by density-functional theory method (Rubio et al., 1999 ). One of the
orbitals in the Hückel catalog near the Fermi level has a similar pattern to that of Fig 2(b),
which was obtained near the interface area. The STM image of the metallic CNT near the
Fermi level was calculated by the combination of the four patterns at K point on the
Brillouin zone of nanotube. Indeed, the dI/dV mapping image of the nanotube with 30 nm
length equaled to the shape of wavefunction because the small length made the energy
levels discrete by quantum size effect (Lemay et al., 2001). The observed wavefunctions were
the combination of Bloch functions and equaled to the molecular orbitals.
We examine two types of the calculation focusing on the simulation of the symmetry
breaking patterns observed neat the cap end.
3.1 Simulation by molecular orbital calculation
First we show a simulation with using molecule orbital calculation. We calculated the
molecular orbitals of capped nanotube by PM3 method (Stewart, 1989, Stewart, 1989,
Stewart, 1991). The calculation was carried out by MOPAC2000 package (Stewart, 1990). We
employed a model nanotube (10, -4) instead of (28, -13) latter of which was actually shown
in the STM observations. This is because of the limitation of our computational resource.
Because the nanotube (10, -4) has an apparent chiral angle () of 6.6
which is close to =2.9
o
observed for the (28, -13) CNT. Thus we believe the calculation can reproduce the
experimental results. The calculated HOMO and LUMO orbitals are shown in Fig. 6(a) and
(b), respectively. The distribution of LUMO orbital shows clear ellipses and cranked-lines
along the armchair direction, which is similar to the image of Fig. 2(b). The distance between
the ellipses along the zigzag direction is 3a. On the other hand, the distribution of HOMO
does not show the cranked-line, whereas circles are visible along the armchair direction. The
STM image obtained with a positive sample bias corresponds to the distribution of an
unoccupied electronic state; therefore the theoretical simulation above reproduces the
observed STM images.
Electronic Properties of Carbon Nanotubes
634
Fig. 6. STM image of CNT simulated by PM3, molecular orbital method (a) HOMO and (b)
LUMO calculated by PM3 method. The nanotube consists of 220 carbon and ten hydrogen
atoms. The grey-scale tone corresponds to the sign of phase. The left side is capped by a
hemisphere of carbon atoms, and the right side is terminated by hydrogen atoms. The wave
length along the apparent chiral angle direction is indicated by an arrow.
In addition, further information can be obtained from Fig. 6. The local density of states,
LDOS
, can be expressed by the following equation:
2
LDOS
(, ) () ( )
ii
i
EEE
rr , (1)
where
i
are the wavefunction with the eigenvalue E
i
, and i corresponds to the index of
eigenstates. It is obvious that the electron population can be estimated with the LDOS of the
atom at the position. It is measured that the HOMO has a larger population at the cap than
at the normal part, whereas the LUMO behaves in an opposite manner. This is why the
pentagon in the cap works as electron acceptor. It is due to the Hückel rule that the cyclic
-
electron state containing 4n + 2 electrons is the most stable one (n is an integer). The carbon
pentagon contains five
-electrons in the neutral state, and tends to attract a single electron.
Therefore a negative charge is localized near the cap.
The change of the charge distribution causes a band bending, and the occupied states at the
end-cap should be shifted downward. We consider that this can account for the energy shift
of the dI/dV spectrum shown in Fig. 3(c). We conclude that the modulated pattern was
observed when the STM sample bias agreed with the bottom of the conduction band whose
energy level was shifted due to the band bending.