Marron P.J., Voigt T., Corke P., Mottola L. Real-World Wireless Sensor Networks
Подождите немного. Документ загружается.


58 J. Ma and K. R¨omer
Table 2. vLevels memory footprint for Contiki on Tmote sky
Binary RAM (bytes) ROM (bytes)
Tracking application 5956 29510
+vLevels 0B 6026 32118
+vLevels 50B 6166 33808
bytes. In summary, the overhead of vLevels is about 2% of the total RAM and 8% of the
total ROM of a Tmote Sky for the studied application, which we find to be acceptable.
4.4 Runtime Overhead
To evaluate the runtime behavior of vLevels, we run the application with vLevels in the
COOJA/MSPSim simulator (CPU speed 3.9 MHz). We only consider a single tracking
node. The experiment lasts 300 seconds, the target appears at 50 seconds, remains static,
and disappears at 250 seconds. We measure the vLevels overhead in terms of CPU
cycles for initialization (call to vlevel init), logging (invocation of vlevel log),
the buffer management thread (buf proc), and the send thread excluding the actual
transmission of the data (logcast proc).
Table 3. Average cycle counts of different parts of vLevels
buffer size vlevel init vlevel log buf proc logcast proc total ratio
12 1716 1056 803 1803 489378 0.04%
24 1716 821 799 1775 413061 0.04%
48 1716 866 791 1723 390942 0.03%
Table 3 shows the average cycle counts of these parts of vLevels during the ex-
periment for different buffer sizes. vlevel log is invoked 130 times in total and its
cycle count varies with buffer size. Small buffers result in higher overhead as the sched-
uler must downgrade visibility levels more frequently to fit everything into the buffer.
The overheads of buf proc and logcast proc are independent of the buffer size,
but buf proc is called more often for smaller buffers. The number of invocations to
logcast proc is proportional to the bandwidth constraint given by users. Finally, we
calculated the aggregate overhead introduced by vLevels during the complete experi-
ment and the ratio of the aggregate overhead to the total CPU cycles as shown in Table
3, which we find to be acceptable.
4.5 Accuracy and Bandwidth
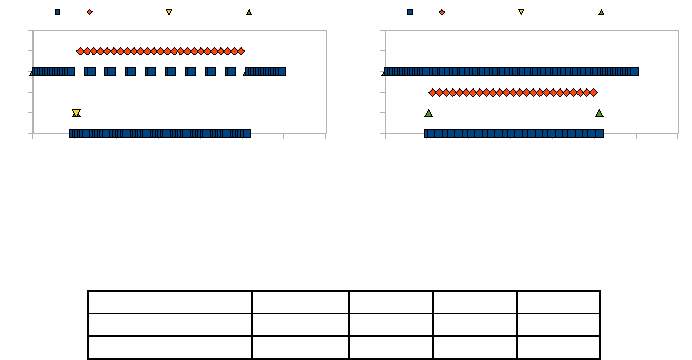
Observation is the more accurate, the higher the selected visibility levels. Figure 3 de-
picts the visibility levels selected by the scheduler over time for the four visible objects
for different buffer sizes. The figure shows that the visibility level of light degrades
as log entries for objects with higher priority (i.e. m state, election timeout are
generated between time 50 and 250 seconds. Note that higher-priority objects are as-
signed higher visibility levels in case of larger buffer sizes as there is a bigger set of log
entries to pick from when reducing visibility levels. Hence, larger buffers result in more
Visibility Levels 59
a
"
b
"
Fig.3. Accuracy of collected data for different buffer sizes
Table 4. Throttled bandwidth and reporting latency by buffer sizes
original data 48B buffer 24B buffer 12B buffer
bandwidth [bytes/sec] 5.53 3.5 3.24 3.94
latency [sec] - 12 6 3
accurate observations at the cost of a longer reporting latency for the same bandwidth
budget.
Table 4 shows the bandwidth of the uncompressed raw logging data and the band-
width throttled by vLevels for different buffer sizes during the experiment. The numbers
show that the throttled bandwidth is always lower than the bandwidth budget specified
in the observation scheme (i.e., 4 bytes/s).
5 Related Work
In the recent past, several techniques and tools for monitoring and debugging deployed
sensor networks have been proposed. Initial efforts towards debugging sensor networks
are Sympathy [10] and Memento [13], both of which support the detection of a fixed
set of problems. To improve repeatability of distributed event-driven applications, En-
viroLog [8] provides an event recording and replay service that helps users to debug
problems that are difficult to reproduce. Tools such as Marionette [17] support log-
ging and retrieval of runtime state for fault diagnosis. Clairvoyant [18] is an interactive
source-level debugger for sensor nodes. Declarative Tracepoints [2] implements a lan-
guage abstraction for insertion of tracepoints into binary program images that bears
some similarity to our notion of visible objects. To minimize the interference with de-
bugged sensor networks, tools such as SNIF [11] that diagnose networks by analyzing
sniffed messages can detect many failure symptoms, but visibility is limited to network
messages. By allowing nodes to broadcast program state, Passive Distributed Assertions
[12] support the detection of bugs caused by the incorrect interaction of multiple nodes.
By optimizing log collection, LIS [14] enables users to extract detailed execution traces
from resource-constrained sensor nodes. In [16], visibility is regarded as an important
metric for protocol design and is improved by creating an optimal decision tree so that
the energy cost of diagnosing the cause of a failure or behavior can be minimized. Un-
like providing a principle for protocol design, our approach creates a mechanism to tune
the visibility of internal node states. Outside the context of debugging, Energy Levels
60 J. Ma and K. R¨omer
[7] provides a programming abstraction to meet user-defined lifetime goals while max-
imizing application quality, which inspires the idea behind visibility levels. However,
to our knowledge none of these approaches explicitly supports managing the tradeoff
between visibility and resource consumption as vLevels does. Hence, we believe that
vLevels is complementary to these previous techniques.
6 Conclusions
Debugging deployed sensor networks requires visibility of the node states. However,
increasing visibility also incurs a higher resource consumption in terms of commu-
nication bandwidth or storage space. Especially for long-term monitoring of a sensor
network it is hence crucial to find the right balance between sufficient visibility and
tolerable resource consumption. Existing monitoring tools lack the ability to explicitly
manage this tradeoff. We address this limitation by proposing vLevels, a framework
that allows the user to specify a resource budget and the runtime provides best possible
visibility into the system state while not exceeding the resource budget. By means of a
case study of a tracking application we showed that the memory and runtime overhead
of vLevels is reasonably small and that vLevels can automatically adjust visibility to
meet the resource budget.
References
1. Abdelzaher, T., Blum, B., Cao, Q., Chen, Y., Evans, D., George, J., George, S., Gu, L., He,
T., Krishnamurthy, S., Lou, L., Son, S., Stankovic, J., Stoleru, R., Wood, A.: Envirotrack:
Towards an environmental computing paradigm for distributed sensor networks. In: Proc.
ICDCS 2004, pp. 582–589. IEEE Computer Society, Washington (2004)
2. Cao, Q., Abdelzaher, T., Stankovic, J., Whitehouse, K., Luo, L.: Declarative tracepoints: a
programmable and application independent debugging system for wireless sensor networks.
In: Proc. SenSys 2008, pp. 85–98. ACM, New York (2008)
3. Dunkels, A., Finne, N., Eriksson, J., Voigt, T.: Run-time dynamic linking for reprogramming
wireless sensor networks. In: Proc. SenSys 2006, pp. 15–28. ACM, New York (2006)
4. Dunkels, A., Gronvall, B., Voigt, T.: Contiki - a lightweight and flexible operating system
for tiny networked sensors. In: Proc. LCN 2004, pp. 455–462. IEEE Computer Society,
Washington (2004)
5. Eriksson, J.,
¨
Osterlind, F., Finne, N., Tsiftes, N., Dunkels, A., Voigt, T., Sauter, R.,
Marr´on, P.J.: Cooja/mspsim: interoperability testing for wireless sensor networks. In:
Proc. SIMUTools 2009, pp. 27–27. ICST, Brussels (2009)
6. Kicales, G., Lamping, J., Mendhekar, A., Maeda, C., Lopes, C., Loingtier, J.M., Irwin, J.:
Aspect-oriented programming. In: Aksit, M., Matsuoka, S. (eds.) ECOOP 1997. LNCS,
vol. 1241, Springer, Heidelberg (1997)
7. Lachenmann, A., Marr´on, P.J., Minder, D., Rothermel, K.: Meeting lifetime goals with en-
ergy levels. In: Proc. SenSys 2007, pp. 131–144. ACM, New York (2007)
8. Luo, L., He, T., Zhou, G., Gu, L., Abdelzaher, T.F., Stankovic, J.A.: Achieving repeatability
of asynchronous events in wireless sensor networks with envirolog. In: Proc. INFOCOM
2006, pp. 1–14. IEEE Press, New York (2006)
9. Necula, G.C., Necula, G.C., McPeak, S., Rahul, S.P., Weimer, W.: CIL: Intermediate lan-
guage and tools for analysis and transformation of c programs. In: Parra, G. (ed.) CC 2002.
LNCS, vol. 2304, pp. 209–265. Springer, Heidelberg (2002)
Visibility Levels 61
10. Ramanathan, N., Chang, K., Kapur, R., Girod, L., Kohler, E., Estrin, D.: Sympathy for the
sensor network debugger. In: Proc. SenSys 2005, pp. 255–267. ACM, New York (2005)
11. Ringwald, M., R¨omer, K., Vitaletti, A.: Passive inspection of sensor networks. In: Aspnes, J.,
Scheideler, C., Arora, A., Madden, S. (eds.) DCOSS 2007. LNCS, vol. 4549, pp. 205–222.
Springer, Heidelberg (2007)
12. R¨omer, K., Ma, J.: PDA: Passive distributed assertions for sensor networks. In: Proc. IPSN
2009, pp. 337–348. IEEE Computer Society, Washington (2009)
13. Rost, S., Balakrishnan, H.: Memento: A health monitoring system for wireless sensor net-
works. In: IEEE SECON 2006, pp. 575–584. IEEE Press, New York (2006)
14. Shea, R., Srivastava, M., Cho, Y.: Lis is more: Improved diagnostic logging in sensor
networks with log instrumentation specifications. Tech. Rep. TR-UCLA-NESL-200906-01
(June 2009)
15. Tsiftes, N., Dunkels, A., He, Z., Voigt, T.: Enabling large-scale storage in sensor networks
with the coffee file system. In: Proc. IPSN 2009, pp. 349–360. IEEE Computer Society,
Washington (2009)
16. Wachs, M., Choi, J.I., Lee, J.W., Srinivasan, K., Chen, Z., Jain, M., Levis, P.: Visibility: a
new metric for protocol design. In: Proc. SenSys 2007, pp. 73–86. ACM, New York (2007)
17. Whitehouse, K., Tolle, G., Taneja, J., Sharp, C., Kim, S., Jeong, J., Hui, J., Dutta, P., Culler,
D.: Marionette: using rpc for interactive development and debugging of wireless embedded
networks. In: Proc. IPSN 2006, pp. 416–423. ACM, New York (2006)
18. Yang, J., Soffa, M.L., Selavo, L., Whitehouse, K.: Clairvoyant: a comprehensive source-level
debugger for wireless sensor networks. In: Proc. SenSys 2007, pp. 189–203. ACM, New York
(2007)

Flexible Online Energy Accounting in TinyOS
Simon Kellner
System Architecture Group
Karlsruhe Institute of Technology
kellner@kit.edu
Abstract. Energy is the most limiting resource in sensor networks. This
is particularly true for dynamic sensor networks in which the sensor-net
application changes its hardware utilization over time. In such networks,
offline estimation of energy consumption can not take into account all
changes to the application’s hardware utilization profile and thus invari-
ably returns inaccurate estimates. Online accounting methods offer more
precise energy consumption estimates. In this paper we describe an online
energy accounting system for TinyOS consisting of two components: An
energy-estimation system to collect information about energy consump-
tion of a node and an energy-container system that allows an application
to collect energy-consumption information about its tasks individually.
The evaluation with TinyDB shows that it is both accurate and efficient.
Keywords: energy accounting policy tinyos.
1 Introduction
Energy still is the most critical resource in sensor networks. Limitations on en-
ergy supply as well as on other resources have led to operating system designs
that offer only minimalistic hardware abstractions. The core of TinyOS, for ex-
ample, is an event-based system that helps application developers in dealing with
asynchronous hardware requests, and little else. One effect of this design decision
is to make developers more considerate about hardware usage and therefore en-
ergy consumption. TinyOS makes it hard to actively wait for a hardware event
to occur, while making it easy to react to the same event, which is the more
energy-efficient approach in most situations.
One approach to designing sensor-net applications that meet pre-defined en-
ergy consumption requirements is to develop an application whose hardware
utilization pattern is simple enough to allow predictions on the application’s en-
ergy consumption. Global parameters of such applications can then be changed
to accommodate energy consumption requirements. But the lack of convenient
hardware abstractions does not necessarily limit developers in creating complex
applications. A sensor network running the TinyOS-based TinyDB application,
for example, allows users to issue (SQL-like) queries to the sensor network at a
time of their choosing. Planning the energy consumption of nodes in this net-
work can not be done a-priori, because the energy consumption characteristics
of a node running TinyDB change with the queries it processes.
P.J. Marron et al. (Eds.): REALWSN 2010, LNCS 6511, pp. 62–73, 2010.
Springer-Verlag Berlin Heidelberg 2010
Flexible Online Energy Accounting in TinyOS 63
Control of energy consumption in this scenario is only feasible using online
energy accounting on the sensor nodes. Information on the energy consumption
of whole nodes, however, does not offer much information. An energy-intensive
query might, for example, be only revealed by comparing node energy consump-
tion before and after a query was sent into the network. Energy consumption of
queries, on the other hand, can be readily used to decide if a query consumes too
much energy and has to be canceled before it wears down the energy supplies of
the sensor network.
This paper makes the following contributions:
– An online energy-estimation system for TinyOS that allows sensor nodes to
become aware of their energy consumption.
– An energy container system for TinyOS that allows application developers
to collect energy-consumption information about control flows in the appli-
cation.
– A set of accounting policies that can be used to adapt the energy-container
system to its purpose as set by the application developer.
The paper is structured as follows: After presenting related work in Sect. 2 we
define a usage scenario in Sect. 3 that will be referenced later on. Then we present
the design and selected implementation issues of the energy estimation system
(Section 4) and the energy container system (Section 5). Section 6 details several
accounting policies of our energy-container system. Following an evaluation of
our systems in Sect. 7 we conclude with an outline of future work in Sect. 8 and
closing remarks in Sect. 9.
2 Related Work
Management of energy in sensor networks has received significant attention in
research over the last years, as it concerns the primary resource of such networks.
PowerTOSSIM [7] is similar to our own energy estimation system. It instru-
ments OS components or simulations thereof to track power states and uses an
energy model to compute energy consumption for one or more sensor nodes.
PowerTOSSIM, however, targets off-line simulation, whereas our instrumenta-
tion and model are designed to be used in on-line energy accounting.
AEON [5] is the energy model used in the Avrora [8] simulator. It models the
hardware’s power states of a MICA2 node. Our energy model is based primarily
on the MICAz node and additionally considers transitions between hardware
states.
Schmidt, Kr¨amer et al. [6] present another energy model used to make existing
simulators energy-aware. Although they mention the potential to use their energy
model in online energy estimation, they do not elaborate on that option further.
Dunkels et al. [2] present an energy-estimation system for the Contiki OS. This
system is used to estimate energy consumption per hardware components. We
employ a similar energy-estimation systemandextenditwithenergycontainers
to a full energy-accounting system that is able to account energy based on control
flows, which may span multiple hardware components.
64 S. Kellner
Quanto [3] is an energy profiling mechanism for TinyOS that accounts energy
consumption information of activities in an application. It employs a hardware
energy meter to measure the total energy consumption of a sensor node, and tries
to break this information down to energy consumption of individual hardware
components. Our energy estimation system does not require any hardware in-
strumentation. It also provides more options for accounting policies, facilitating
more use cases than energy profiling.
Resource Containers [1] are an abstraction in an operating system (OS) intro-
duced by Banga, Druschel and Mogul providing flexible, fine-grained resource
accounting on web-servers. The main idea is to separate execution (processes)
from resource accounting, so that an application itself can define the entity being
subject to accounting. In operating systems featuring CPU abstractions such as
threads or processes, Resource Containers give administrators and users the abil-
ity to account all activity connected to a user request, which usually has a higher
significance than process-based accounting. We adapt this concept to TinyOS
and focus solely on energy as a resource. Consequently, we call our containers
energy containers.
3Scenario
In this paper we use the following reference scenario. A network of sensors is pro-
grammed with a dynamic application like TinyDB. We assume multiple users
of the sensor network who periodically retrieve data from the network. They
retrieve data by injecting queries into the network, which are then periodi-
cally processed by the application on the sensor nodes until a user stops them.
The sensor-net application can process multiple queries concurrently over a long
period of time.
Network operators and users should be able to intervene in the query process-
ing to save energy.
4 Online Energy Estimation
An important part of the energy accounting system is the on-line estimation of
a sensor node’s energy consumption.
We recognize a sensor node as a collection of simple, independent hardware
components controlled by one microcontroller (MCU). Therefore, we model a
node’s energy consumption using a collection of small state machines, one for
each independent hardware component.
These state machines have a state for each distinguishable hardware power
state, i.e., a hardware state exhibiting a characteristic current draw. Each state s
is annotated with this current draw I
s
. Transitions t in this state machine are
annotated with the amount of electric charge Q
t
they consume.
To compute an estimation of the energy a hardware component has consumed,
we record the time T
s
the hardware spent in each state s as well as the number
of times N
t
each transition t occurred and compute the estimated consumed
energy E as
Flexible Online Energy Accounting in TinyOS 65
E
V
=
s
T
s
I
s
+
t
Q
t
N
t
. (1)
This is the same idea Dunkels et al. [2] use in their online energy estimation for
the Contiki operating system.
We implemented the online energy estimation method presented above in
TinyOS 2 for the MICAz platform. At the time of writing, we have energy
estimation implementations for the ATmega128 microcontroller, the CC2420
radio chip, the LEDs, and the magnetometer on the MTS300 sensor board.
5 Energy Container System
To store the estimated energy usage per query, we employ a hierarchy of energy
containers. With multiple energy containers in the system (e.g., for concurrent
queries), we need some help from the application (e.g., TinyDB) to map activities
to energy containers. Our energy-container system keeps this association intact.
In this section we will first present energy-container types and their structure
in our system. We then will describe the way in which the application should
interact with the energy container system. Afterwards we will detail how our
system keeps energy-container associations intact.
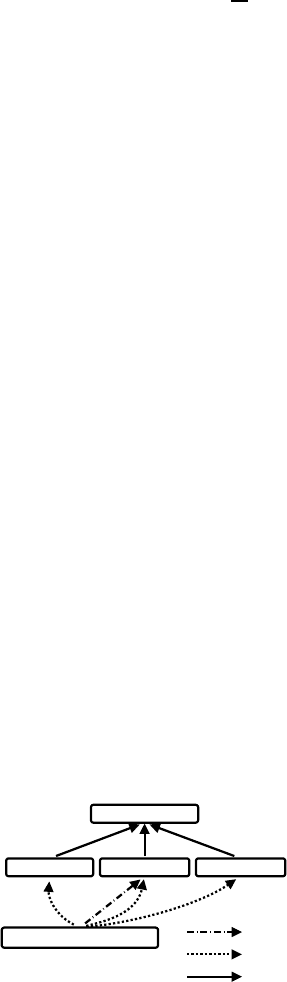
5.1 Energy Container Structure
In our system, energy containers are hierarchically structured, as shown in Fig. 1.
Most containers in our energy container system are under the control of the
application developer. They can be allocated, read, and released at the applica-
tion’s discretion. The application can also switch between containers, indicating
that subsequent computations should be accounted to a different container.
In addition to these normal containers,theroot container holds the energy
consumption of a whole sensor node: All energy consumption is accounted both
to the container selected by the application and to the root container. Together,
these two types of containers form a flat hierarchy.
Fig. 1. Hierarchy of energy containers
ec_id newContainer();
void attachToContainer(ec_id id);
void switchToContainer(ec_id id);
uint32_t getContainer(ec_id id);
uint32_t getRootContainer();
void stopMonitoring(ec_id id);
Fig. 2. Interfacetothecontainersystem
66 S. Kellner
As a special case, a temporary container is used in cases where the application
cannot know (yet) to which container the current energy consumption should be
accounted. On a sensor node such a situation only occurs whenever a message
is received by the radio: The message can belong to the query currently active,
lead to the creation of a new query, or it could not be associated to query
processing at all. For these cases we use one extra container that is activated
upon reception of a message and is treated in a special way: When the message
is found to belong to a known query, or creates a new one, the application has
to attach the temporary container to the normal container used for that query.
In this case the contents of the temporary container are added to the normal
container, the currently active container is set to the normal container, and
the temporary container is deactivated. If the application does not attach the
temporary container to a normal one, our container system apportions the energy
accounted to the temporary container among all currently active containers at
the end of the message reception handler routine.
5.2 Energy Container Interface
Figure 2 shows the interface an application should use to work with our en-
ergy container system. The commands are ordered as they would be used in an
application.
Upon reception of a query message, the application attaches itself to a known
container (attachToContainer) or to a newly created one (newContainer). Be-
fore an application starts a processing step of a query, it switches to the container
created for that query (switchToContainer). When creating a query response
message, the application may choose to include the contents of one or more
energy containers (get{,Root}Container). If a query should no longer be pro-
cessed (i.e., removed from the system), it invokes stopMonitoring to completely
deactivate the indicated container.
The presented interface intentionally does not provide full control over energy
containers. For instance, there is no command to deactivate the currently active
container without either removing it completely from the system or switching
to another container. In our opinion, every action on a sensor node should be
accountable to a request made by a user of a sensor network. Nevertheless it is
possible to create new containers, for example, to account a maintenance task
that is run on a sensor node and is independent of any queries.
Also intentionally absent from the energy container interface are commands
to operate on the contents of the energy containers. We separate operations
on energy containers within our energy container system from the operations
on energy values in the application. It is the responsibility of the application
to make network-wide use of these locally obtained energy values. Our energy-
container system can not automatically handle all cases of aggregation that an
application may perform on energy values.
Flexible Online Energy Accounting in TinyOS 67
5.3 Energy Container Implementation
As the previous section on the energy container interface shows, the application
has to be modified to use energy containers. Naturally we strive to require as
few changes to the application as possible, which means that our system has to
keep associations to energy containers intact.
Resource containers in UNIX are attached to threads, so thread control blocks
would be used to store references to associated resource containers, and the
reference to the currently active thread would be used to access the currently
active resource container. TinyOS, however, does not provide a CPU abstraction
such as threads. TOSthreads, a TinyOS library providing threads, is optional
and many applications do not require it, including TinyDB. TinyOS at its core
therefore lacks a structure like a thread control block and a reference to the
currently active thread.
In the absence of threads, we have to implement container associations in a
different way: We use a set of TinyOS components to track the control flow of
an application and to keep an energy container associated to this control flow.
By control flow we mean a series of actions (instruction execution, hardware
operation) where every action is a direct consequence of the actions preceding
it. For example, a control flow to sample a value from a sensor can comprise:
issuing a read() call, turning on the sensor, configuring it, reading it, turning
the sensor off, and returning the value to the application in a readDone event.
A control flow can be suspended several times during its course through
TinyOS, but all these suspensions stem from two cases: software queues and
hardware operations. We say that a control flow is suspended when a piece
of code performs an enqueue operation, and that it is resumed on the related
dequeue operation. Similarly, we say that a control flow is suspended when it
starts a hardware operation, and that it is resumed when the hardware causes
an interrupt handler to be executed.
Software queues are frequently used in TinyOS. For example, instances of
software queues are the queue of timer events in virtual timers, message output
queues of communication modules, access request queues of shared resources,
and the scheduler queue.
We instrumented several TinyOS components to send information about
enqueue-, dequeue-, and hardware operations to our subsystem for control flow
tracking. For software queues we implemented shadow queues of energy contain-
ers. During the enqueue operation, the shadow queue enqueues a reference to the
currently active energy container, thereby associating the object being enqueued
with this energy container. When an object is dequeued, the corresponding en-
ergy container from the shadow queue is activated, resuming the control flow
with the energy container association intact. Control flow tracking over software
queues is illustrated in Fig. 3.
Figure 4 shows that control flow tracking in hardware is handled differently.
Not only is there just one energy container association that has to be stored,
but, more importantly, the concurrency of hardware operations and program
execution on the microcontroller means that there can be multiple active energy