Luiz A.M. (ed.) Superconductor
Подождите немного. Документ загружается.


Microstructure, Diffusion and Growth Mechanism
of Nb
3
Sn Superconductor by Bronze Technique
51
further compared with the data available in the literature. They also calculated the
activation energy for growth for the sample with 7 wt.%Sn (3.87 at.%) in the bronze alloy
and found the value of 230 kJ/mol. It should be noted that this value is much higher than
the value determined by Farrel et al. (Farrel et al., 1974). This is rather close to the value of
215-225 kJ/mol calculated by Larbalestier et al. (Larbalestier et al., 1975).
(a) (b)
Fig. 4. (a) The increase in layer thickness with annealing time at two different temperatures
and (b) the layer thickness at different annealing temperatures, as reported by Farrel et al.,
1974 and Farrel et al., 1975 are shown.
A more recent study (Muranishi & Kajihara, 2005) investigated the growth of the Nb
3
Sn
phase in the temperature range of 650-780
○
C. They considered only 8.3 at.%Sn in the bronze
alloy. They conducted experiments with diffusion couple technique with planar interfaces.
There is an important difference between this and the earlier studies as will be discussed
later on. Unlike the result of Reddi et al. (Reddi et al., 1983), they found that growth
exponent is different at different temperatures. In the range of 650-700
○
C, the growth
exponent was found to be around 0.96 and decreased to 0.77 at 780
○
C.
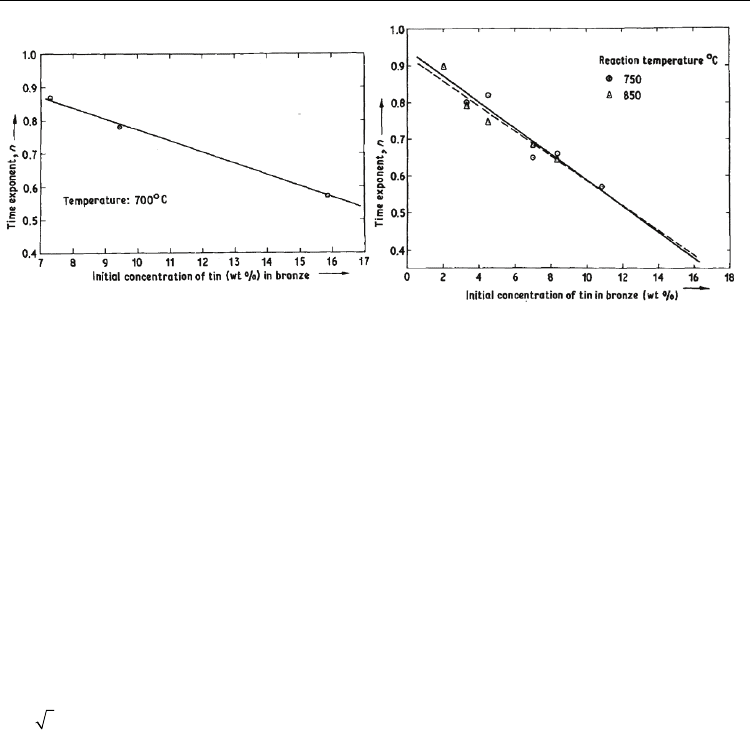
Fig. 5. The increase in layer thickness with annealing time and growth exponent at (a) 750
○
C
and (b) 850
○
C as reported by Reddi et al., 1983 is shown.
Superconductor
52
(a) (b)
Fig. 6. The variation of growth exponent with respect to Sn concentration in bronze alloy at
(a) 700
○
C and (b) 750 and 800
○
C as reported by Reddi et al. is shown (Reddi et al., 1983).
What has been stated above clearly shows that it is very difficult to draw definite
conclusions about the growth exponent of the Nb
3
Sn phase. Outcome of different studies is
found to be very different from each other. Further, a very common problem was found in
most of the studies. To imitate the actual structure, experiments were mainly conducted
with multi or monofilamentary structure, where Nb rods are surrounded by Cu(Sn) bronze
alloy. However, the studies applied the growth kinetic relations derived for the sample
geometries with planar interface. It should be noted that interdiffusion study with this
geometry is rather complicated compared to the interdiffusion process in a specimen with
planar interface. It is also not possible to use the laws developed for planar interface directly
in the experimental results that are achieved from the experiments with cylindrical
geometry, since the growth rate in this condition does not follow the same relation (van Loo,
1990). In a diffusion couple with planar interface, interfacial area does not change. However
in a diffusion couple with cylindrical geometry, interfacial area continuously changes with
the annealing time, as shown in Fig. 7a and growth deviates from linearity when plotted ∆x
vs.
t as shown in Fig. 7b. Moreover because of waviness in the layer thickness, standard
deviation is found to be very high. So it is very difficult to determine the exact growth
exponent. Very few interdiffusion studies with planar interface have been reported
(Muranishi & Kajihara, 2005; Hayase & Kajihara, 2006).
It is typically considered that Sn is virtually the only diffusing species through the product
phase in the Nb/Cu(Sn) system. This is not an bad assumption, since the Kirkendall pores,
which are formed because of unequal mobilities of the species, are found near the
Cu(Sn)/Nb
3
Sn interface (Easton & Kroeger 1979). This indicates that Sn must be the fastest
diffusing species through the product layer.
To quantify the relative mobilities of the species during the growth of Nb
3
Sn, Kirkendall
marker experiments were carried out by Kumar & Paul (Kumar & Paul, 2009). Bronze alloys
with the composition of 7 and 8 at.%Sn were prepared to couple with pure Nb. These
compositions were selected, since according to Reddi et al. (Reddi et al., 1983) growth
exponent was found to be close to 0.5, when Sn concentration in the bronze alloy was
relatively high. After melting the alloys in an induction furnace in vacuum (~10
-6
mbar),
samples were annealed at 700
○
C in vacuum for 48 h to achieve better homogeneity. The
Microstructure, Diffusion and Growth Mechanism
of Nb
3
Sn Superconductor by Bronze Technique
53
average composition was further monitored by electron dispersive X-ray spectrometer
(EDX). The experiments were conducted with planar interface geometry. TiO
2
particles of
around 1 μm size were introduced at the initial contact plane, which acted as the inert
Kirkendall markers. Experiments were done at three different temperatures of 700, 750 and
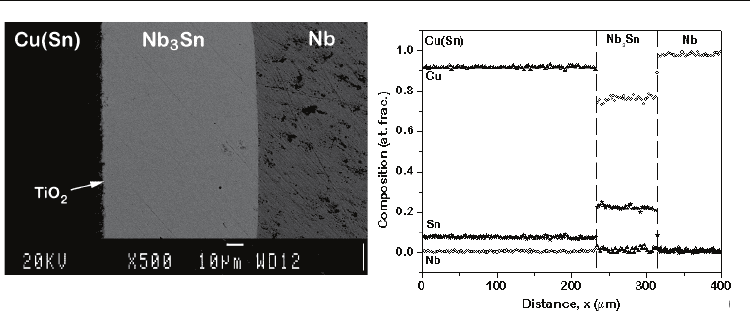
775 °C for 100-330 h. The cross-section from the (Cu-8at.%Sn)/Nb diffusion couple annealed
at 775 °C for 330 h is shown in Fig. 8a. The composition profile measured by EDX is shown
in Fig. 8b. Inert particles were found at the Cu(Sn)/Nb interface. Since the amount of Cu in
the Nb
3
Sn phase was negligible, it can be said that Sn is virtually the only mobile species
through the product phase.
(a) (b)
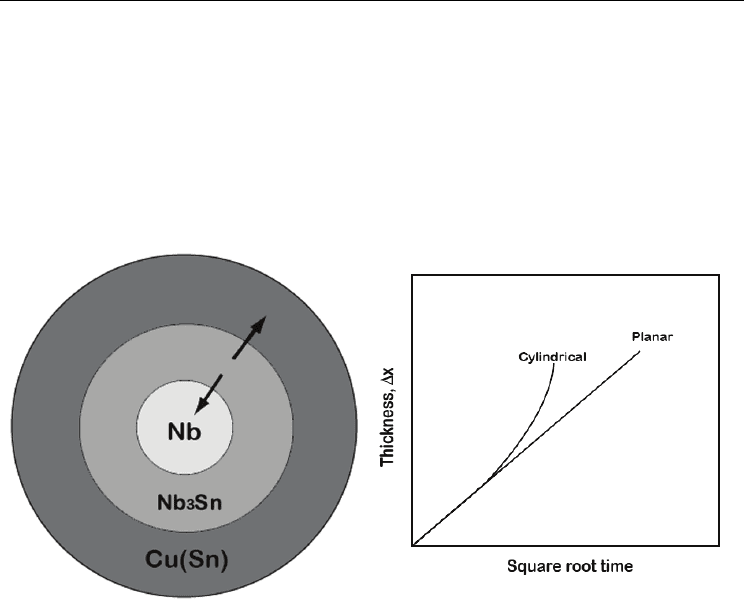
Fig. 7. (a) The growth of Nb3Sn product phase in the sample with cylindrical geometry is
shown. Arrows indicate the movement of the interfaces following which interfacial area
changes. (b) The change in layer with square root of time in the case of sample with planar
and cylindrical geometry is shown. Growth rate with planar interface will follow parabolic
law in the case of diffusion controlled process; however, it will deviate in the case of growth
in a sample with cylindrical geometry (van Loo, 1990).
Although Cu(Sn)/Nb diffusion couple experiment indicates that Sn is virtually only mobile
species, it is rather surprising if one considers the crystal structure of the A15 Nb
3
Sn
intermetallic compound, as shown in Fig. 9. Sn atoms occupy the body corner and centre
positions and two Nb atoms occupy each face of the cube. It can be clearly visualize that Sn
atoms are surrounded by 12 Nb atoms. On the other hand, Nb atoms are surrounded by 10
Nb atoms and 4 Sn atoms. Since Nb has as its nearest neighbors Nb atoms, it can diffuse via
its own sublattice if vacancies are available. In contrast, in a perfect (antisite defect free)
crystal, there is no possibility for diffusion of Sn. If Sn jumps to a nearest neighbor sublattice
position, it will be at a wrong place, since these sites should be occupied by Nb atoms and
the jump is not allowed. However, certain amount of diffusion of Sn is still possible because
of antisite and vacancies always present in the structure. According to theoretical analysis
conducted by Besson et al. (Besson et al., 2007) as shown in Fig. 10a, there is a significant
concentration of antisite defects in the compound, even at the stoichiometric composition.
Superconductor
54
(a) (b)
Fig. 8. (a) The growth of the Nb3Sn phase and (b) corresponding composition profile are
shown in a diffusion couple of Cu(8at.%Sn)/Nb at 775
o
C annealed for 330 h (Kumar &
Paul, 2009).
Following their calculation, the concentration of vacancies in Nb sublattice is much higher
than the vacancies present in Sn sublattice. Nb can exchange position with the vacancies at its
own sublattice. The presence of Nb antisite defects should further increase the diffusion rate of
Nb. On the other hand, diffusion of Sn is possible only by the exchange of vacancies present on
Nb sublattice with Sn antisite defects. This kind of jump is allowed since antisite Sn will move
to Nb sublattice as antisite defects only. Nevertheless, the diffusion rate of Nb should always
be higher than Sn in the Nb
3
Sn compound, as shown in Fig. 10b based on the structural aspects
alone. Of course, we are considering here only lattice diffusion. In the case of grain boundary
diffusion, diffusion rate of Sn could be somewhat higher. Unfortunately, there is no
experimental data available in the binary system Nb-Sn about the relative mobilities of the
species in Nb3Sn phase to confirm these calculations. Till date experimental results on
diffusion rates of elements are available only in two other A15 intermetallic compounds, V
3
Ga
(Bakker, 1985) and V
3
Si (Kumar et al., 2009). In these cases, not surprisingly, diffusion rates of
Ga and Si are found to be negligible compared to the diffusion rate of V. The well known
Cu
3
Au rule (d'Heurle & Gas, 1986) states that the if the ratio of major to minor element is equal
or greater than 3 in an intermetallic compound, the major element will be the faster diffusing
species. This empirical rule was developed based on the experimental data available in the
literature. Hence, it is rather surprising to find that Sn is practically the only moving species in
the Nb
3
Sn compound growing between Nb/(Cu-Sn) diffusion couple.
Kumar and Paul (Kumar & Paul, 2009) did further experiments to study the effect of Sn
content of the bronze alloy on the growth rate. Conventional diffusion couple experiments
were conducted to study the growth of the phase with planar interface geometry. In a
multifilamentary structure corrugated layer was always found, which resulted into a quite
high standard deviation from the measured average layer thickness. Hayase & Kajihara
(Hayase & Kajihara, 2006) argued that the corrugated structure is found because
multifilamentary structure, which is cylindrical in geometry. They reported that the
thickness of the uniform layer was similar to the one found by Kumar and Paul, as shown in
Fig. 10a. However, if an uniform layer grows in a diffusion couple with a planar interface,
then an uniform layer also should grow in the sample with a cylindrical geometry. The

Microstructure, Diffusion and Growth Mechanism
of Nb
3
Sn Superconductor by Bronze Technique
55
A=Nb
B=Sn
Fig. 9. A15 crystal structure is shown with the nearest neighbors of Nb and Sn.
(a) (b)
Fig. 10. (a) Defect concentraions calculated by Besson et al. (Besson, 2007) in Nb
3
Sn phase at
1000K. Data reported by open and closed symbols are calculated following local density
approximation (LDA) and generalized gradient approximation (GDA). (b) Tracer diffusion
coefficient of Nb (
*
Nb
D ) and Sn (
*
Sn
D ) calculated are shown.
radial distribution of the flux should be the same over the whole layer in the latter case. In
fact, Kumar and Paul noticed that the layer grows uniform in thickness, but only locally. At
different locations of the diffusion couple, large differences in the thickness of the product
layer were found. As shown in the experimental results for Cu(8at.%Sn)/Nb diffusion
couple annealed at 775
ο
C for 150 hrs in Fig. 11, the layer thickness varies over a wide range
of 28.5-42 μm. On the otherhand, looking at one particular micrograph; it looks like Nb
3
Sn
phase grows more or less uniformly. In general, waviness in the product layer is found
because of various reasons. For example, incubation period could be different at different
places. Further, different diffusion rates because of different orientation of the grains also
could cause waviness. In the present case, however, it might happen because of small
inhomogeneity in the Cu(Sn) alloy. Following Farrel et al. (Farrel et al., 1974), small
difference in Sn concentration can cause significant difference in the thickness of the product
Superconductor
56
layer. Despite the homogenization treatment, some inhomogeneity can still be present in the
Cu(Sn) alloy, which may cause thickness variation at different locations of the diffusion
couple.
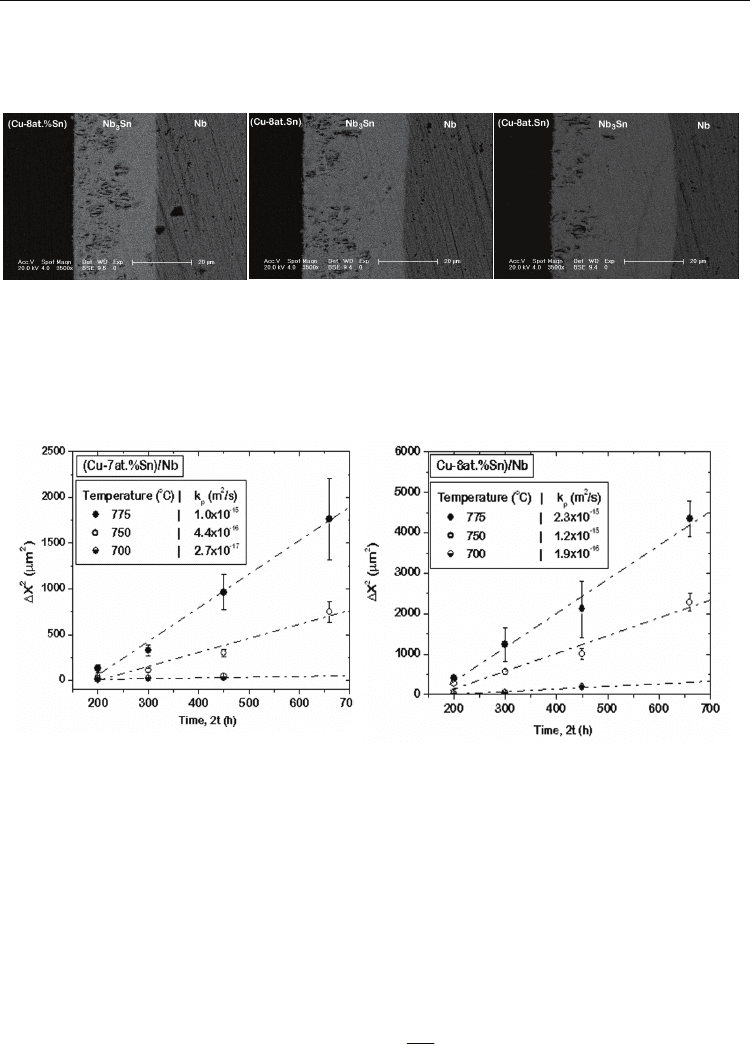
Fig. 11. Different layer thickness in the same diffusion diffusion couple annealed at 775
ο
C
for 150 hrs at different locations is shown (Kumar and Paul, 2009).
Further the growth of the product phase for 7 and 8 at.%Sn in the Cu(Sn) alloy at different
temperatures is shown in Fig. 12 a and b. The considerable deviation from the average
values is evident from the standard deviation bar. It is very difficult to determine the exact
Fig. 12. The variation of layer thickness with annealing time and temperature is shown in (a)
Cu(7at.%Sn)/Nb and (b) Cu(7at.%Sn)/Nb diffusion couple (Kumar & Paul, 2009).
growth exponent from these results and we have considered the parabolic growth of the
phase. Following the parabolic growth constant can be calculated using
(
)
3
2
0
2( )
Nb Sn p
xkttΔ=− (1)
where
3
Nb Sn
xΔ is the thickness of the Nb
3
Sn phase layer and t is the total annealing time and
t
0
is the incubation period. The activation energy for growth was further calculated from the
Arrhenius equation
0
exp
pp
Q
kk
RT
⎛⎞
=−
⎜⎟
⎝⎠
(2)
Microstructure, Diffusion and Growth Mechanism
of Nb
3
Sn Superconductor by Bronze Technique
57
where
0
p
k is the pre-exponential factor, Q is the activation energy, R is the gas constant and
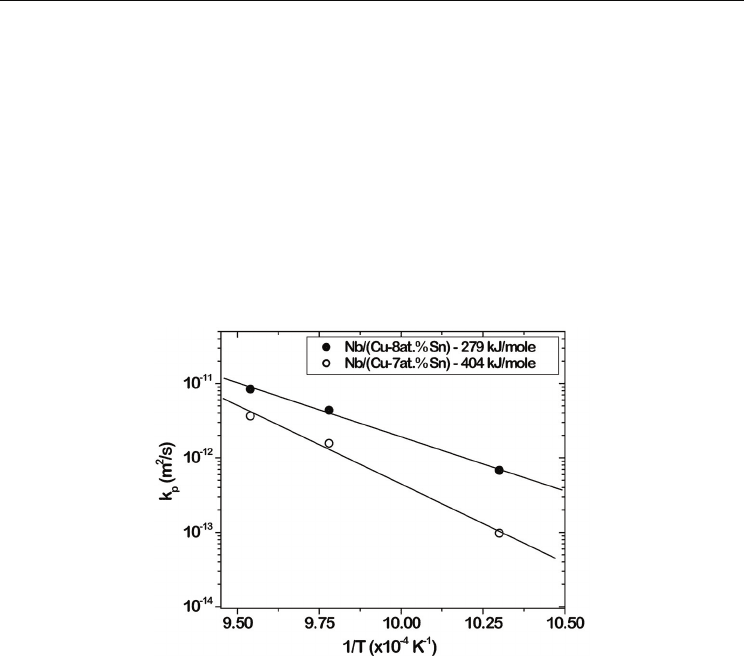
T is the temperature in Kelvins. Fig. 13 shows the growth rate of the product phase in (Cu-
7at.%Sn)/Nb and (Cu-8at.%Sn)/Nb diffusion couples at three different temperatures, 700,
750 and 775
ο
C. Following our analysis, we found that the activation energy for the growth
of the phase in (Cu-7at.Sn)/Nb couple is 404 kJ/mole, whereas, in (Cu-8at.Sn)/Nb couple is
279 kJ/mole. It can be seen that there is a significant decrease in the activation energy for the
diffusion along with a small change in the Sn concentration of the bronze alloy. By
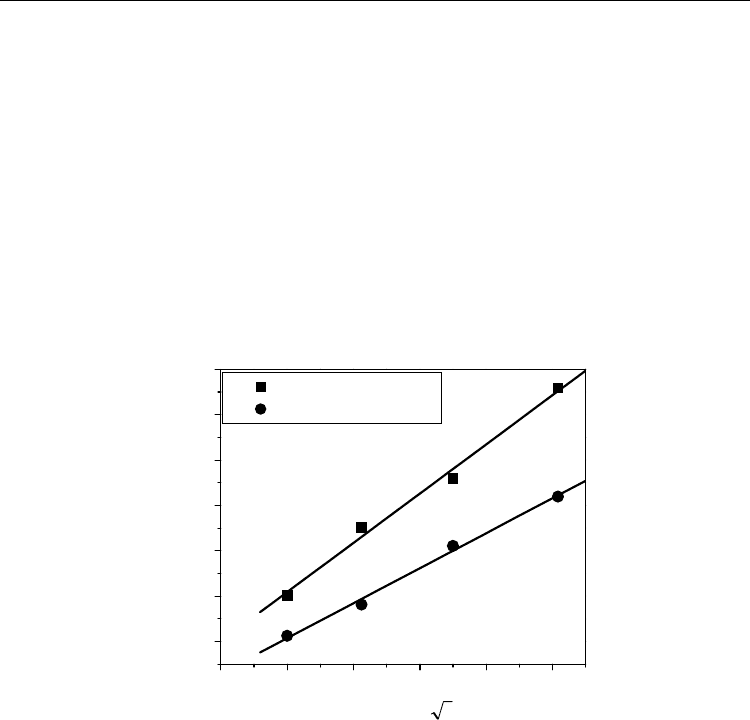
comparing the growth of the product phase for different Sn concentrations, as shown in Fig.
14, it was noticed that there was around 50 percent increase in the layer thickness with 1
at.% increase in the Sn concentration. In order to understand this behaviour,
thermodynamic analysis was conducted to examine the change in the driving force for
reactive diffusion with the change in the Sn content (Laurila et al., 2010).
Fig. 13. The Arrhenius plot of the parabolic growth constant is shown (Kumar & Paul, 2009).
4. Thermodynamics, phase diagrams and driving force for diffusion
Thermodynamics of materials provide fundamental information both on the stability of
various phases and on the driving forces for chemical reactions and diffusion processes in
the system under investigation. Even though the complete (global) phase equilibrium is
seldom met in practical applications, stable or metastable local or partial equilibria are
generally attained at interfaces, which ensures that thermodynamics together with kinetic
information provides a feasible method for analyzing the interfacial reactions in wide range
of different material systems.
4.1 The Gibbs energy
The combined statement of the first and second laws of thermodynamics can be stated in
terms of temperature (
T) and pressure (p) with the Gibbs free energy as follows (in closed
systems):
GUpVTSHTS
≡
+−=− 3)
Superconductor
58
where
U, V, H, and S are the internal energy, the volume, the enthalpy and the entropy of
the system, respectively. Given that
G = G(T,P,n
1
, n
2
,...) in an open system, with n
i
being the
number of moles of component
i, the derivative of Eq. (1) yields:
ii
i
dG SdT Vd
p
dn
μ
=− + +
∑
(4)
where
μ
i
is the chemical potential of component i. At a constant value of the independent
variables
P, T and n
j
(j
≠
i) the chemical potential equals the partial molar Gibbs free energy,
(
∂
G/
∂
n
i
)
P,T,j
≠
i
. The chemical potential has an important function analogous to temperature
and pressure. A temperature difference determines the tendency of heat to flow from one
body into another and a pressure difference on the other hand the tendency towards a
bodily movement. A chemical potential can be regarded as the cause of a chemical reaction
or the tendency of a substance to
diffuse from one phase to another. This will be discussed
further shortly.
8 1012141618
10
20
30
40
50
60
70
(Cu-8 at.%.Sn)/Nb
(Cu-7 at%.Sn)/Nb
t
Layer thickness, Δx (μm)
Square root of time, (h
1/2
)
Fig. 14. The comparison between layer thicknesses at 775
ο
C is shown (Kumar & Paul, 2009).
With the help of the Gibbs free energy function the equilibrium state of the system can be
investigated. The phase equilibria in any system are computed by summing up first all the
Gibbs (free) energies of individual phases (i.e. solutions and compounds) and then
minimizing - according to the second law of thermodynamics, the total energy of the
system. At constant temperature and pressure the total Gibbs energy of n-component
system can be written as
1
() ( ln )
nn
oE
tot i i i i m
ii
iii
GGn
y
xG RT x x G
ϕϕ ϕ
ϕϕ
=
== ++
∑∑ ∑ ∑ ∑
(5)
where y is the relative amount of a phase
φ and x
i
is a mole fraction of a component i in the
system. The parameters
o
i
G in Eq. 3 represent the partial molar Gibbs energies or chemical
potentials of the pure components and are taken either from the SGTE databank (Dinsdale,

Microstructure, Diffusion and Growth Mechanism
of Nb
3
Sn Superconductor by Bronze Technique
59
1991) or from the literature.
E
m
G is the excess molar Gibbs energy taking into account the
interactions of the constituents in all the phases to be considered.
4.2 Calculation of phase diagrams
Phase diagrams have some times been regarded as something that can only be determined
experimentally. However, as phase diagram is a graphical manifestation of the state of
equilibrium, it is possible to construct any kind of phase diagram if the equilibrium state of
the system has been calculated. This in turn requires the evaluation of the thermodynamic
properties of the corresponding system by assessing all the available experimental
information in thermodynamic terms. Generally one is interested in equilibria under
constant pressure and therefore the Gibbs free energy is the expedient thermodynamic
function (Equation (5)). The procedure in a “nutt shell” is as follows: Analytical expressions
for the free energy functions of all phases must be derived first. It is to be noted that the
thermodynamic models used in the description of the Gibbs free energy of different phases
are important, since successful and reliable calculation relies on the appropriate choice of
model for each phase appearing in the system. Then by summing up all the Gibbs free
energies of individual phases, the phase equilibria can be computed by minimizing the total
Gibbs free energy of the system. The matemathical expressions for the Gibbs free energy of
the individual phases contain parameters which have to be optimized to give the best fit to
all the experimental information available. A major difficulty arises from the fact that the
value of a parameter (which is used in the description of a simple system) will affect the
evaluation of all the related higher systems. Thus, one should use as much information as
possible from different sources in each optimisation process. The preceding approach is
known as the CALculation of PHAse Diagrams (CALPHAD) method (Saunders &
Miodownik, 1998; Kaufman & Bernstein, 1970).
The CALPHAD method is based on the axiom that complete Gibbs free energy versus
composition curves can be constructed for all structures exhibited by the elements right
across the whole alloy system. This involves the extrapolation of
(G,x)-curves of many
phases into regions where they are metastable and, in particular the relative Gibbs free
energies for various crystal structures of the elements of the system must therefore be
established. These are called as lattice stabilities and the Gibbs free energy differences
between all the various potential crystal structures in which an element can exist need to be
characterized as a function of temperature, pressure and volume. Information about the
driving forces of different reactions in the system can also be obtained from the
(G,x)-
diagrams. This information is extremely useful, when, for example, diffusive phase growth
is rationalized.
CALPHAD method is commonly used for evaluating and assessing phase diagrams. The
power of the method is clearly manifested in its capability to extrapolate higher order
systems from lower order systems, which have been critically assessed, thus reducing the
number of experiments required to establish the phase diagram. The determination of
binary equilibrium diagrams usually involves the characterization of only a few phases, and
experimental thermodynamic data on each of the phases is generally available in various
thermodynamic data banks as well as in the literature. However, when handling
multicomponent systems or/and metastable conditions there is a need to evaluate the Gibbs
free energies of many phases, some of which may be metastable over much of the
composition space. Readers interested in the actual thermodynamic modelling procedures

Superconductor
60
and issues and problems associated with them are referred to vast amount of available
literature, for example review articles and books (Saunders & Miodownik, 1998; Kaufman &
Bernstein, 1970; Lukas et al., 2007; Ansara, 1990; Hillert, 1998).
4.3 Driving force for diffusion
The total Gibbs energy of the system can be expressed as a function of chemical potentials,
which are related to the activities of the components as follows:
0
() ln
ii
i
TRTa
ϕ
μμ
≡+ (6)
where
μ
i
and a
i
are chemical potential and activity of element i. As explained above, the
chemical potential of a component i will have the same value in all the equilibrated phases
and therefore the difference in activity of a component (i.e. the driving force for its diffusion)
will vanish at equilibrium. In the case of local equilibrium there are concentration gradients
in the adjoining phases, but due to the chemical interaction between component atoms the
diffusion is not necessarily driven by these gradients. Instead, the difference in chemical
potential is the real driving force for diffusion as already discussed. A fundamental
condition is that no atom can diffuse intrinsically against its own activity gradient (van Loo,
1990). If it would climb up its own activity profile, it would mean that the component moves
from the region of lower chemical potential to a region of higher chemical potential – a
process that does not spontaneously occur in nature. If a maximum is found experimentally
in the activity profile of a component, the intrinsic movement of the other components
causes it. This requirement can be used when movement of different species in a given
reaction layer sequence are considered. To aid this analysis, another type of equilibrium
diagrams – potential diagrams- can be utilized (Laurila et al., 2004).
5. Thermodynamic-kinetic analysis of the growth of Nb
3
Sn
As already discussed there are basically three open questions concerning the growth of
Nb
3
Sn by the bronze technique:
1.
Why Sn is the only diffusing species during the reaction?
2.
Why there is such a drastic increase in the thickness of the Nb
3
Sn grown under the same
experimental conditions, when Sn content of the Cu(Sn) alloy is increased from 7 at.%
to 8 at.%?
3.
Is there solubility of Cu to Nb
3
Sn?
What has been stated earlier indicates the thermodynamic-kinetic approach can be utilized
to find answers to the above three questions.
With the aim to calculate the thermodynamic parameters to understand the diffusion
process, the ternary phase diagram of the Cu-Nb-Sn system is calculated with the help of the
assessed data from the references (Hämäläinen et al., 1990; Toffolon et al., 2002; Shim et
al.,1996). In these calculations, all intermetallic compounds are modeled as binary
compounds, since dissolution of ternary elements are found to be negligible based on the
available information. In addition, no ternary compounds are known to exist in the Cu-Nb-
Sn system. Isothermal section calculated at 700
°C is shown in Fig. 15. It is in general
consistent with the very recent publication on the thermodynamic assesment of the Cu-Nb-
Sn system (Li et al., 2009), except for two details. Firstly, in (Li et al., (2009) the Nb
6
Sn
5
phase
is stable already below 700
°C, different from our calculations and results of (Pan et al, 1980).