John T. Sample, Elias Ioup. Tile-Based Geospatial Information Systems
Подождите немного. Документ загружается.

196 11 Tile Creation using Vector Data
11.3 Queries
Querying, and ultimately the storage system for vector data, will be the primary
focus of this chapter. Only one query is important to the process of tiling vector
features. Each time a tile must be created, the tiling system will request all vector
features that lie within the tile bounds. Only requiring one basic query is useful
because the queries used in tile creation are completely deterministic. A complete
list of queries used in tile creation may be created ahead of time, and the list will
not change over repeated tile creation runs. Since the tile scheme is known ahead of
time, the geographic bounds used in the query will be known ahead of time as well.
Therefore, improving query performance is actually only important for the subset of
queries which request data lying within tile bounds. While this may seem obvious,
most techniques for improving geospatial query performance tend to be generalized
to support any geospatial query. Since the variations in our queries are so small, we
can improve upon the standard techniques.
Feature selection based on map scale is a possible variation to the geospatial
queries which is important. Consider the case where roads are the vector data used
for tiling. For tiles that cover a large area, such as the entire United States, it would
be unreasonable to try and draw every road feature that lies within the tile. The re-
sults of such a query may be all or a large percentage of the roads in the overall
dataset. Performing the query would be slow, if not impossible, and the rendered
tile cluttered and unreadable. Rather than draw every feature lying in the tile, only
a subset of the features should be drawn. For the roads example, it would make
sense to draw only interstates and major highways at the map scale where the entire
United States is visible. In general, in cases where the vector data source is quite
large, consideration should be given to selecting features to draw based on the map
scale of the destination tile. For roads, we may choose to have interstates and ma-
jor highways drawn at all zoom levels, minor highways drawn at zoom level 5 and
above, and all roads drawn at zoom level 8 and above. Using map scale, or zoom
level, to select features does add complexity the queries used to generate tiles. How-
ever, it will generally improve performance because lower zoom level tiles will have
fewer features to retrieve. Filtering features based on scale also does not change the
fact that the tiling queries are completely deterministic. The determinism makes it
possible to design a highly targeted storage methodology for tiling vector data.
11.4 Storage
There are two primary methods of storing vector data for tiling: database storage
and file system storage. Database storage of vector data is more common than file
storage when the data is to be retrieved using geospatial queries. File storage is more
commonly used for archival and distribution of vector data as fixed data sets. We
will describe a file storage system which is designed to support high performance
tile creation from vector data.

11.4 Storage 197
11.4.1 Database Storage
Most modern database systems provide support for geospatial data, including stor-
ing geometries as first class data types, supporting complex geospatial queries, and
providing geospatial indexes. Common examples include Oracle with the Spatial
extension, PostgreSQL/PostGIS, and MySQL. Normally, vector data is stored in a
database with each attribute of the feature appearing as a field in a database table,
including the geometry. Because database tables have a fixed schema, features must
have the same attributes to be stored in the same table. As a result, there is usually
a direct mapping between geospatial layers and database tables. Many tools exist to
import data from geospatial file formats directly into tables (such as shp2pgsql for
PostgeSQL).
Querying for geospatial data is supported by these databases without any extra
development. The query for all features in the geospatial bounds of a tile is shown
in Listing 11.1.
Listing 11.1 Geospatial query for vector features within a tile’s bounding box. Based on Post-
greSQL/PostGIS.
1 SELECT ∗ FROM FeaturesTable WHERE feature geometry && ST MakeBox2D ( ST Point
( −90, 0) , ST Point (0 , 90) ) ;
The operator && determines whether the bounding boxes of two geometries overlap.
In this example, the query is comparing the feature geometry with the tile (1, 1)
at zoom level 2.
Indices should be created to provide adequate performance of these queries.
The two most commonly used geospatial indices are the R-Tree index (usually the
R*-Tree variant) and the Quadtree. The R-Tree index tends to be preferred over
the Quadtree because it provides better query performance over a wider variety of
geospatial queries. The database controls the creation of indices, though some level
of tuning is allowed by the user. Regardless of what type of geospatial index is used,
the database tables should be clustered. Clustered data is ordered on disk according
to its location in the index. As a result, the database must access only a localized
area of the disk when solving a query using the index. Index clustering is essential to
query performance when the query is expected to return multiple results. An exam-
ple of creating a clustered index in PostgreSQL/PostGIS is shown in Listing 11.2.
Listing 11.2 Example SQL for creating a clustered PostGIS R-Tree index in PostgreSQL.
1 CREATE INDEX spatial index ON FeaturesTable USING GIST ( feature geometry );
Creating the database tables from vector data layers and using clustered indices are
sufficient to create a functioning database environment for vector tiling. No changes
to the geospatial query are necessary. A database will automatically determine if an
index should to be used in the evaluation of a query.
Additional modifications to the geospatial database may be implemented to in-
crease performance. Given the foreknowledge of the query patterns to the database,
we can customize the way the features are stored to simplify evaluation for the

198 11 Tile Creation using Vector Data
known queries. The first case to examine is the one where only a subset of fea-
tures are used in tiles with low zoom level. A simple modification to the query in
Listing 11.2 will add support for this functionality, as seen in Listing 11.3.
Listing 11.3 Geospatial query with filter on zoom level.
1 SELECT ∗ FROM FeaturesTable WHERE feature geometry && ST MakeBox2D ( ST Point
( −90, 0) , ST Point (0 , 90) ) AND feature min zoom level <=2;
This query will accomplish the goal of retrieving only a subset of the features inside
a tile, depending on the scale. However, there is a problem. The query on bounds
and scale requires different optimizations depending on the query parameters. When
the query zoom level is high and the query bounds are small, a clustered geospatial
index will provide the best performance. On the other hand, when the query zoom
level is small and the query bounds are large, a clustered zoom level index will
provide the best performance. Given that only one index on a table may be clustered,
it is inevitable that one of these two sets of queries will not perform as efficiently as
possible.
The solution is simple: create multiple tables to hold data for different scales. The
key zoom levels where the subset of tiles being rendered changes are known ahead of
time. A separate table may be created to hold the features whose minimum display
zoom level is less than a particular key zoom levels. For example, if the key zoom
levels are zero, eight, and fourteen then our roads layer will have tables Roads_0,
Roads_8,andRoads_14. Each of these tables holds all features whose minimum
zoom level is less than or equal to the table zoom level. The tiler need only query
the table which matches the zoom level of the tile being rendered at the moment.
No additional filtering on zoom level need be done in the query because the filtering
has been performed ahead of time.
The only drawback to creating multiple tables for each layer is that features will
be duplicated between tables. For example, interstates should be represented in all
three roads tables. However, additional performance is possible by reducing the res-
olution (i.e. the number of points in the geometry) of features in the tables with
lower zoom level. The reduced resolution will decrease the size of the table and in-
crease the speed of rendering a tile. Creating multiple tables increases the required
space to hold the vector data, but disk is cheap, and vector data is relatively small,
especially in comparison to imagery. The performance benefits of creating a table
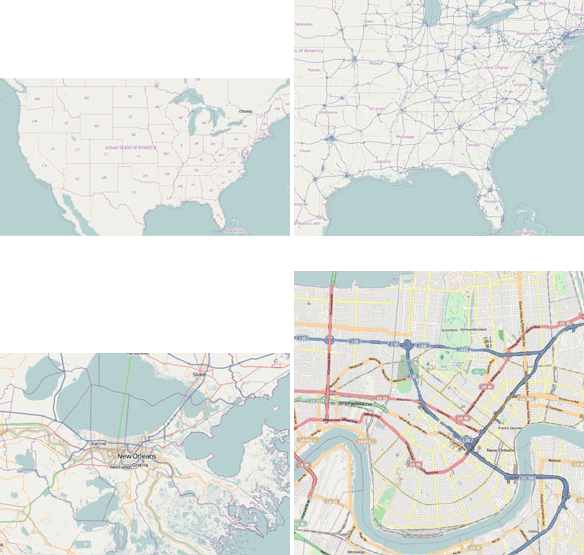
for each key zoom level far outweigh the storage costs. Figure 11.3 shows different
key zoom levels used by OpenStreetMap.
One of the benefits of a database is that it automatically organizes and searches
a wide variety of data types. A developer can store data in a database with little
or no custom development. The flip side of the automatic and general nature of a
database is the limited amount of customization that is possible. The R-Tree index
included in a database is a good example of this tradeoff. The R-Tree index is a
good geospatial index which increases performance of a wide variety of geospatial
queries. However, the database completely manages the organization of data in the
R-Tree index. The application developer has no way of guiding the organization of
data in the R-Tree. We know ahead of time which vector features lie within which

11.4 Storage 199
(a) (b)
(c) (d)
Fig. 11.3 Key zoom levels used by OpenStreetMap when rendering their vector data.
tiles. It would provide a performance benefit if the application developer could en-
sure that the R-Tree page splits matched tile splits, but this is not possible. Such
customization would be difficult even in a Quadtree, which organizes data into tiles
by default.
The loss of customization inherent in using a database would be acceptable if
the database provided significant advantages for a vector tiling system. However,
a tiling system does not require much of the functionality provided by a database.
Core database features like advanced locking of data and rollback availability are
unnecessary for a vector datastore which is primarily read-only. These database fea-
tures are not free; they are a core part of the database which are included at a cost to
performance. For example, a banking system which requires accuracy in monetary
transactions definitely requires atomic transactions in its datastore.
200 11 Tile Creation using Vector Data
11.4.2 File System Storage
In contrast to a database, file system storage offers little in the way of automatic
functionality but provides the developer with the ability to fully customize the stor-
age implementation in the overall system. A tiling system is a good example of an
application which can benefit from using a file system for storage. The deterministic
nature of the queries performed when tiling features provides an environment which
can benefit from the customization allowed by a file system. Using our knowledge
of the vector tiling system, we can develop a custom file storage implementation
which is optimized for our system.
The first departure in our file storage implementation from the database design
is in how vector layers are managed. In the database, each layer is mapped to a sep-
arate table. This design is necessary because database tables have a fixed schema
which requires all records to share the same columns. In general, different vector
layers will not have the same feature attributes (which map to table columns) and,
as a result, must be stored in different tables. A custom file format does not have
this restriction. The file store may be designed to hold features from many different
layers. There is a good reason to store features from multiple layers in the same file.
The tile system uses features from multiple layers when drawing tiles. The design of
a custom storage system should partition data only when it benefits the overall effi-
ciency of the system. Usually, the performance benefit comes from the query access
patterns. Since the queries in the tiling system do not require features partitioned by
layers, there is no reason to do so. The simplest way to store features from multiple
layers in the same file is to store a variable size list of the attribute names and val-
ues for each feature. This method obviously requires more storage space than fixed
schema systems. As a means to reduce storage requirements, the attribute names for
the different feature layers may be stored once in the file header and linked to each
feature. However, storage is generally cheap so the added complexity may not be
worth the effort.
In contrast, the geospatial area is a property of the vector features that affects
query access patterns. Therefore, partitioning data according to location is impor-
tant for an efficient file storage system. Databases improve the performance of the
geospatial queries by using a geospatial index. We already mentioned that by auto-
matically creating these indices, the database would never provide a geospatial index
optimized for our tiling application. With a custom file storage implementation, we
can optimize storage for our tiling application. We can take advantage of the fact
that geospatial queries used by the tiling system always match tile boundaries. As a
result, we index and cluster the vector data using tile boundaries.
The simplest index partitions the data into multiple files whose bounds align with
the tile bounds at one chosen zoom level. However, as we have seen with image tiles,
at high zoom levels the number of files becomes unwieldy. Instead, we partition the
data according to tile location but store each partition in one file. The start byte and
length of every tile partition is stored separately so that each tile may be accessed
independently. A feature is placed into a tile partition if its geospatial bounds overlap
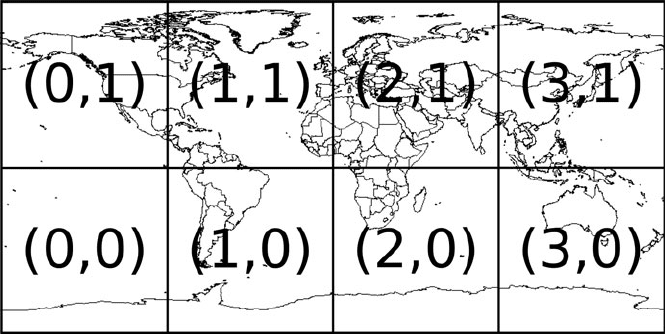
the bounds of the file’s corresponding tile (see Figure 11.4). It is likely that a few of

11.4 Storage 201
the features will overlap multiple tiles. In this case, the features are placed into each
overlapping tile partition. The result is a file storage scheme which is by default
also a clustered index. Using features stored on the file system is easy. An entire
tile partition may be loaded into memory, and the tile it represents is rendered. All
subtiles at higher zoom levels may be rendered as well. Alternatively, features may
be rendered as they are read from the file system without caching them in memory,
allowing lower resource systems to use the same scheme.
To support memory caching, the tile partitions must be sized to fit into memory.
Thus, the zoom level which defines the boundaries of the tile partitions should be the
lowest zoom level whose tile partitions fit into the memory of the rendering system.
Determining the appropriate target zoom level will require some experimentation,
but if performance is a concern, the results will be worth it.
Fig. 11.4 A map made up of polyline vector features. Each polyline is partitioned according to
which zoom level 2 tile it lies within. For example, Antarctica would be placed in tiles (0,0), (1,0),
(2,0), and (3,0).
Minimum rendering zoom level is another vector feature property which may be
managed by partitioning data. For database storage, a table was made for each key
zoom level in the tiling system. The same technique may be used for file storage.
Each zoom level which uses a different subset of features for rendering has a sep-
arate file to store features. That directory stores the feature file and its index. The
files for a key zoom level are used when rendering tiles at that zoom level or higher
(until the next higher key zoom level).
As with the database version of this optimization, overall storage cost is increased
by redundantly storing features. Conversely, the average amount of data accessed
when performing a query is reduced because there are fewer features in each file.
The result of this custom vector data store is that all queries are essentially precom-
puted so that the disk accesses are all predetermined. Each file will only be read off
disk once, and all tiles may be rendered by looking at only one file. Once data is in
202 11 Tile Creation using Vector Data
memory, the cost of filtering features to render tiles with smaller geographic areas
is small. Disk access is much more costly than in-memory computation.
Experimentation shows that the performance of a file-based feature store out per-
forms a standard database. The feature data used for the testing is the road network
of the United States. The data comes from the NAVTEQ corporation and is the
same dataset used by the commercial Web-mapping systems. We created a basic
file-based storage system with features partitioned at zoom level 11 and stored in
a file. We also created a PostgreSQL/PostGIS datasbase to store the same features.
The database table was clustered using an R-Tree index on the data. The experiment
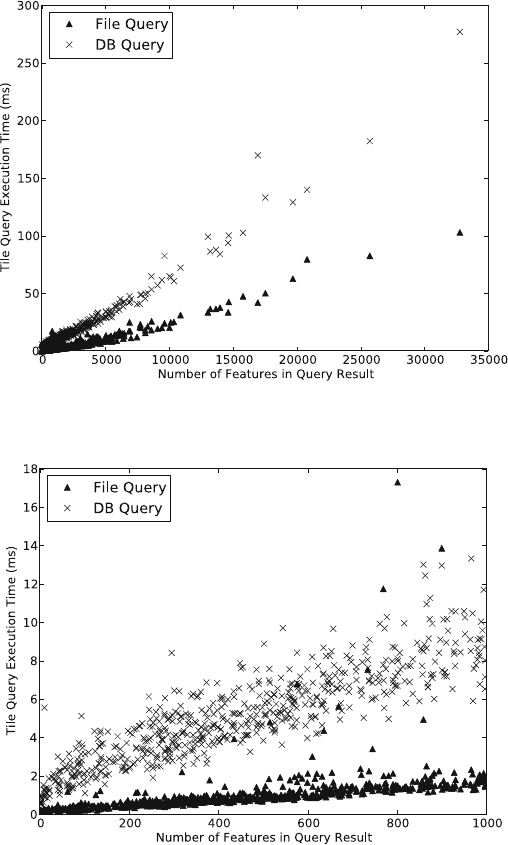
query requests all the features in a tile. The tests were performed using a random
list of tiles from zoom level 11 located in the continental United States. The time to
execute each query and the number of features in the queried tile was recorded. The
results, as seen in Figure 11.5, show that the queries to the file store are approxi-
mately twice as fast as those to the database.
The experimental results make sense because the file-based tile storage scheme
is designed specifically for rendering tiles from vector data. Similar optimizations
are possible for database stored vector data; splitting tables by key zoom level
was already discussed, but data could also be indexed according to precomputed
tile location at a specific zoom level. However, with these changes, managing the
database storage becomes significantly more complicated, even more than the file-
based storage (querying multiple layer tables for data, handling features which cross
tile boundaries, etc.). A file store can provide better performance with lower devel-
opment cost, lower administrative overhead, and better portability than databases.

11.4 Storage 203
(a) Results for all tile queries.
(b) Results for tile queries with fewer than 1000 featuers.
Fig. 11.5 Comparison of geospatial query execution times between a database and a file-based
feature store. Each geospatial query requests all features in a tile from zoom level 11. The file
query outperforms the database, most significantly when the number of features in the query tile
grows.

Chapter 12
Case Study: Tiles from Blue Marble Imagery
In this chapter we will present a complete end-to-end system for creating and storing
tiled images from a freely available worldwide set of imagery. The system will read
source imagery, cut it into tiled images, and store the tiled images to cluster files.
NASA’s Blue Marble Next Generation Imagery (BMNG) is a composite image
of the Earth at 500 meters resolution taken by the MODIS satellite mounted sensor.
The BMNG imagery and information about it are freely available for downloadfrom
http://earthobservatory.nasa.gov/Features/BlueMarble/
The imagery comes in two formats: as a single raw image file 86,400 pixels wide
by 43,200 pixels high and as 8 smaller sub-images, 21,600 pixels by 21,600 pixels.
In this chapter we will present a pull-based tiling approach using the single large
image and a push-based tiling approach using the 8 sub-images.
Before we can begin tiling, we must determine the base zoom level that we will
use for our tile set. Both the single large image and the set of 8 sub-images have
the same geospatial and image resolution, so we will use the same base zoom level
for both image sets. Using the following equation, we can compute the degrees per
pixel for our Blue Marble imagery.
(360.0/84600 + 180.0/42300)/2 = 0.00425.
Since 0.00425 falls between level 7 (0.00549) and level 8 (0.00274), as shown in
Table 2.1, we will choose level 8 as our base level.
12.1 Pull-Based Tiling
The algorithm presented in this section will bring together six concepts already
presented in the book:
J.T. Sample and E. Ioup, Tile-Based Geospatial Information Systems: 205
Principles and Practices, DOI 10.1007/978-1-4419-7631-4
12,
c
Springer Science+Business Media, LLC 2010
