I. Ramos Arreguin (ed.) Automation and Robotics
Подождите немного. Документ загружается.

Control System of Underwater Vehicle Based on Artificial Intelligence Methods
293
On the base of achieved results of numerical researches (time diagrams presented on fig. 9
and direct and integral control quantity indexes included in (Szymak, 2004)) following
partial conclusions have been found:
1. in the case of sea current does not affect, control system precisely controls movement of
underwater vehicle along desired trajectory,
2. in the case of sea current affects, underwater vehicle is “pushed out” from desired
trajectory with force depended on velocity of sea current in direction of affecting (for
velocity V
p
= 0,9 m/s value of coordinate y exceeds the maximal error in Y axis),
3. action of sea current affects also stabilization of a course (for velocity V
p
= 0,9 m/s value
of a course exceeds the maximal error of course),
4. in other cases (below velocity V
p
= 0,9 m/s) values of maximal errors are exceeded only
in short time (1 or 2 second), what does not influence on quality of recorded video,
5. limitation of Ukwial control in the presence of stronger sea current (above 1 m/s)
comes from limited value of thrust vector, which is generated by driving system.
5. Comparison of simulation and experiment
Experimental researches were carried out in the naval harbour Gdynia. Remotely operated
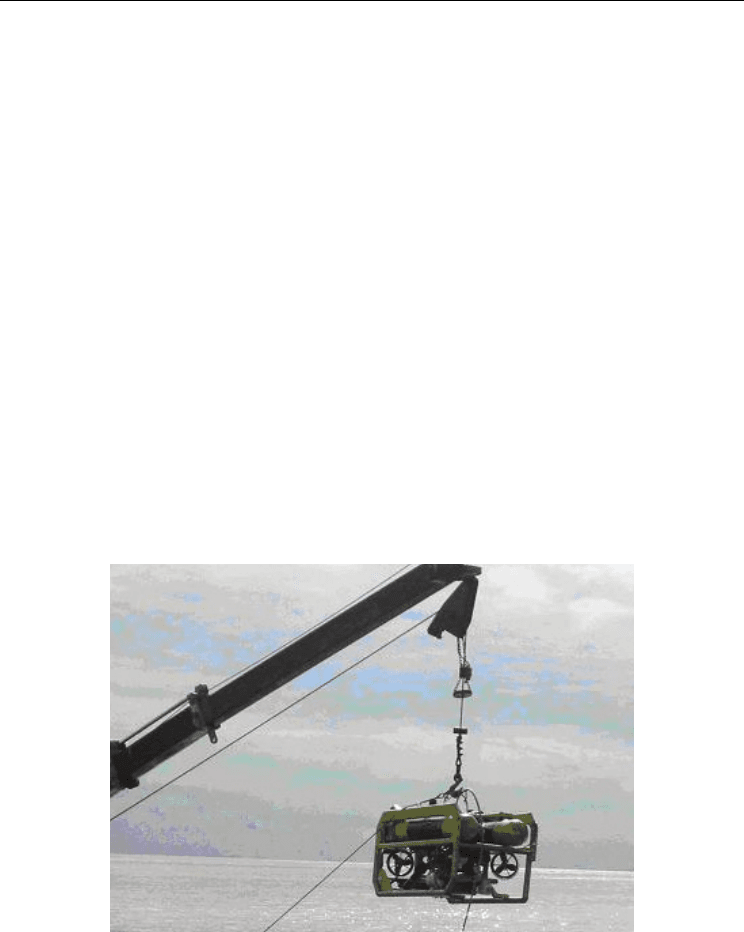
vehicle Ukwial was launched from the warship “Flaming” (fig. 10). Computer simulation
and experimental researches were executed without influence of sea currents. Selected
results of computer simulations with influence of sea current have been presented in fig. 9.
While experimental researches taking into account affect of sea current have not been
carried out yet.
Fig. 10. Launching of remotely operated vehicle Ukwial
Selected results of course’s fuzzy control have been presented on fig. 11. Results of other
controller action have been inserted in (Szymak, 2004). Direct and integral indexes have
been used to the evaluation of control quantity tested controllers.
Automation and Robotics
294
EXPERIMENT SIMULATION
0
10
20
30
40
50
60
70
80
90
100
0 5 10 15 20 25
czas [s]
kurs [deg]
0
10
20
30
40
50
60
70
80
90
100
0 5 10 15 20 25
czas [s]
kurs [deg]
a)
time [s]
time [s]
course [deg]
course [deg]
140
160
180
200
220
240
260
280
300
320
340
360
0 5 10 15 20 25
czas [s]
kurs [deg]
140
160
180
200
220
240
260
280
300
320
340
360
0 5 10 15 20 25
czas [s]
kurs [deg]
b)
time [s]
time [s]
course [deg]
course [deg]
0
20
40
60
80
100
120
140
160
180
200
0 5 10 15 20 25 30 35
czas [s]
kurs [deg]
0
20
40
60
80
100
120
140
160
180
200
0 5 10 15 20 25
czas [s]
kurs [deg]
c)
time [s]
time [s]
course [deg]
course [deg]
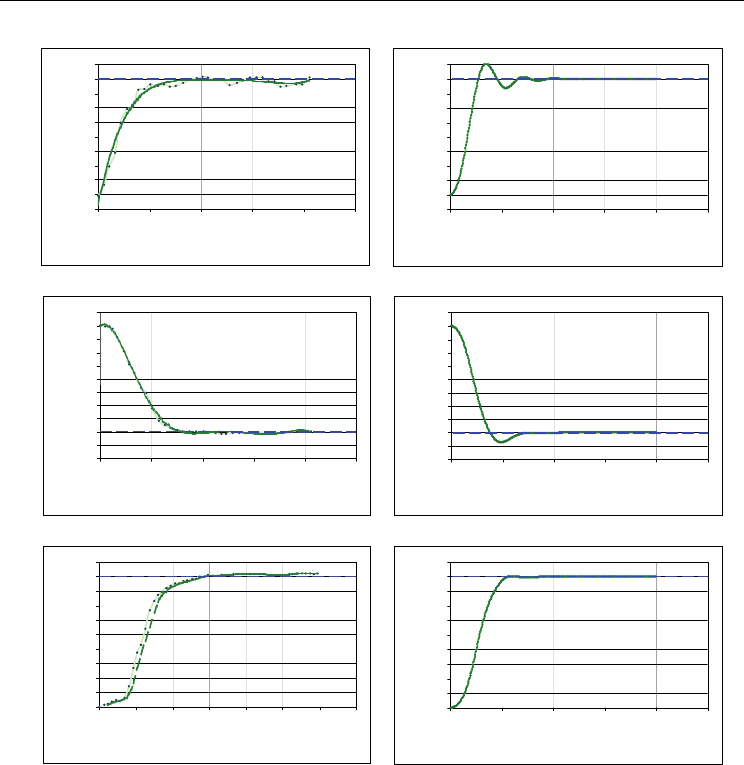
Fig. 11. Control of underwater vehicle’s course: a) from initial value 10° to set value 90°,
b) from initial value 340° to set value 180°, c) from initial value 0° to set value 180° with
additional manoeuvre in X axis
Received results of researches allow to formulate the following conclusions for selected
course FPD:
1. the better control quantity has been reached for underwater vehicle, which did not
make additional manoeuvre; in that case total hydrodynamic thrust vector generated by
propellers was used to change a course,
2. stabilizing influence of an umbilical cord on control of course can be observed on the
base of experimental researches compare to oscillation achieved in simulation; it
testifies that accepted model of an umbilical cord is not reliable,
3. designed course’s controller carries out change of course 180° in average time 10s.
Control System of Underwater Vehicle Based on Artificial Intelligence Methods
295
EXPERIMENT SIMULATION
0,0
1,0
2,0
3,0
4,0
5,0
6,0
7,0
8,0
0 102030405060
czas [s]
współrzędna z [m]
0,0
1,0
2,0
3,0
4,0
5,0
6,0
7,0
8,0
0 10203040
czas [s]
współrzędna z [m]
a)
time [s]
time [s]
coordinate z [m]
coordinate z [m]
2,5
3,0
3,5
4,0
4,5
5,0
5,5
6,0
0 5 10 15 20 25 30
czas [s]
współrzędna z [m]
2,5
3,0
3,5
4,0
4,5
5,0
5,5
6,0
0 5 10 15 20 25 30
czas [s]
współrzędna z [m]
b)
time [s]
time [s]
coordinate z [m]
coordinate z [m]
1,0
2,0
3,0
4,0
5,0
6,0
7,0
8,0
9,0
010203040
czas [s]
współrzędna z [m]
1,0
2,0
3,0
4,0
5,0
6,0
7,0
8,0
9,0
0 5 10 15 20 25 30
czas [s]
współrzędna z [m]
symulacja symulacja z szumem
c)
time [s] time [s]
coordinate z [m]
coordinate z [m]
simulation
simulation with noise
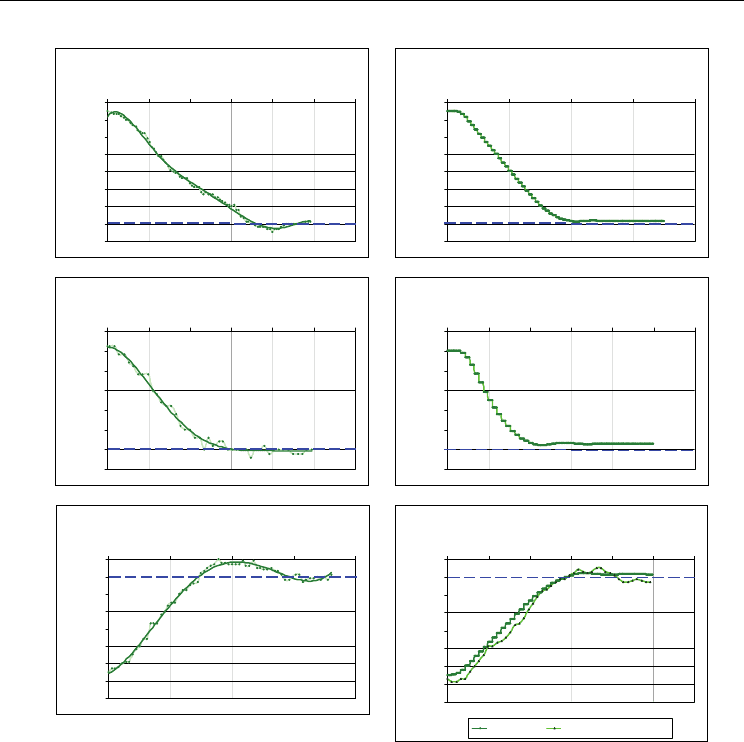
Fig. 12. Control of underwater vehicle’s draught: a) from initial value 0,5m to set value 7m,
b) from initial value 3m to set value 5,5m, c) from initial value 7,5m to set value 2m
(additional simulation with noise)
During the experimental researches also draught’s controller was verified correctly (fig. 12).
On the base of received results it can be stated that:
1. signal coming from sensor of draught is less precise and has more added noise than
signal of a course; it can be testified on the base of simulation with noise (curves
received from experiment and simulation with noise are very similar, fig. 12c),
2. precise control of draught, which value is digitized with step 0,1m, is more difficult; the
same control method gives worse results in control of draught than in control of course,
3. designed draught’s controller carries out change of 1m in average time 5s.
Unfortunately controllers of displacement in X and Y axis were not verified because of
incorrect operation of underwater positioning system.

Automation and Robotics
296
6. Conclusion
Results of carried out numerical and experimental researches, which were presented
partially in fig. 9, 11 and 12 confirmed that fuzzy data processing can be successfully used to
steer the underwater vehicle with set values of movement’s parameters.
Designed control system can be used to steer another underwater vehicles with different
driving systems, because control signals were forces and moment of forces, which were
processed to rotational speed of propellers with assistance of separate algorithm, specific for
definite type of the underwater vehicle.
Positive verification of course’s and draught’s controllers enabled their implementation in
the control desk of Ukwial.
Further researches should include: verification of controllers of displacement in X and Y
axis, applying of other self-adopting to varying environmental conditions control methods.
7. References
Driankov, D.; Hellendoorn, H. & Reinfrank, M. (1996). An introduction to Fuzzy Control,
WNT, ISBN 83-204-2030-X, Warsaw, in Polish
Fossen, T. I. (1994). Guidance And Control Of Ocean Vehicles, John Wiley & Sons Ltd., ISBN
978-0-471-94113-2, Norway
Garus, J. & Kitowski, Z. (2001). Fuzzy Control of Underwater Vehicle’s Motion, In: Advances
in Fuzzy Systems and Evolutionary Computation, Mastorakis N., pp. 100-103, World
Scientific and Engineering Society Press, ISBN 960-8052-27-0
Kubaty, T. & Rowiński, L. (2001). Mine counter vehicles for Baltic navy, internet,
http://www.underwater.pg.gda.pl/publikacje
Szymak, P. (2004). Using of artificial intelligence methods to control of underwater vehicle in
inspection of oceanotechnical objects, PhD thesis, Naval Academy Publication, Gdynia,
in Polish
Szymak, P. & Małecki, J. (2007). Neuro-Fuzzy Controller of an Underwater Vehicle’s Trim.
Polish Journal of Environmental Studies, Vol. 16, No 4B, 2007, pp. 171-174, ISSN 1230-
1485
18
Automatization of Decision Processes in
Conflict Situations: Modelling,
Simulation and Optimization
Zbigniew Tarapata
Military University of Technology in Warsaw, Faculty of Cybernetics
Poland
1. Introduction
Military conflict is one of the types of conflict situations. The automation of simulated
battlefield is a domain of Computer Generated Forces (CGF) systems or semi-automated
forces (SAF or SAFOR) (Henninger et al., 2000; Lee & Fishwick, 1995; Longtin & Megherbi,
1995; Lee, 1996; Mohn, 1994; Petty, 1995). CGF or SAF (SAFOR) is a technique, which
provides a simulated opponent using a computer system that generates and controls
multiple simulation entities using software and possibly a human operator. In the case of
Distributed Interactive Simulation (DIS) systems, the system is intended to provide a
simulated battlefield which is used for training military personnel. The advantages of CGF
are well-known (Petty, 1995): they lower the cost of a DIS system by reducing the number of
standard simulators that must be purchased and maintained; CGF can be programmed, in
theory, to behave according to the tactical doctrine of any desired opposing force, and so
eliminate the need to train and retrain human operators to behave like the current enemy;
CGF can be easier to control by a single person than an opposing force made up of many
human operators and it may give the training instructor greater control over the training
experience. One of the elements of the CGF systems is module for movement planning and
simulation of military objects. In many of existing simulation systems there are different
solutions regarding to this subject. In the JTLS system (JTLS, 1988) terrain is represented
using hexagons with sizes ranging from 1km to 16km. In the CBS system (Corps Battle
Simulation, 2001) terrain is similarly represented, but vectoral-region approach is
additionally applied. In both of these systems there are manual and automatic methods for
route planning (e.g. in the CBS controller sets intermediate points (coordinates) for route). In
the ModSAF (Modular Semi-Automated Forces) system in module “SAFsim”, which simulates
the entities, units, and environmental processes the route planning component is located
(Longtin & Megherbi, 1995). In the paper (Mohn, 1994) implementation of a Tactical Mission
Planner for command and control of Computer Generated Forces in ModSAF is presented. In
the work (Benton et al., 1995) authors describe a combined on-road/off-road planning
system that was closely integrated with a geographic information system and a simulation
system. Routes can be planned for either single columns or multiple columns. For multiple
columns, the planner keeps track of the temporal location of each column and insures they
will not occupy the same space at the same time. In the same paper the Hierarchic Route

Automation and Robotics
298
Planner as integrate part of Predictive Intelligence Military Tactical Analysis System (PIMTAS) is
discussed. In the paper (James et al., 1999) authors presented on-going efforts to develop a
prototype for ground operations planning, the Route Planning Uncertainty Manager (RPLUM)
tool kit. They are applying uncertainty management to terrain analysis and route planning
since this activity supports the Commander’s scheme of manoeuvre from the highest
command level down to the level of each combat vehicle in every subordinate command.
They extend the PIMTAS route planning software to accommodate results of reasoning
about multiple categories of uncertainty. Authors of the paper (Campbell et al., 1995)
presented route planning in the Close Combat Tactical Trainer (CCTT). Authors (Kreitzberg et
al., 1990) have developed the Tactical Movement Analyzer (TMA). The system uses a
combination of digitized maps, satellite images, vehicle type and weather data to compute
the traversal time across a grid cell. TMA can compute optimum paths that combine both
on-road and off-road mobility, and with weather conditions used to modify the grid cost
factors. The smallest grid size used is approximately 0.5 km. The author uses the concept of
a signal propagating from the starting point and uses the traversal time at each cell in the
array to determine the time at which the signal arrives to neighbouring cells. In the paper
(Tarapata, 2004a) models and methods of movement planning and simulation in some
simulation aided system for operational training on the corps-brigade level (Najgebauer,
2004) is described. A combined on-road/off-road planning system that is closely integrated
with a geographic information system and a simulation system is considered. A dual model
of the terrain ((1) as a regular network of terrain squares with square size 200mx200m, (2) as
a road-railroad network), which is based at the digital map, is presented. Regardless of
types of military actions military objects are moved according to some group (arrangement
of units). For example, each object being moved in group (e.g. during attack, during
redeployment) must keep distances between each other of the group (Tarapata, 2001).
Therefore, it is important to recognize (during movement simulation) that objects inside
units do not “keep” required distances (group pattern) and determine a new movement
schedule. All of the systems presented above have no automatic procedures for
synchronization movement of more than one unit. The common solution of this problem is
when movement (and simulation, naturally) is stopped and commanders (trainees) make a
new decision or the system does not react to such a situation. Therefore, in the paper
(Tarapata, 2005) a proposition of a solution to the problem of synchronization movement of
many units is shown. Some models of synchronous movement and the idea of module for
movement synchronization are presented. In the papers (Antkiewicz et al., 2007; Tarapata,
2007c) the idea and model of command and control process applied for the decision
automata on the battalion level for three types of unit tasks: attack, defence and march are
presented.
The chapter is organized as follows. Presented in section 2 is the review of methods of
environment modelling for simulated battlefield. An example of terrain model being used in
the real simulator is described. Moreover, paths planning algorithms, which are being
applied in terrain-based simulation, are considered. Sections 3 and 4 contain description of
automatization methods of main battlefield processes (attack, defence and march) in
simulation system like CGF. In these sections, a decision automata, which is a component of
the simulation system for military training is described as an example. Presented in section 5
are some conclusions concerning problems and proposition of their solution in
automatization of decision processes in conflict situations.

Automatization of Decision Processes in Conflict Situations: Modelling, Simulation and Optimization
299
2. Environment modelling for simulation of conflict situations
2.1 An overview
The terrain database-based model is being used as an integrated part of route CGF systems.
Terrain data can be as simple as an array of elevations (which provides only a limited means
to estimate mobility) or as complex as an elevation array combined with digital map
overlays of slope, soil, vegetation, drainage, obstacles, transportation (roads, etc.) and the
quantity of recent weather. For example, in (Benton et al., 1995) authors describe HERMES
(Heterogeneous Reasoning and Mediator Environment System) will allow the answering of
queries that require the interrogation of multiple databases in order to determine the start
and destination parameters for the route planner.
There are a few approaches in which the map (representing a terrain area) is decomposed
into a graph. All of them first convert the map into regions of go (open) and no-go (closed).
The no-go areas may include obstacles and are represented as polygons. A few methods of
map representation is used, for example: visibility diagram, Voronoi diagram, straight-line
dual of the Voronoi diagram, edge-dual graph, line-thinned skeleton, regular grid of
squares, grid of homogeneous squares coded in a quadtree system, etc. (Benton et al., 1995;
Schiavone et al., 1995a; Schiavone et al., 1995b; Tarapata, 2003).
The polygonal representations of the terrain are often created in database generated systems
(DBGS) through a combination of automated and manual processes (Schiavone et al., 1995;
Schiavone et al., 2000). It is important to say that these processes are computationally
complicated, but are conducted before simulation (during preparation process). Typically,
an initial polygonal representation is created from the digital terrain elevation data through
the use of an automated triangulation algorithm, resulting in what is commonly referred to
as a Triangulated Irregular Network (TIN). A commonly used triangulation algorithm is the
Delaunay triangulation. Definition of the Delaunay triangulation may be done via its direct
relation to the Voronoi diagram of set S with an N number of 2D points: the straight-line
dual of the Voronoi diagram is a triangulation of S.
The Voronoi diagram is the solution to the following problem: given set S with an N number
of points in the plane, for each point p
i
in S what is the locus of points (x,y) in the plane that
are closer to p
i
than to any other point of S?
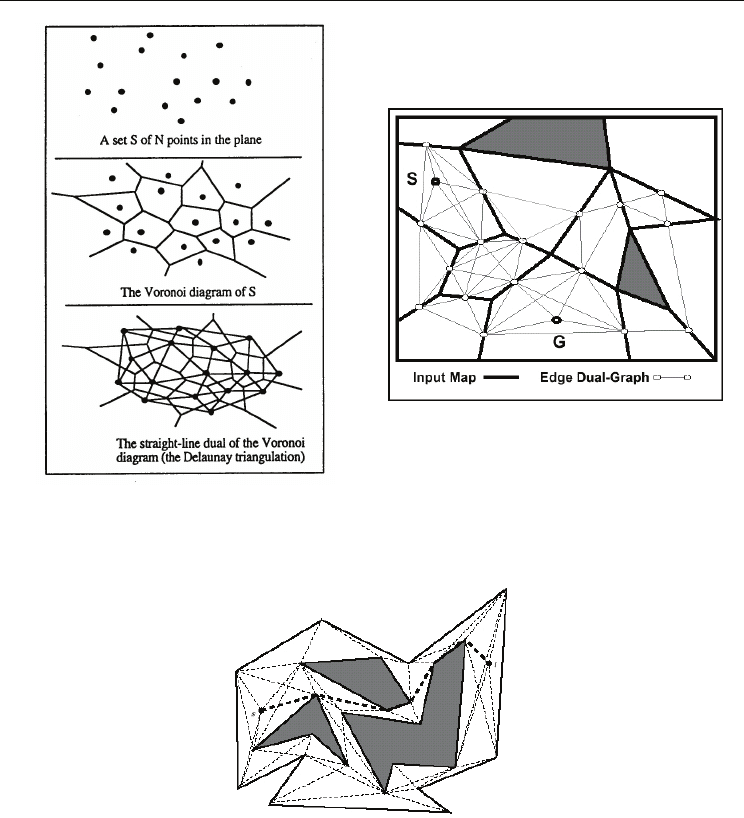
The straight-line dual is defined as the graph embedded in the plane obtained by adding a
straight-line segment between each pair of points of S whose Voronoi polygons share an
edge. Fig.1a depicts an irregularly spaced set of points S, its Voronoi diagram, and its
straight-line dual (i.e. its Delaunay triangulation).
The edge-dual graph is essentially an adjacency list representing the spatial structure of the
map. To create this graph, we assign a node to the midpoint of each map edge, which does
not bound an obstacle (or the border). Special nodes are assigned to the start and goal
points. In each non-obstacle region, we add arcs to connect all nodes at the midpoints of the
edges, which bound the same region. The fact that all regions are convex, guarantees that all
such arcs cannot intersect obstacles or other regions. An example of the edge-dual graph is
presented in Fig.1b.
The visibility graph, is a graph, whose nodes are the vertices of terrain polygons and edges
join pairs of nodes, for which the corresponding segment lies inside a polygon. An example
is shown in Fig.2.
Automation and Robotics
300
(a) (b)
Fig.1. (a) Voronoi diagram and its Delaunay triangulation
(Schiavone et al., 1995); (b) Edge-
dual graph. Obstacles are represented by filled polygons
Fig.2. Visibility graph (Mitchell, 1999). The shortest geometric path is marked from source
node s to destination t. Obstacles are represented by filled polygons
The regular grid of squares (or hexagons, e.g. in JTLS system (JTLS, 1988)) divides terrain
space into the squares with the same size and each square is treated as having homogeneity
from the point of view of terrain characteristics (Fig.3).
The grid of homogeneous squares coded in quadtree system divides terrain space into the squares
with heterogeneous size (Fig.4). The size of square results from its homogeneity according to
terrain characteristics. An example of this approach was presented in (Tarapata, 2000).
Advantages and disadvantages of terrain representations and their usage for terrain-based
movement planning are presented in section 2.3.
Automatization of Decision Processes in Conflict Situations: Modelling, Simulation and Optimization
301
(a) (b)
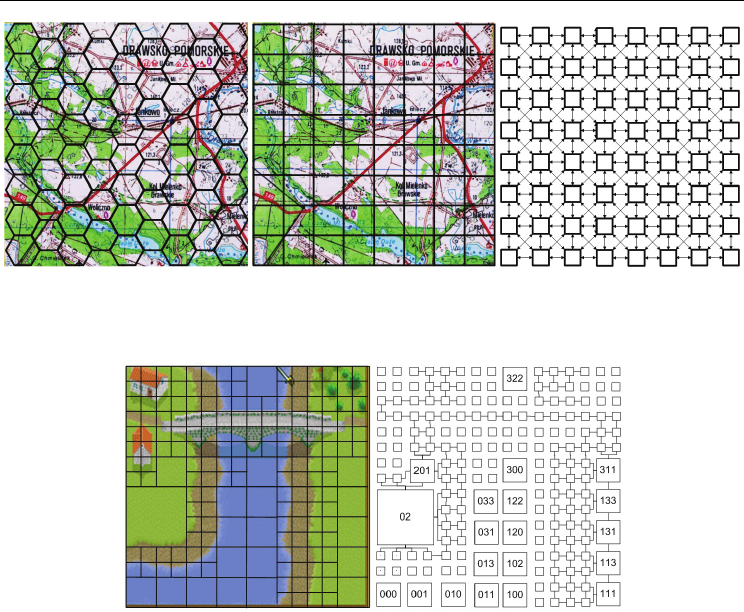
Fig.3. Examples of terrain representation in a simulated battlefield: (a) regular grid of terrain
hexagons; (b) regular grid of terrain squares and its graph representation.
(a) (b)
Fig.4. (a) Partitioning of the selected real terrain area into squares of topographical
homogeneous areas; (b) Determination of possible links between neighbouring squares and
a description of selected vertices in the quadtree system for terrain area presented in (a)
In many existing simulation systems there are different solutions regarding terrain
representation. In the JTLS system (JTLS, 1988) terrain is represented using hexagons with a
size ranging from 1km to 16km. In the CBS system (Corps Battle Simulation, 2001) terrain is
similarly represented, but an additional vectoral-region approach is applied. In the
simulation-based operational training support system “Zlocien” (Najgebauer, 2004) a dual
model of the terrain: (1) as regular network of terrain squares with square size 200mx200m,
(2) as road-railroad network, which is based on a digital map, is used.
Taking into account multiresolution terrain modelling (Behnke, 2003; Cassandras et al., 2000;
Davis et al., 2000; Pai & Reissell, 1994; Tarapata, 2001) the approach is also used for
battlefield modelling and simulation. For example, in the paper (Tarapata, 2004b)
a decomposition method, and its properties, which decreases computational time for path
searching in multiresolution graphs has been presented. The goal of the method is not only
computation time reduction but, first of all, using it for multiresolution path planning (to
apply similarity in decision processes on different command level and decomposing-
merging approach). The method differs from very effective representations of terrain using

Automation and Robotics
302
quadtree (Kambhampati & Davis, 1986) because of two main reasons: (1) elements of
quadtree which represent a terrain have irregular sizes, (2) in majority applications quadtree
represents only binary terrain with two types of region: open (passable) and closed
(impassable). Hence, this approach is very effective for mobile robots, but it is not adequate,
for example, to represent battlefield environment (Tarapata, 2003).
2.2 Terrain model for a battlefield simulation – an example
The terrain (environment) model S
0,
which we use as a battlefield model for further
discussions (sections: 3.4 and 4) is based on the digital map in VPF format. The model is
twofold: (1) as a regular network Z
1
of terrain squares, (2) as a road-railroad network Z
2
and
it is defined as follows (Tarapata, 2004a):
)(),()(
21
tZtZtS
O
=
(1)
Regular grid of squares Z
1
(see Fig.3)
divides terrain space into squares with the same size
(200m×200m) and each square is homogeneous from the point of view of terrain
characteristics (degree of slowing down velocity, ability to camouflage, degree of visibility,
etc.). This square size results from the fact that the nearest level of modelled units in SBOTSS
“Zlocien” (Najgebauer, 2004) is a platoon and 200m is approximately the width of the
platoon front during attack. The Z
1
model is used to plan off-road (cross-country) movement
e.g. during attack planning. In the Z
2
road-railroad network (see Fig.5) we have crossroads
as network nodes and section of the roads linking adjacent crossroads as network links
(arcs, edges). This model is used to plan fast on-road movement, e.g. during march
(redeployment) planning and simulation.
These two models of terrain are integrated. This integration gives possibilities to plan
movement inside both models. It is possible, because each square of terrain contains
information about fragments of road inside this square. On the other hand each fragment of
road contains information on squares of terrain, which they cross. Hence, route for any
object (unit) may consist of sections of roads and squares of terrain. It is possible to get off
the road (if it is impassable) and start movement off-road (e.g. omit impassable section of
road) and next returning to the road. Conversely, we can move off-roads (e.g. during
attack), access a section of road (e.g. any bridge to go across the river) and then return back
off-road (on the other riverside). The characteristics of both terrain models depend on: time,
terrain surface and vegetation, weather, the day and time of year, opponent and own
destructions (e.g. destruction of the bridge which is element of road-railroad network) (see
Table 1 and Table 2).
The formal definition of the regular network of terrain squares Z
1
is as follows (see Fig.3):
111
() , ()
Z
tG t=Ψ
(2)
where G
1
defines Berge's graph defining structure of squares network,
111
, Γ= WG
,
1
W
- set
of graph’s nodes (terrain squares);
1
2:
11
W
W →Γ
- function describing for each nodes of G set
of adjacent nodes (maximal 8 adjacent nodes);
1
1 1,0 1,1 1, 2 1,
( ) { ( , ), ( , ), ( , ),..., ( , )}
LW
tttt t
Ψ
=Ψ⋅Ψ⋅Ψ⋅ Ψ ⋅
-
set of functions defined on the graph’s nodes (depending on t).
One of the functions of
)(
1
t
Ψ
is the function of slowing down velocity FSDV(n,…),
1
Wn ∈
which describes slowing down velocity (as a real number from [0,1]) inside the n-th square
of the terrain,