Holden P.R., Wilde N. Marketing and PR on a Shoestring
Подождите немного. Документ загружается.


Page 22 green
Page 22 green
Page 22 Black
Page 22 Black
want out of your business. (If you have business partners,
ask them to do the same.)
6. Now go back and rethink the answers to questions 1 to 4.
These may have to change to meet the aims and
objectives of you (and your co-owners).
Opening soon! The Bland Sandwich Shop
If you put up this notice, you’re going to turn your customers
away. The truth is we could take you to many shops that
should have this sign up! Let’s face it, many of those that
make the sandwiches on the premises have mountains of
‘catering-pack’ ham, cheddar cheese and tuna mayonnaise.
Hardly any of them are ever going to win prizes. Is this really
what people want from a sandwich?
To refresh your understanding of customers, it is useful to
consider that frequent sandwich buyers don’t buy the same
thing every day: they want a bit of variety. It isn’t just about
price or a straightforward value calculation (i.e. bigger =
better). So why aren’t there more exciting choices? Why not
make buying a sandwich more of an event?
Try some new recipes and let your customers sample them.
Make sure that even the cheese in your cheese and pickle
sandwich is one of the best that you can find. . .then ring
the changes, still using top-quality ingredients, every week.
MARKETING AND PR
22

Page 23 green
Page 23 green
Page 23 Black
Page 23 Black
Notes/References
1 Ring, L.J. et al. (2002). ‘The Strategic Resource Management (SRM)
model revisited’, International Journal of Retail and Distribution
Management. Volume 30, Number 11, pages 544–561.
2 Attributed to Peter Drucker back in the 1960s.
3 Cressy, R. (2006) ‘Why Do Most Firms Die Young?’, Small Business
Economics, Volume 26, 103–116.
4 ‘Latest BDO Stoy Hayward Industry Watch report supports Chan-
cellor’s view of stable economy.’ BDO Stoy Hayward press release,
31
st
March 2006.
5 Mazzarol, T. et al. (1998). Creativity drives the dream: an empirical
analysis of the factors motivating business start-ups, ICSB World
Conference, Singapore.
23
WHAT’S SO DIFFERENT ABOUT SMALL BUSINESS?

Page 24 green
Page 24 green
Page 24 Black
Page 24 Black
2FIRST STEPS IN
THE PLANNING
PROCESS
Having considered why you are in business, and indeed
what kind of business you want to be in, in this chapter we’ll
look at how you can start developing an outline of a dis-
tinctive plan for your business. Starting with your broader
‘corporate’ objectives, you’ll then consider the best ways of
achieving them. We’ll also look at how you can choose a
realistic strategic direction based on the basic alternatives
we propose and by setting your business within a model
devised especially for small businesses. Focusing on your
marketplace by visualising the marketplace in terms of cus-
tomer numbers and their buying patterns, will mean that
you’ll be able to consider more innovative strategic options.
Finally, we’ll also look a how to start writing a marketing
plan.
Can you explain what the opportunities are for
your business?
Most successful business ventures are a result of entrepreneurs spot-
ting an opportunity in a marketplace they know well. You need,
therefore, to be able to show what these opportunities are and to try
and put figures to them. If, for example, you have designed a new
24

Page 25 green
Page 25 green
Page 25 Black
Page 25 Black
recycling bin which can be sold to local authorities and private
individuals, get some feedback about the need for your new product.
You could ask householders about their current recycling habits and
their views on what would encourage them to recycle more. The fact
that 40% of all households are ‘interested in composting’ is a start;
ballpark figures are okay at this stage. Not having any figures at all
is very worrying.
What is the trading environment?
Part of the marketing planning process is to understand how your
business is affected by the current trends in the market and where
your competitors are. Markets can really only do the following:
1. fall
2. stagnate
3. rise
For each of these, there are two further measures to consider:
1. value (the amount of money the goods are sold for)
2. volume (the total number of units sold)
These are simply measures that indicate the current business cli-
mate. If the number of suppliers remains the same, a falling market
will become more competitive. If there are also new entrants to that
market, competition will ratchet up even further. Prices will probably
be falling too.
Business objectives
It’s now time to start writing out some objectives for your business.
You already have a feel for what is acceptable to you – what kind of
FIRST STEPS IN THE PLANNING PROCESS
25

Page 26 green
Page 26 green
Page 26 Black
Page 26 Black
business you want and where you would like it to go. Add to this
some basic information about the economy and the market, and you
can estimate some figures.
I’d like to grow this company’s turnover from £60,000 to
£100,000, but I know the market for building and home
improvements is only growing at 2% per annum.
What then will be the key business objectives for your organisation,
based on an assessment of the market, which is either stagnant,
rising or falling? Also, does this business objective meet your per-
sonal objectives? What effect does it have on the amount you need
(want?) to pay yourself, for example?
Chapter 3 will offer more guidance on these points, but there’s
also a lot of free information that you can tap in to. To illustrate this,
the accounting firm Grant Thornton (www.grant-thornton.co.uk)
produces regular reports on various business sectors. Its January
2006 summary of the retail trade over the previous Christmas
1
showed that average results were up 1.1% on the same period a
year before. However, while some sub-sectors had enjoyed greater
growth (‘electricals’, for instance, were up over 3%), others had
declined. ‘Household and homeware’ sales had declined by over 7%.
Simple, accessible summaries like this give you real food for
thought. Can you achieve the average result (and, in effect, stay
still), or can you beat it? If your sector is declining by 7%, should you
really budget on the basis of even modest growth?
It would be nigh-on impossible for your figures to be completely
exact, no matter how big your company, and even if you have very
good historical data from which to forecast. But at this stage any
figures help reduce uncertainty and will enable you to monitor your
progress.
MARKETING AND PR
26
Page 27 green
Page 27 green
Page 27 Black
Page 27 Black
A model for your business
Once you have an idea of the trading environment, you need to get a
feel for how you can develop a marketing plan tailored to your
business, based on customers and their needs.
In our experience, the difficulties small businesses have in dis-
covering customers’ needs and organising the business around them
are heavily affected by the sheer number of customers (and poten-
tial customers) that have to be dealt with and the value of transac-
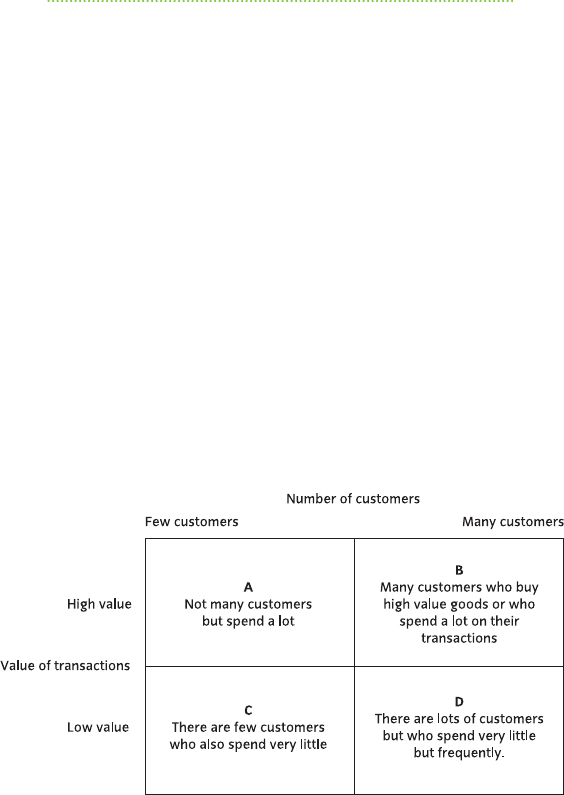
tions involved. Broadly speaking, we can map businesses on the two
axes shown below, which we’re proud to unveil as the Holden-Wilde
(HW) matrix.
The idea is simply to start thinking about where your customers
are, how many there are and whether each transaction they under-
take with you is of a high or low value to them. As a start-up
business, how many customers do you think are out there? How
much do they spend?
FIRST STEPS IN THE PLANNING PROCESS
27

Page 28 green
Page 28 green
Page 28 Black
Page 28 Black
Most businesses think that they are at position D, where there
are plenty of customers, but they just don’t seem to buy often.
Sometimes businesses think of themselves at A, but underestimate
their competition. However, you could well be in position B or C but
you are ‘sharing’ the customers with many businesses similar to your
own. This does not represent an opportunity. From position C do you
then move across the grid and attempt to get more customers or
move up the grid and find more valuable customers?
Now before you all start composing e-mails of complaint that
this is wholly unrealistic for all kinds of reasons, we know this model
is very subjective. You have to use your judgement to gauge where
you are and what your customers’ perceptions are. We know — hon-
estly. But we think it’s worth persevering to make you investigate the
reality of your market rather than rely on sweeping, and largely
unfounded, marketing folklore.
We’ve come across numerous business people who sincerely
believe they offer ‘the best’ product. It’s actually quite endearing and
you might expect that every entrepreneur believes in his or her own
product. However, an attempt to take a more analytical, objective
view of your business usually pays dividends.
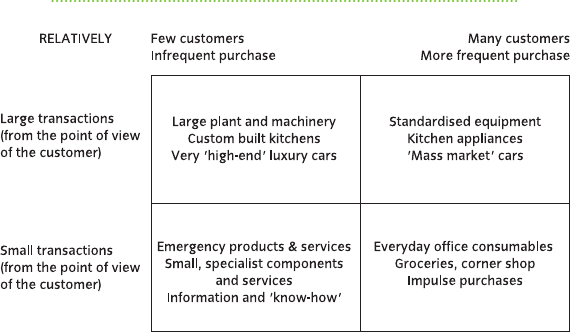
While we are aware of the danger of making sweeping general-
isations about business, here are some examples of the kinds of
businesses/products/markets that might fall into one of the quad-
rants of the Holden-Wilde matrix.
But bear in mind that all of this is relative: a frequent purchaser
of luxury cars may view the purchase of a small ‘run-about’ for the
nanny as a minor and infrequent purchase unworthy of much deci-
sion time! Let’s just say that it is precisely in these kinds of ‘excep-
tions’ that small businesses discover so-called ‘niche’ opportunities.
To continue this example, a company selling expensive cars to
the very wealthy could make considerable profit sourcing other less
MARKETING AND PR
28
Page 29 green
Page 29 green
Page 29 Black
Page 29 Black
expensive cars (perhaps with a partner company) to meet such
needs. The likelihood is that the purchaser of these smaller cars
would be less sensitive to the price than those for whom it represents
a ‘big deal’. This is an example of ‘share of pocket’ (or wallet) rather
than ‘share of market’, since by conventional analysis the company
has moved into a different market sector.
This is a useful measure to bear in mind and it may form part of
your marketing objectives. As a very small company you won’t be
aiming for a significant percentage share of a market, but you can
get near to a 100% share of certain customers — and that’s enough
to make a very comfortable living. Think about how you could
position your business in the grid to reach those people.
But what does it all mean?
The HW matrix (see how familiar it’s becoming?) is based partly on
the kinds of purchase decisions customers are making. As a result, it
leads directly to a consideration of the ways in which you can sup-
port that decision making and the opportunities you have to do so —
FIRST STEPS IN THE PLANNING PROCESS
29
Page 30 green
Page 30 green
Page 30 Black
Page 30 Black
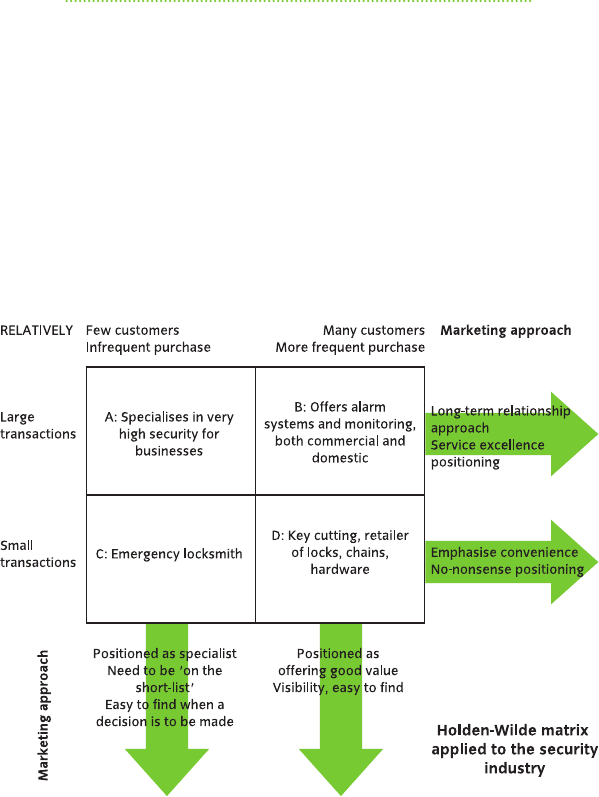
in other words, your marketing strategy. Furthermore, because we
are also considering the value of the transaction, there is also a
suggestion of the kind of marketing investment needed by different
customers. To illustrate this, we’ve taken just one business area and
positioned four different businesses (A, B, C and D) in the grid.
As you can see, the categories don’t quite fit perfectly. For
example, you could argue that firm B should appear further to the
left since people don’t buy burglar alarms very frequently. However
it’s undoubtedly a mass market with DIY alternatives available at
very low cost so there are, potentially, many customers out there.
MARKETING AND PR
30

Page 31 green
Page 31 green
Page 31 Black
Page 31 Black
The point is that, in order to make a decision about where you
are on the grid, you need some information and that information is
relative to other companies, or other groups of customers or your
customers’ other needs or purchases.
If you were in the security market, you’d have to make decisions
about which direction you intended to go in. Are you getting the
basics right? Do you chase more customers making more frequent
purchases, or do you try and move ‘up market’ and go for higher
value, possibly less frequent purchases?
If you wanted to think creatively about your industry and what
you could do that was different from the competition, you need only
play around with your position on the grid. For example, what could
you do as an emergency locksmith that dealt only with the highest
value customers? Is there perhaps an opportunity for a highly
tailored security service available ‘over the counter’, say through a
large retailer?
On the next page is a blank matrix for you to copy and fill in.
Bear in mind as you try to fill out the HM matrix that there is
no one right way to do it. All businesses are different and the
purpose of the matrix is to help you realise and emphasise those
differences.
Some versions of your matrix will seem very narrowly focused (on
your customers, say), while others will seem to identify many
competitors. Don’t worry: you are developing your insight into your
business and your customers and identifying a ‘market space’ you
can exploit.
The marketing plan
Now we’re nearing the moment. Yes, it’s that time when we are
going to ask you to write a marketing plan.
Start your plan with a statement about your business; a
FIRST STEPS IN THE PLANNING PROCESS
31