Grillo O., Venora G. (eds.) Biodiversity Loss in a Changing Planet
Подождите немного. Документ загружается.


Modern Methods of Estimating Biodiversity from Presence-Absence Surveys 5
Site k
Observed Partially observed
species i 12··· R 12··· R w
i
1 y
11
y
12
··· y
1R
z
11
z
12
··· z
1R
w
1
2 y
21
y
22
··· y
2R
z
21
z
22
··· z
2R
w
2
.
.
.
.
.
.
.
.
.
.
.
.
.
.
.
.
.
.
.
.
.
.
.
.
n
y
n1
y
n2
··· y
nR
z
n1
z
n2
··· z
nR
w
n
n + 1 00··· 0 z
n+1,1
z
n+1,2
··· z
n+1,R
w
n+1
.
.
.
.
.
.
.
.
.
.
.
.
.
.
.
.
.
.
.
.
.
.
.
.
N
00··· 0 z
N1
z
N2
··· z
NR
w
N
N + 1 00··· 0 z
N+1,1
z
N+1,2
··· z
N+1,R
w
N+1
.
.
.
.
.
.
.
.
.
.
.
.
.
.
.
.
.
.
.
.
.
.
.
.
M
00··· 0 z
M1
z
M2
··· z
MR
w
M
Table 1. Conceptualization of the supercommunity of M species used in parameter-expanded
data augmentation. Y comprises a matrix of n rows of observed trap frequencies and M
− n
rows of unobserved (all-zero) trap frequencies. Z denotes a matrix of species- and
site-specific occurrence parameters. w denotes a vector of parameters that indicate
membership in the community of N species vulnerable to sampling.
distributed (iid) as follows:
w
i
iid
∼ Bernoulli(Ω)
where the parameter Ω denotes the probability that a species in the augmented data set is a
member of the community of N species that are present and vulnerable to capture. Note that
the community’s species richness N is not a formal parameter of the model. Instead, N is a
derived parameter to be computed as a function of w as follows: N
=
∑
M
i
=1
w
i
. Therefore,
estimation of Ω and w is essentially equivalent to estimation of N (Royle & Dorazio 2011).
The incidence matrix of the community (Colwell et al. 2004, Gotelli 2000) is a parameter of the
model that is embedded in an M
× R matrix of parameters Z, whose elements indicate the
presence (z
= 1) or absence (z = 0) of species i at sample site k. Although Z is treated as a
random variable of the model, each element associated with species that are not members of
the community is equal to zero because z
ik
is defined conditional on the value of w
i
as follows:
z
ik
|w
i
∼ Bernoulli(w
i
ψ
ik
) (1)
where ψ
ik
denotes the probability that species i is present at sample site k. Thus, if species i is
not a member of the community, then w
i
= 0 and Pr(z
ik
= 0|w
i
= 0)=1; otherwise, w
i
= 1
and Pr
(z
ik
= 1|w
i
= 1)=ψ
ik
. For purposes of computing estimates of community-level
characteristics, Z may be treated as the incidence matrix itself because the M
− N rows
associated with species not in the community contain only zeros and make no contribution
to the estimates.
281
Modern Methods of Estimating Biodiversity from Presence-Absence Surveys

6 Will-be-set-by-IN-TECH
The matrix of augmented data Y and the parameters Z and w may be conceptualized as
characteristics of a supercommunity of M species (Table 1). This supercommunity includes N
species that are members of the community vulnerable to sampling and M
− N other species
that are added to simplify the analysis. The parameters Z and w are paramount in terms of
estimating measures of biodiversity. We have shown already that estimates of w are used to
compute estimates of species richness N (a measure of gamma diversity). Similarly, Z may
be used to estimate measures of alpha diversity, beta diversity, and other community-level
characteristics. For example, summing the columns of Z yields the number of species present
at each sample site (alpha diversity). Similarly, different columns of Z may be compared
to express differences in species composition among sites (beta diversity). For example, the
Jaccard index, a commonly used measure of beta diversity (Anderson et al. 2011), is easily
computed from Z. The Jaccard index requires the number of species from two distinct sites,
say k and l, that occur at both sites. Off-diagonal elements of the R
× R matrix Z
Z contain
the numbers of species shared between different sites. Therefore, the proportion of all species
present at two sites, say k and l, that are common to both sites is
J
kl
=
z
k
z
l
z
k
1 + z
l
1 − z
k
z
l
where 1 denotes a M × 1 vector of ones, and z
k
and z
l
denote the kth and lth columns of Z.
Note that J
kl
is a measure of the similarity in species present at sites k and l; its complement,
1
− J
kl
, corresponds to the dissimilarity – or beta diversity – between sites.
In Section 4 we provide estimates of gamma diversity, alpha diversity, and beta diversity in
our analyses of the ant data sets. In these analyses we assume that the community of ants
contains a maximum of M
= 75 species in the forest habitat and a maximum of M = 25
species in the bog habitat. The lower maximum is based on five years of collecting ants in New
England bogs that yielded only 21 distinct species (Ellison and Gotelli, personal observations).
The total number of ant species in all of New England is somewhere between 130 and 140
(Ellison et al. 2012); however, many of these species are field or grassland species, and six
species, which are not indigenous to New England, are restricted mainly to warm indoors.
By excluding these species and those found only in bogs, we obtain the upper limit for the
number of ant species in the forest habitat.
3.1.1 Modeling species occurrence probabilities
Equation 1 implies that each element of the incidence matrix is assumed to be independent
given ψ
ik
, the probability of occurrence of species i at sample site k. Let x
k
=(x
1k
, x
2k
,...,x
pk
)
denote the observed value of p covariates at site k. We assume that each of these covariates
potentially affects the species-specific probability of occurrence at site k. Naturally, the effects
of these covariates may differ among species, so their contributions are modeled on the
logit-scale as follows:
logit
(ψ
ik
)=b
0i
+ δ
1
b
1i
x
1k
+ ···+ δ
p
b
pi
x
pk
(2)
where b
0i
denotes a logit-scale, intercept parameter for species i and b
li
denotes the effect
of covariate x
l
on the probability of occurrence of species i (l = 1, . . . , p). If each covariate is
centered and scaled to have zero mean and unit variance, b
0i
denotes the logit-scale probability
282
Biodiversity Loss in a Changing Planet
Modern Methods of Estimating Biodiversity from Presence-Absence Surveys 7
of occurrence of species i at the average value of the covariates. This scaling of covariates also
improves the stability of calculations involved in estimating b
i
=(b
0i
, b
1i
,...,b
p
i
).
The additional parameter δ
=(δ
1
,...,δ
p
) in Eq. 2 is used to specify whether each covariate is
(δ
= 1) or is not (δ = 0) included in the model. Specifically, we assume
δ
l
iid
∼ Bernoulli(0.5)
which implies an equal prior probability (0.5
p
) for each of the 2
p
distinct values of δ. This
approach, originally developed by Kuo & Mallick (1998), allows several regression models
to be considered simultaneously and yields the posterior distribution of δ. After all models
have been considered (as described in Section 3.2), the posterior probability Pr
(δ|Y , X) of
each model (vis a vis, each distinct value of δ) can be computed. In our analyses the model
with the highest posterior probability is used to compute estimates of species occurrence and
biodiversity.
3.1.2 Modeling species captures
We assume a relatively simple model of the pitfall trap frequencies y
ik
, owing to the simplicity
of our sampling design. Specifically, we assume that if ants of species i are present at site k
(i.e., z
ik
= 1), their probability of capture p
ik
is the same in each of the J
k
replicated traps. This
assumption implies the following binomial model of the pitfall trap frequencies:
y
ik
|z
ik
∼ Binomial(J
k
, z
ik
p
ik
)
where p
ik
denotes the conditional probability of capture of species i at site k (given z
ik
= 1).
Note that if species i is absent at site k, then Pr
(y
ik
= 0|z
ik
= 0)=1. In other words, if
a species is absent at sample site k, then none of the J
k
pitfall traps will contain ants of that
species under our modeling assumptions.
None of the covariates observed in our samples is thought to be informative of ant capture
probabilities; therefore, rather than using a logistic-regression formulation of p
ik
(as in Eq. 2),
we assume that the logit-scale probability of capture of each species is constant:
logit
(p
ik
)=a
0i
at each of the R sample sites.
3.1.3 Modeling heterogeneity among species
In order to estimate the occurrences of species not observed in any of our traps, a modeling
assumption is needed to specify a relationship among all species-specific probabilities of
occurrence and detection. Therefore, we assume that the ant species in each community
are ecologically similar in the sense that these species are likely to respond similarly, but
not identically, to changes in their environment or habitat, to changes in resources, or to
changes in predation. The assumption of ecological similarity seems reasonable for the
species we sampled owing to their overlapping diets, habitats, and life history characteristics.
As a point of emphasis, we would not assume ecological similarity if our assemblage had
included species of tigers and mice! The idea of ecological similarity has been used previously
to analyze assemblages of songbird, butterfly, and amphibian species (Dorazio et al. 2006,
283
Modern Methods of Estimating Biodiversity from Presence-Absence Surveys

8 Will-be-set-by-IN-TECH
Kéry, Royle, Plattner & Dorazio 2009, Walls et al. 2011); however, this idea is not universally
applicable. For example, if the occurrence of one species depends on the presence or absence
of another species (as might occur between a predator and prey species or between strongly
competing species), then ecological similarity would not be a reasonable assumption. In
this case a model must be formulated to specify the pattern of co-occurrence that arises
from interspecific interactions (MacKenzie et al. 2004, Waddle et al. 2010). The formulation
of statistical models for inferring interspecific interactions in communities of species is an
important and developing area of research (Dorazio et al. 2010).
In assemblages of ecologically similar species, it seems reasonable to use distributional
assumptions to model unobserved sources of heterogeneity in probabilities of species
occurrence and detection. For example, occurrence probabilities may be low for some species
(the rare ones) and high for others, but all species are related in the sense that they belong to
a larger community of ecologically similar species. By modeling the heterogeneity among
species in this way, the data observed for any individual species influence the parameter
estimates of every other species in the community. In other words, inferences about an
individual species do not depend solely on the observations of that species because the
inferences borrow strength from the observations of other species. A practical manifestation
of this multispecies approach is that the estimate of a parameter (e.g., occurrence probability)
of a single species reflects a compromise between the estimate that would be obtained by
analyzing the data from each species separately and the average value of that parameter
among all species in the community. In the statistical literature this phenomenon is called
“shrinkage” (Gelman et al. 2004) because each species-specific estimate is shrunk in the
direction of the estimated average parameter value. Of course, the amount of shrinkage
depends on the relative amount of information about the parameter in the observations of
each species versus the information about the mean value of that parameter. An important
benefit of shrinkage is that it allows parameters to be estimated for a species that is detected
with such low frequency that its parameters could otherwise not be estimated. Such species
are often the rarest members of the community, and it is crucial that these species be included
in the analysis to ensure that estimates of biodiversity are accurate.
In the present analysis we use a normal distribution
b
0i
a
0i
iid
∼ Normal
β
0
α
0
,
σ
2
b
0
ρσ
b
0
σ
a
0
ρσ
b
0
σ
a
0
σ
2
a
0
, (3)
to specify the variation in occurrence and detection probabilities among ant species. The
parameters σ
b
0
and σ
a
0
denote the magnitude of this variation, and ρ parameterizes the extent
to which species occurrence and detection probabilities are correlated.
We also use the normal distribution to specify variation among the species-specific effects of
covariates on occurrence. Specifically, we assume b
li
iid
∼ Normal(β
l
, σ
2
b
l
) (for l = 1,...,p),
so that the effects of different covariates are assumed to be mutually independent and
uncorrelated.
3.2 Parameter estimation
The hierarchical model described in Section 3.1 would be impossible to fit using classical
methods owing to the high-dimensional and analytically intractable integrations involved
284
Biodiversity Loss in a Changing Planet

Modern Methods of Estimating Biodiversity from Presence-Absence Surveys 9
Posterior probability
Habitat Covariates Uniform prior Jeffreys’ prior
Forest LAT, LAI, GSF, ELEV 0.818 0.767
Forest LAT, LAI, ELEV 0.177 0.229
Forest LAT, ELEV 0.005 0.003
Forest LAT, GSF, ELEV
< 0.001 0.001
Bog ELEV 0.424 0.416
Bog None 0.342 0.412
Bog LAT 0.082 0.070
Bog AREA, ELEV 0.060 0.034
Bog LAT, ELEV 0.045 0.029
Bog AREA 0.038 0.036
Bog LAT, AREA 0.006 0.003
Bog LAT, AREA, ELEV 0.004 0.001
Table 2. Posterior probabilities of models containing different covariates of species
occurrence probabilities. Covariates include latitude (LAT), leaf area index (LAI), light
availability (GSF), elevation (ELEV), and bog area (AREA). Models with less than 0.001
posterior probability are not shown.
in evaluating the marginal likelihood function. We therefore adopted a Bayesian approach
to inference and used Markov chain Monte Carlo methods (Robert & Casella 2004) to fit
the model. In the appendix (Section 7) we describe our choice of prior distributions for
the model’s parameters. We also provide the data and the computer code that was used to
calculate the joint posterior distribution of the model’s parameters. All parameter estimates
and credible intervals are based on this distribution.
4. Results
4.1 Effects of covariates on species occurrence
The posterior model probabilities calculated in our analysis of forest and bog data sets are only
mildly sensitive to our choice of priors for the logit-scale parameters of the model (Table 2).
Recall that these parameters are of primary interest in assessing the relative contributions of
geographic- and site-level covariates. Regardless of the prior distribution used (Uniform or
Jeffreys’ (see appendix)), the model with highest probability includes all four covariates (LAT,
LAI, GSF, ELEV) in the analysis of data observed at forest sample sites and a single covariate
(ELEV) in the analysis of data observed at bog sample sites. However, the model without
any covariates has nearly equal probability to the favored model of the bog data, and the
combined probability of these two models far exceeds the probabilities of all other models.
These results suggest that occurrence probabilities of ant species found in the bog habitat are
not strongly influenced by the LAT or AREA covariates, either alone or in combination with
other covariates.
285
Modern Methods of Estimating Biodiversity from Presence-Absence Surveys
10 Will-be-set-by-IN-TECH
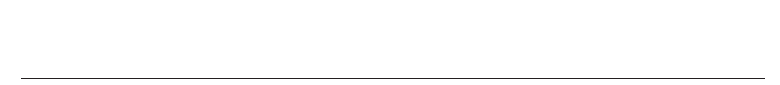
Each of the four covariates used to model species occurrences in the forest habitat has
an average, negative effect on occurrence probabilities. Estimates of β
l
and 95% credible
intervals are as follows: LAT, -0.717 (
−1.217, −0.257); LAI, -0.850 (−1.302, −0.440); GSF,
-0.494, (
−0.916, −0.098); ELEV, -0.662 (−1.014, −0.339). However, as illustrated in Figure 1,
there is considerable variation among species in the magnitude of these effects . Similarly,
the estimated occurrence probabilities of ants in the bog habitat decrease with ELEV (
ˆ
β
1
=
−
0.500 (−1.019, −0.098)), and there is considerable variation among species (
ˆ
σ
b
1
= 0.320
(0.014, 1.000)) in the magnitude of ELEV effects.
4.2 Estimates of biodiversity
Our pitfall trap surveys revealed n = 34 distinct species of ants at the forest sample sites and
n
= 19 species at the bog sample sites. The estimated species richness of ants found in the
forest habitat (
ˆ
N
= 43 (95% interval = (37, 70)) is nearly twice the estimated richness of ants in
the bog habitat (
ˆ
N
= 25 (95% interval = (21, 25)); however, the estimate of forest ant richness
is relatively imprecise and the estimate of bog ant richness is strongly influenced by the upper
bound (M
= 25 species).
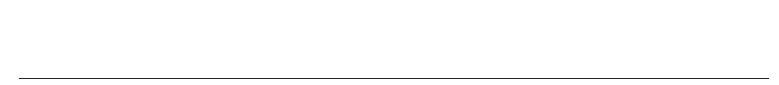
The numbers of species found in forest and bog communities are perhaps better compared
using estimates of species richness at the sample sites. These measures of alpha diversity
are plotted against each site’s elevation in Figure 2, which also includes the number of ant
species actually captured. The estimated richness at sites in the forest habitat usually exceeds
that at sites in the bog habitat when the effects of elevation on species occurrences are taken
into account. Note also that a site’s estimated species richness can be much higher than the
numbers of species captured because capture probabilities are much lower than one for most
species (Tables 3 and 4).
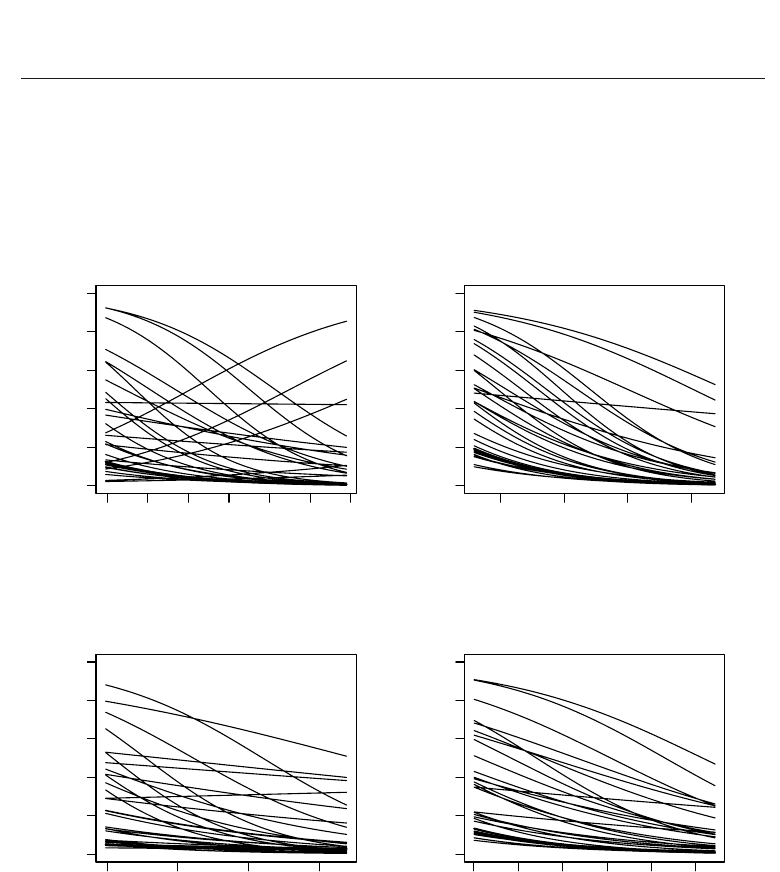
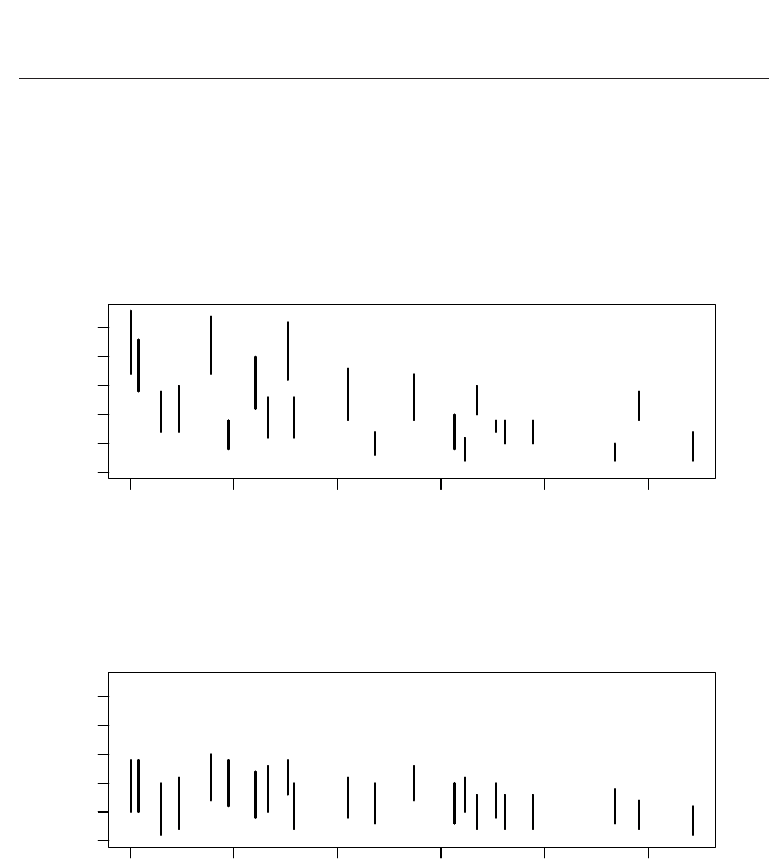
Site-specific estimates of beta diversity between bog and forest communities of ants are
relatively high, ranging from 0.71 to 1.0 (Figure 3). These estimates also generally exceed the
beta diversities between ants from different sites within each habitat (Figure 4), adding further
support for the hypothesis that composition of ant species differs greatly between forest and
bog habitats.
5. Discussion
5.1 Analysis of ant species
It is interesting to compare the results of our analyses with the results reported by Gotelli
& Ellison (2002), who analyzed the same data but did not account for errors in detection
of species. Gotelli & Ellison (2002) used linear regression models to estimate associations
between the number of observed species (which was referred to as “species density”) and
environmental covariates. For bog ants Gotelli & Ellison (2002) reported a significant
association between species density and latitude (P
= 0.041) and a marginally significant
association between species density and vegetation structure (as measured by the first
principal-component score; P
= 0.081). Collectively, these two variables accounted for about
30% of the variation in species density. In the present analysis of the bog data, the best fitting
model included the effect of a single covariate (ELEV) on ant species occurrence probabilities,
though a model without any covariates was a close second (Table 2). In the analysis of
forest ants Gotelli & Ellison (2002) reported significant positive associations between species
286
Biodiversity Loss in a Changing Planet
Modern Methods of Estimating Biodiversity from Presence-Absence Surveys 11
42.0 43.0 44.0 45.0
0.0
0.2
0.4
0.6
0.8
1.0
Latitude
P
ro
b
a
bilit
y o
f
occurrence
2345
0.0
0.2
0.4
0.6
0.8
1.0
Leaf area index
P
ro
b
a
bilit
y o
f
occurrence
0.05 0.10 0.15 0.20
0.0
0.2
0.4
0.6
0.8
1.0
Light availability
P
ro
b
a
bilit
y o
f
occurrence
0 100 300 500
0.0
0.2
0.4
0.6
0.8
1.0
Elevation
P
ro
b
a
bilit
y o
f
occurrence
Fig. 1. Estimated effects of covariates on occurrence probabilities of ant species in forest
habitat.
287
Modern Methods of Estimating Biodiversity from Presence-Absence Surveys
12 Will-be-set-by-IN-TECH
●
●
●
●
●
●
●
●
●
●
●
●
●
●
●
●●
●
●
●
●
●
0 100 200 300 400 500
0
5
10
15
20
25
Elevation (m)
Number o
f
species
●
●
●
●
●
●
●
●
●
●
●
●
●
●
●
●
●
●
●
●
●
●
●
●
●
●
●
●
●
●
●
●●
●
●
●
●
●
●
●
●
●
●
●
0 100 200 300 400 500
0
5
10
15
20
25
Elevation (m)
Number o
f
species
●
●
●
●
●
●
●●
●
●
●
●
●
●●
●
●
●
●
●
●
●
Fig. 2. Estimates of site-specific species richness (open circles with 95% credible intervals) for
ants in forest habitat (upper panel) and bog habitat (lower panel) versus elevation. Number
of species captured at each site (closed circles) is shown for comparison.
288
Biodiversity Loss in a Changing Planet

Modern Methods of Estimating Biodiversity from Presence-Absence Surveys 13
Capture probability Occurrence probability
Species Median 2.5% 97.5% Median 2.5% 97.5%
Amblyopone pallipes 0.028 0.008 0.073 0.043 0.005 0.237
Aphaenogaster rudis (species complex) 0.237 0.209 0.269 0.779 0.539 0.927
Campnnotus herculeanus 0.090 0.062 0.123 0.255 0.104 0.482
Campnnotus nearcticus 0.035 0.013 0.074 0.083 0.014 0.316
Campnnotus novaeboracensis 0.017 0.008 0.037 0.454 0.121 0.897
Campnnotus pennsylvanicus 0.131 0.107 0.158 0.587 0.322 0.819
Dolichoderus pustulatus 0.011 0.002 0.053 0.042 0.003 0.389
Formica argentea 0.011 0.001 0.053 0.044 0.003 0.411
Formica glacialis 0.012 0.002 0.055 0.045 0.003 0.413
Formica neogagates 0.096 0.049 0.163 0.038 0.005 0.166
Formica obscuriventris 0.010 0.001 0.051 0.046 0.003 0.448
Formica subaenescens 0.051 0.029 0.081 0.229 0.085 0.476
Formica subintegra 0.166 0.083 0.284 0.029 0.003 0.140
Formica subsericea 0.248 0.184 0.320 0.059 0.009 0.218
Lasius alienus 0.053 0.035 0.075 0.499 0.260 0.761
Lasius flavus 0.011 0.002 0.051 0.043 0.003 0.397
Lasius neoniger 0.036 0.013 0.076 0.097 0.020 0.333
Lasius speculiventris 0.012 0.003 0.040 0.080 0.009 0.502
Lasius umbratus 0.017 0.007 0.037 0.429 0.109 0.931
Myrmecina americana 0.011 0.002 0.052 0.042 0.003 0.398
Myrmica detritinodis 0.078 0.049 0.117 0.169 0.055 0.378
Myrmica lobifrons 0.056 0.036 0.082 0.299 0.118 0.568
Myrmica punctiventris 0.248 0.218 0.279 0.739 0.474 0.911
Myrmica species 1 (“AF-scu”) 0.102 0.078 0.131 0.368 0.152 0.642
Myrmica species 2 (“AF-smi”) 0.064 0.039 0.097 0.148 0.036 0.385
Prenolepis imparis 0.012 0.002 0.054 0.031 0.002 0.334
Stenamma brevicorne 0.017 0.005 0.046 0.103 0.014 0.526
Stenamma diecki 0.030 0.014 0.056 0.302 0.097 0.725
Stenamma impar 0.049 0.026 0.081 0.168 0.052 0.396
Stenamma schmitti 0.013 0.005 0.030 0.252 0.046 0.753
Tapinoma sessile 0.023 0.010 0.047 0.171 0.035 0.552
Temnothorax ambiguus 0.056 0.015 0.138 0.031 0.003 0.150
Temnothorax curvispinosus 0.057 0.022 0.113 0.037 0.005 0.169
Temnothorax longispinosus 0.086 0.062 0.114 0.333 0.141 0.587
Table 3. Estimated probabilities of capture and occurrence (with 95% credible intervals) for
ant species captured in forest habitat. Probabilities are estimated at the average value of the
covariates observed in the sample.
289
Modern Methods of Estimating Biodiversity from Presence-Absence Surveys

14 Will-be-set-by-IN-TECH
Capture probability Occurrence probability
Species Median 2.5% 97.5% Median 2.5% 97.5%
Camponotus herculeanus 0.014 0.002 0.050 0.190 0.040 0.731
Camponotus novaeboracensis 0.066 0.043 0.094 0.348 0.172 0.571
Camponotus pennsylvanicus 0.007 0.001 0.040 0.134 0.017 0.723
Dolichoderus plagiatus 0.015 0.002 0.073 0.105 0.016 0.515
Dolichoderus pustulatus 0.090 0.071 0.112 0.701 0.491 0.863
Formica neorufibarbis 0.007 0.001 0.040 0.126 0.015 0.691
Formica subaenescens 0.353 0.308 0.402 0.371 0.194 0.580
Formica subsericea 0.014 0.004 0.037 0.295 0.083 0.774
Lasius alienus 0.020 0.006 0.054 0.191 0.051 0.550
Lasius speculiventris 0.050 0.010 0.138 0.077 0.014 0.263
Lasius umbratus 0.008 0.001 0.034 0.210 0.037 0.766
Leptothorax canadensis 0.007 0.001 0.039 0.142 0.018 0.764
Myrmica lobifrons 0.559 0.529 0.589 0.916 0.748 0.984
Myrmica punctiventris 0.006 0.001 0.039 0.150 0.018 0.783
Myrmica species 1 (“AF-scu”) 0.015 0.002 0.073 0.102 0.015 0.486
Myrmica species 2 (“AF-smi”) 0.008 0.001 0.034 0.231 0.041 0.826
Stenamma brevicorne 0.007 0.001 0.041 0.149 0.019 0.772
Tapinoma sessile 0.167 0.133 0.207 0.356 0.184 0.561
Temnothorax ambiguus 0.007 0.001 0.042 0.127 0.017 0.697
Table 4. Estimated probabilities of capture and occurrence (with 95% credible intervals) for
ant species captured in bog habitat. Probabilities are estimated at the average value of the
covariates observed in the sample.
290
Biodiversity Loss in a Changing Planet