Gerver R.K., Sgroi R.J. Financial Algebra
Подождите немного. Документ загружается.


14 Chapter 1 The Stock Market
1. Why might the buyer and seller of the same stock both think that
their trading price was an “astute” decision? How might those words
apply to what you have learned?
Use the following information posted at the end of the trading day on
April 22 to answer Exercises 2–7.
52-week
High
52-week
Low Symbol Stock Last Change
Sales of
100s High Low
151,650 107,200 BRK/A Berkshire
Hathaway Inc
127,200 −1000 4.11 128,600 127,000
120.2 66.39 FCX Freeport-McMoRan
Copper & Gold Inc
118.65 3.51 147,540 120.06 116.64
63.69 46.64 MCD McDonald’s
Corporation
58.35 −0.55 106,077 58.77 57.42
266.81 112.11 PTR PetroChina
Company Ltd
137.19
+2.16
16,266 140.92 136.09
39.63 27.51 TXN Texas Instruments Inc 28.85 −1.74 288,012 29.64 28.38
144.04 92.18 WBK Westpac Banking
Corporation
113.62 2.45 332.7 115.35 113.50
2. What was the difference between the 52-week high and 52-week low
price for one share of PetroChina Company Ltd?
3. What is the difference between the day’s high and low prices for
McDonald’s Corporation?
4. Determine the volume for each of the following stocks.
a. Berkshire Hathaway Inc
b. McDonald’s Corporation
c. Texas Instruments Inc
d. Westpac Banking Corporation
5. Determine the closing price on April 21 for each of the following stocks.
a. Texas Instruments Inc
b. Freeport-McMoRan Copper & Gold Inc
6. Use the information from Exercise 5 to determine the percent of net
change from April 21 to April 22 for each of the corporations listed
in that question. Round answers to the nearest tenth of a percent.
7. On April 22, which stock(s) had a daily high that was approximately
50% lower than the 52-week high?
8. If the April net change for Westpac Banking Corporation was –3.03,
what was the closing price for that day?
One of the funny things about the stock market is that every
time one person buys, another sells, and both think they are
astute.
William Feather, Publisher and Author
Applications
49657_01_ch01_p002-061.indd 1449657_01_ch01_p002-061.indd 14 12/23/09 11:35:03 PM12/23/09 11:35:03 PM
1-2 Stock Market Data 15
9. Which of the following is a true statement? Explain your reasoning.
The 52-week high can never be higher than the day’s high.
The day’s high can never be higher than the 52-week high.
10. At the end of the trading day on April 25, Texas Instruments Inc closed
at $28.84, which was a +5.22% net change from the previous day’s
close. What was the approximate close on the previous day?
11. On April 25, Berkshire Hathaway Inc closed at $126,875 per share.
One year earlier, one share closed at $108,750. What was an approxi-
mate one-year percent change?
Use the spreadsheet below to answer Exercises 12–16.
ABCDEFGH
1 Symbol Stock
April 25
Last Change % Change
April 24
Close
Volume in
1,000s
Volume in
100s
2 AAPL Apple Inc 169.73 0.79 168.94 35,445
3 BBW Build-A-Bear
Workshop Inc
10.15 1.15 12.78% 616
4 CTB Cooper Tire &
Rubber Co
14.7 −1.82 16.52 2,671
5 F Ford Motor Co 7.5 −0.9 227,269
6 INTC Intel Corp 22.56 −0.57% 47,604
7 MSFT Microsoft Corp 29.83 −6.19% 31.80 145,194
8 NTGR NETGEAR Inc 16.76 −3.37 −16.74% 8,085
9 YHOO Yahoo! Inc 26.8 −1.83% 50,523
12. Write a formula that will convert the volume given in 1,000s into a
volume given in 100s. Use the left side of the equation to indicate in
which cell to store the formula.
a. Intel Corp b. Yahoo! Inc
13. Write a formula that will store the exact volume for each stock in
column I. Use the left side of the equation to indicate in which cell
to store the formula.
a. Build-A-Bear Workshop Inc b. NETGEAR Inc
14. Write a formula to determine the close on April 24 for each of the
following. Use the left side of the equation to indicate in which cell
to store the formula.
a. NETGEAR Inc b. Ford Motor Co
15. Write a formula to determine the percent change for each of the fol-
lowing. Use the left side of the equation to indicate in which cell to
store the formula.
a. Apple Inc b. Cooper Tire & Rubber Co
16. Write a formula to determine the net change for each. Use the left
side of the equation to indicate in which cell to store the formula.
a. Microsoft Corp b. Cooper Tire & Rubber Co
49657_01_ch01_p002-061.indd 1549657_01_ch01_p002-061.indd 15 12/23/09 11:35:03 PM12/23/09 11:35:03 PM

16 Chapter 1 The Stock Market
How can stock data be displayed?
Data can be presented in list form or in graphical form. The graphical
form is known as a
stock chart. These charts offer pictorial information
on anything from a day’s worth of data to multiyear data trends. Most
stock charts present historical information about the trading prices and
volumes of a particular stock.
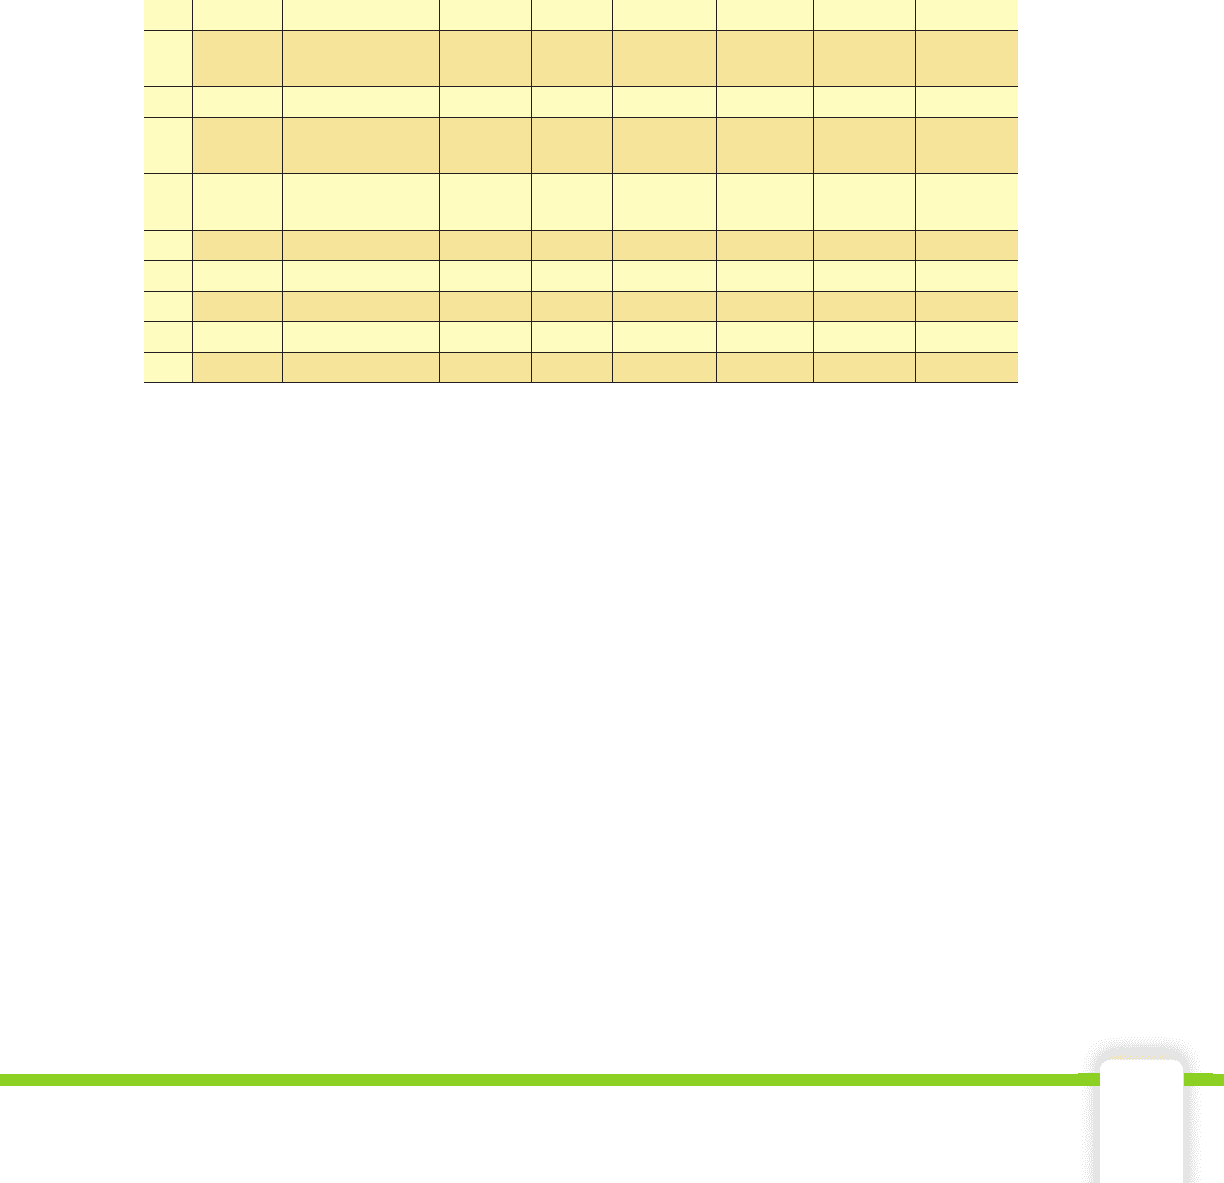
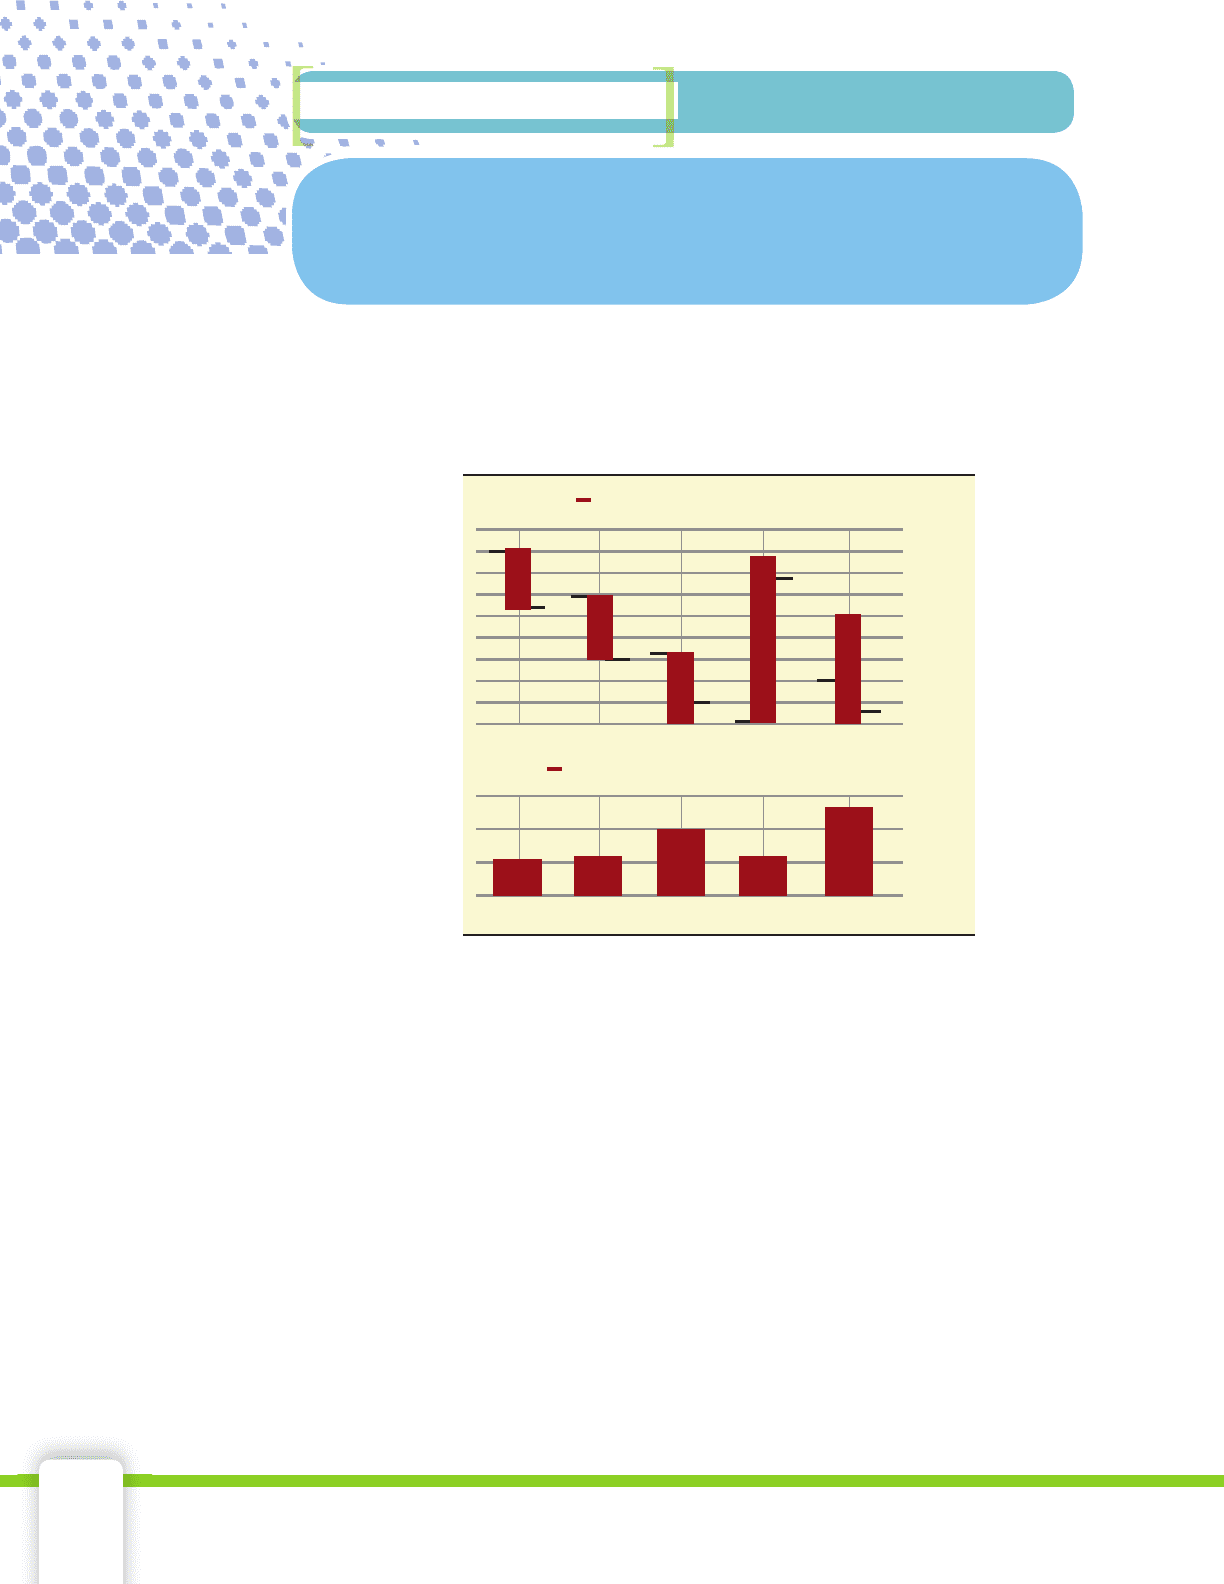
A common stock chart format is the
stock bar chart. The chart
below shows price and volume information for General Electric on April 30.
Notice the chart consists of two graphs. The top portion shows daily
information about the day’s high, low, open, and close prices. The bot-
tom portion shows the daily volume for that stock.
The top shaded bar is a rectangle formed between the day’s low and
high. The line segment on the left side of the rectangle is positioned at
the day’s opening price and the line segment on the right side is posi-
tioned at the day’s closing price.
The bottom
shaded bar starts
at 0 and rises to
the approximate
number of shares
traded on that
date. Notice that
the scale for this
particular portion
of the chart is in
millions, although
it could be in
hundreds or thou-
sands depending
upon the range in
the volume. Stock
bar charts can also
be used to show
the market action
on multiple days.
Key Terms
stock chart•
stock• bar chart
candlestick chart•
Objectives
Interpret a stock •
bar chart.
Create a stock bar
•
chart.
Interpret a stock
•
candlestick chart.
Create a stock
•
candlestick chart.
Stock Market Data Charts
1-3
Although it’s easy to forget sometimes, a share is not a lottery
ticket . . . it’s part-ownership of a business.
Peter Lynch, American businessman, Investment strategist, and Philanthropist
GE Daily
April 30
33.5
33.4
33.3
33.2
33.1
33.0
32.9
32.8
32.7
32.6
40
30
20
10
0
Volume
Millions
Open
Low
High
Close
Number of
Shares
Traded
49657_01_ch01_p002-061.indd 1649657_01_ch01_p002-061.indd 16 12/23/09 11:35:04 PM12/23/09 11:35:04 PM
1-3 Stock Market Data Charts 17
Skills and Strategies
Here you will learn how to interpret and create stock charts. The stock
bar chart below presents trading information for the week of April 28 for
Ford Motor Company.
EXAMPLE 1
Which day had the greatest high price?
Which day had the least low price?
SOLUTION The top portion of the chart
shows the day’s trading prices. Because
the top of each bar represents the day’s
high price, the greatest high for the week
was on May 2.
The bottom of each bar represents the
day’s low price, so the lowest low for the
week occurred on April 29.
EXAMPLE 2
Approximately how many shares of Ford
Motor Company were traded over the fi ve-day period?
SOLUTION The bottom portion of the chart shows the daily volume
of shares traded. The scale is in millions of shares. While it is not
possible to give an exact accounting of each day’s volume, you can
determine approximations of these amounts.
For April 28, the top of the volume bar reaches at a point slightly
higher than half the distance between the 150 million and 200 million
lines. An approximation of the day’s volume is 185 million shares.
For April 29, the volume appears to be slightly above the 50 million
line. So an approximation is 60 million shares.
Approximations for the rest of the week’s trading volumes are 65 mil-
lion, 60 million, and 90 million.
Add the fi ve approximations. 185 + 60 + 65 + 60 + 90 = 460
About 460,000,000 shares of Ford Motor Company were traded during
the week of April 28.
28 29 30 May 1 2
8.75
8.70
8.65
8.60
8.55
8.50
8.45
8.40
8.35
8.30
8.25
8.20
8.15
8.10
8.05
200
150
100
50
0
Volume
Millions
Ford Daily
p
CHECK
■
YOUR UNDERSTANDING
Between which two days did after-
hours trading appear to have the
biggest impact on the difference
between the closing price and the
following day’s opening price?
49657_01_ch01_p002-061.indd 1749657_01_ch01_p002-061.indd 17 12/23/09 11:35:05 PM12/23/09 11:35:05 PM
18 Chapter 1 The Stock Market
CHECK
■
YOUR UNDERSTANDING
Use the stock bar chart to write a brief fi nancial story of the trading
action that occurred for Ford Motor Company on April 28 and
April 29. Begin your story with “On April 28, one share of Ford Motor
Company opened at $8.15. During the day . . . ”
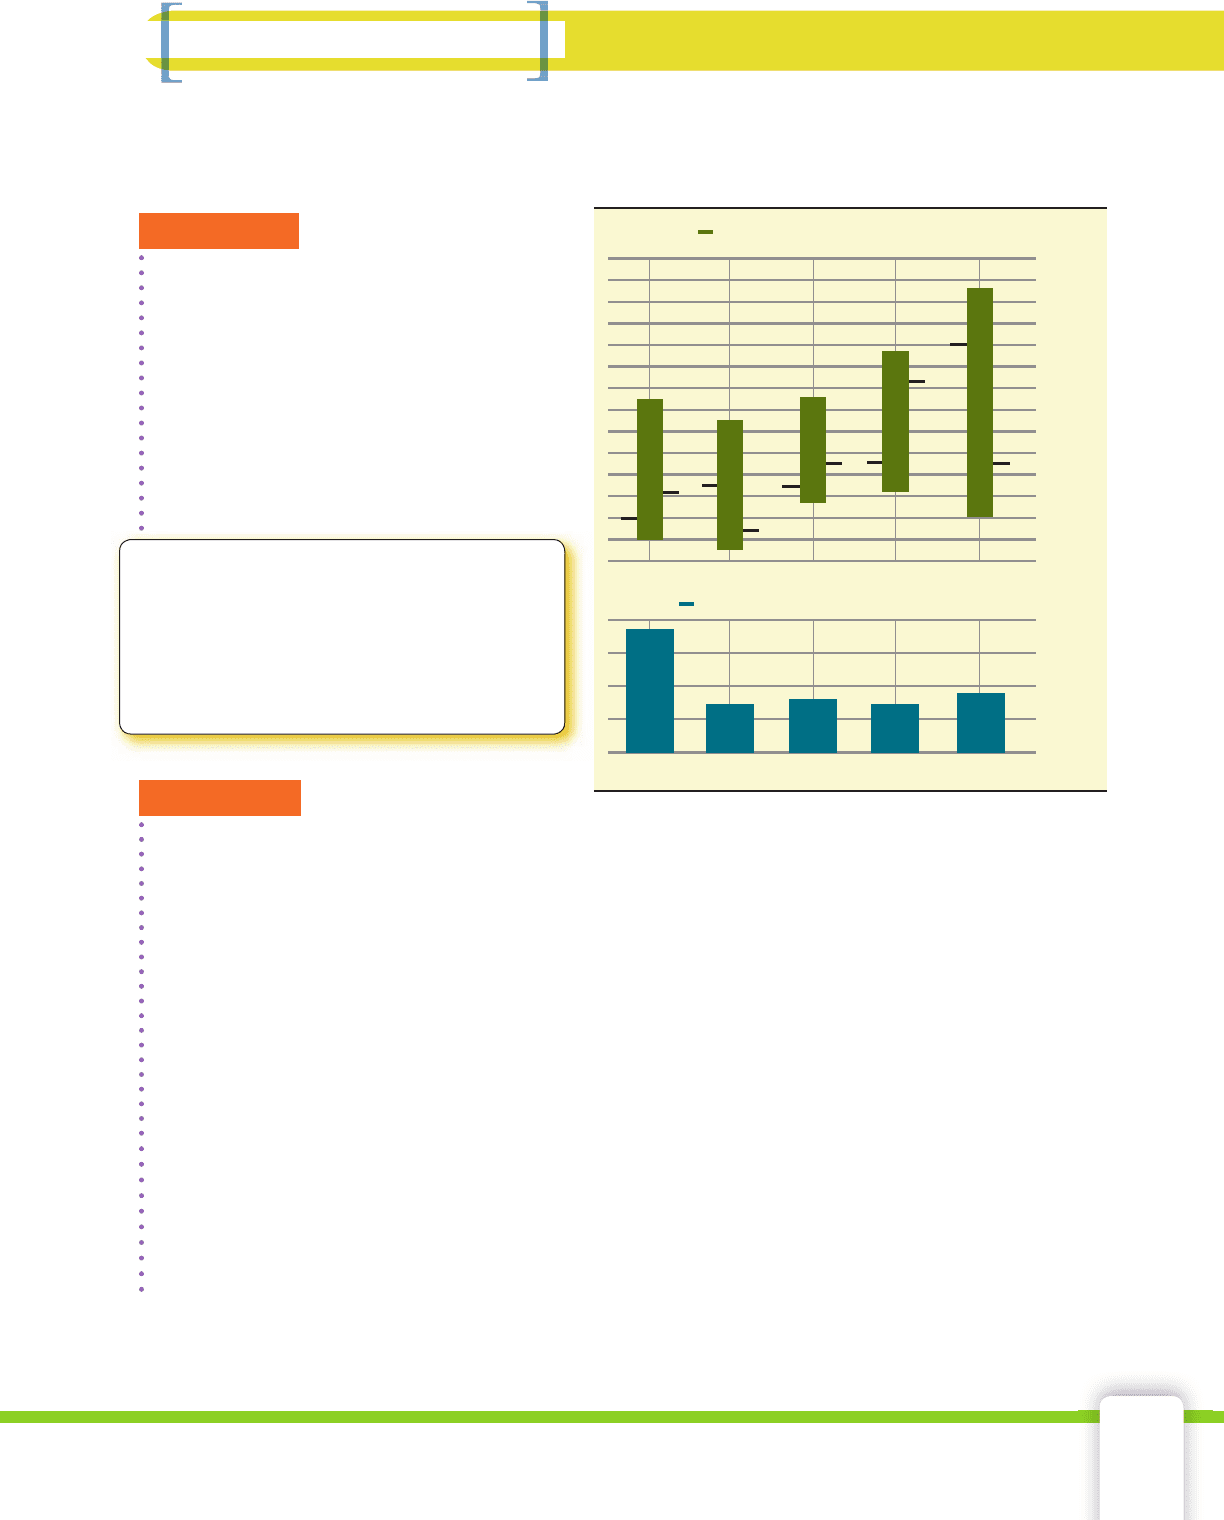
EXAMPLE 3
Use the information below to construct a one-day stock bar chart.
Open: $40.10 Close: $39.79
High: $40.65 Low: $39.39 Volume: 44,500,000
SOLUTION Determine an appropriate interval to use to display the
information. The range of the daily prices is from $39.39 to $40.65.
Therefore, choose a value to begin the interval that is less than the
lowest price and a value to end the interval that is greater than the
highest price. Use $39.25 to $40.75. Next, establish interval amounts
that are easy to read. Use intervals of $0.25.
Draw a rectangle whose bottom is positioned at the low for the day
and top at the high for the day. Draw a line to the left of the rectangle
that is approximately at the opening price and a line to the right of
the rectangle that is approximately at the closing price.
Next construct the volume portion of the chart. Select a suitable inter-
val in millions, in this case 0 to 50. Beginning at 0, construct a bar that
rises to the approximate volume for the day.
These two portions form a one-day stock bar chart.
CHECK
■
YOUR UNDERSTANDING
Suppose that trading was suspended for one entire day for a
corporation. What might the stock bar chart look like?
BAC Daily
May 2
40.75
40.50
40.25
40.00
39.75
39.50
39.25
50
40
30
20
10
0
Volu me
Millions
49657_01_ch01_p002-061.indd 1849657_01_ch01_p002-061.indd 18 12/23/09 11:35:05 PM12/23/09 11:35:05 PM
1-3 Stock Market Data Charts 19
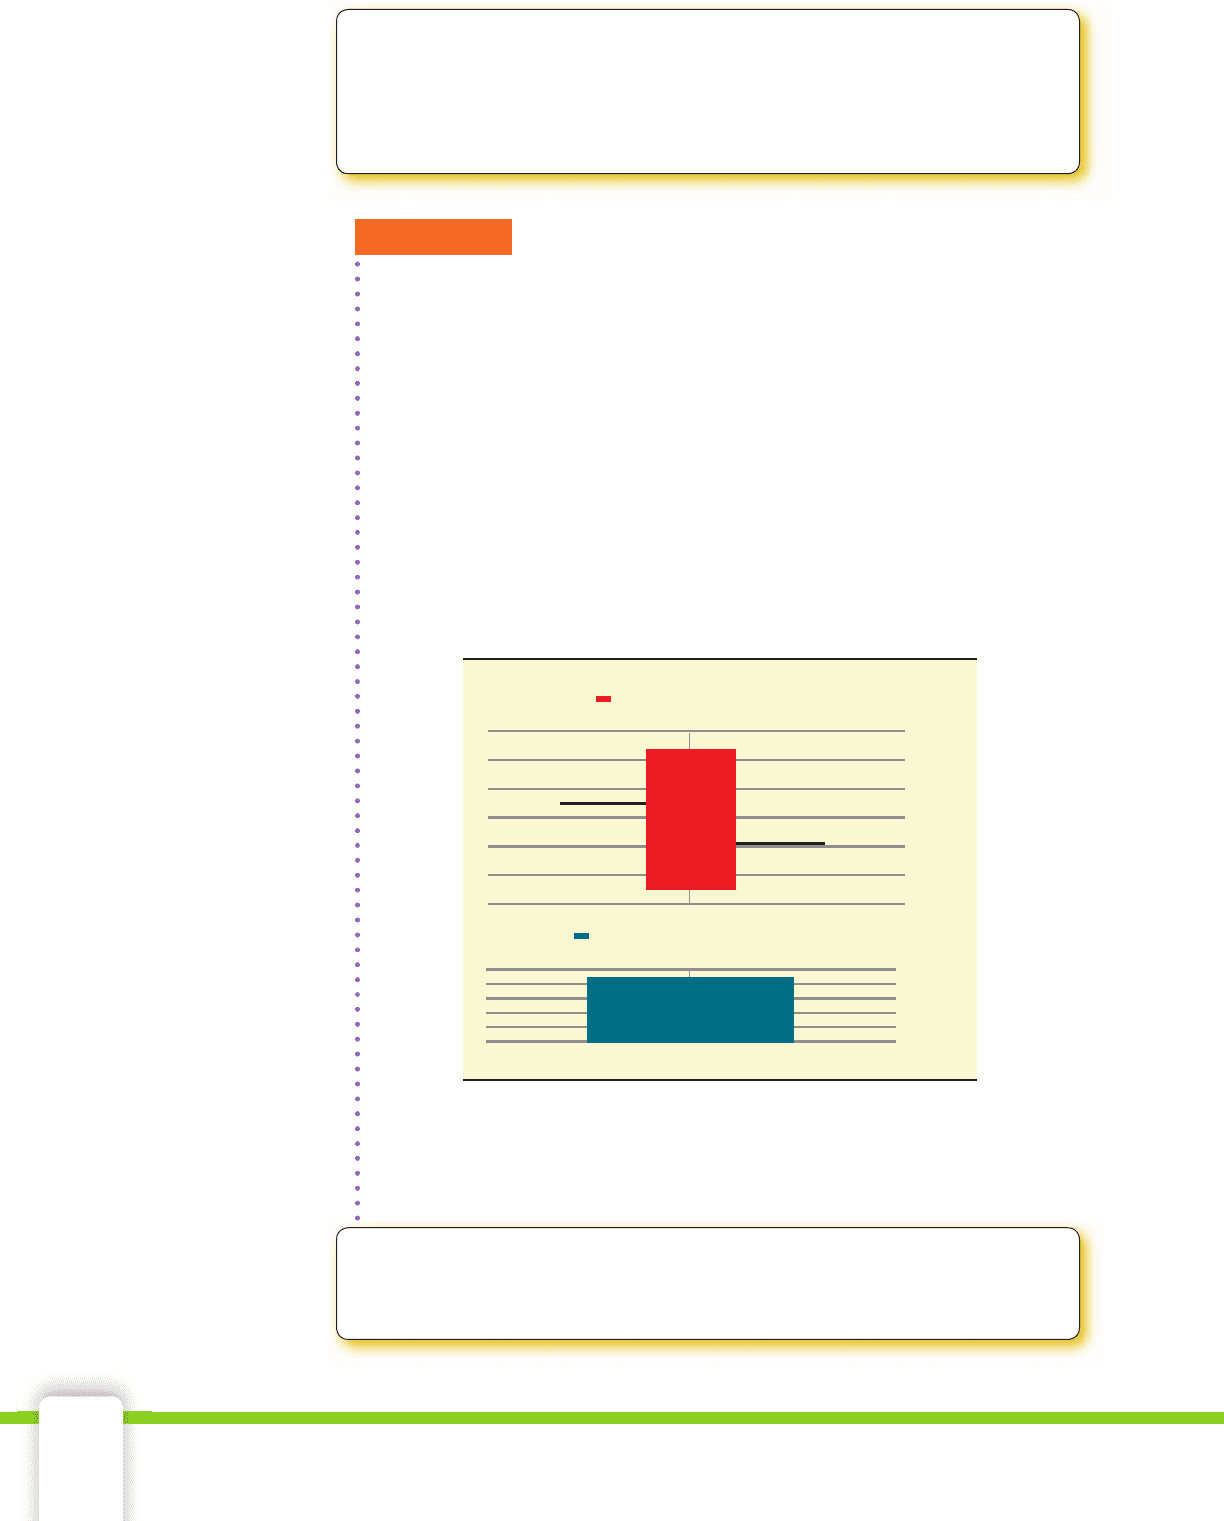
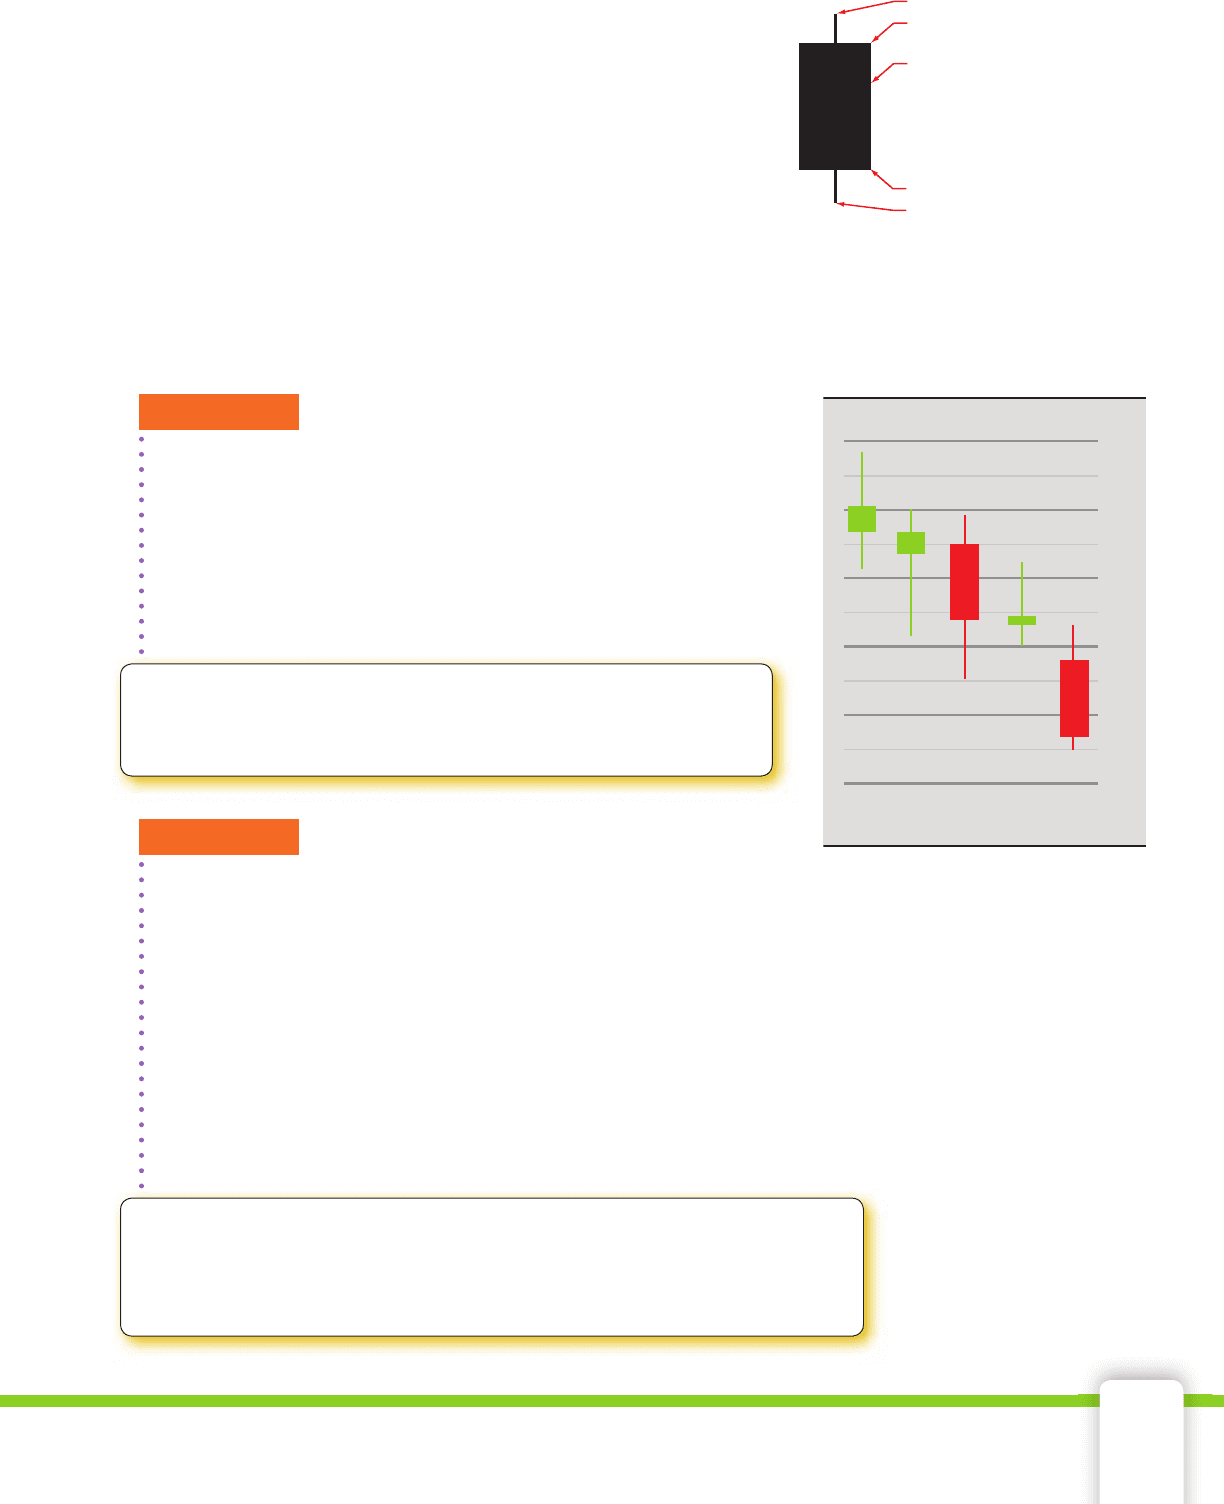
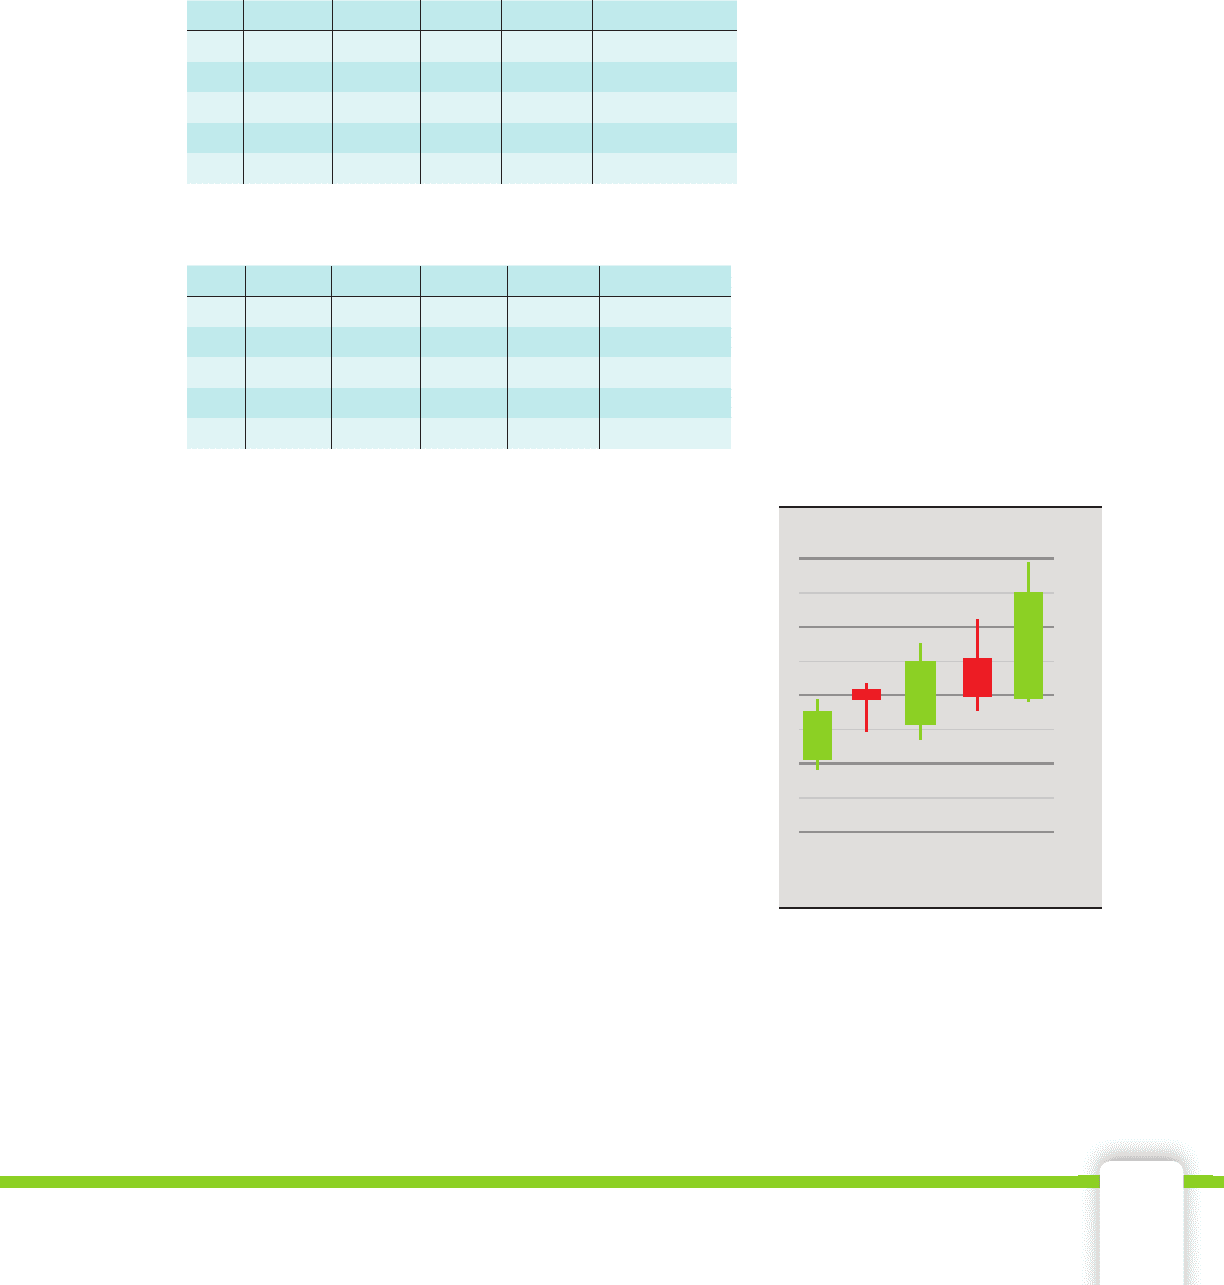
Candlestick Charts
Another type of chart that is similar to a stock bar chart is a
candlestick chart. A candlestick chart may be easier to read
and contains more information at a glance. The top and bot-
tom of the vertical line indicate the high and low prices over
the given time period. The rectangular region is known as the
real body and is displayed in two different colors depending
upon the action for the day on that stock.
The colors used to indicate the changes in the day’s prices
can be customized. The candlestick chart for Sept. 7–11 depicts
market action for a particular stock for fi ve days in September.
The green candlestick indicates that the closing price is greater than the
opening price. The red candlestick indicates the opposite; the closing
price is less than the opening price.
EXAMPLE 4
Explain the difference between the market action on
September 8 compared to September 9 shown in the candlestick
chart for Sept. 7–11.
SOLUTION The candlestick is green on September 8, which
means the closing price for the day was higher than the
opening price. The red candlestick on September 9 indicates
that the opening price for the day was higher than the clos-
ing price.
40.0
39.5
39.0
38.5
38.0
37.5
September
7 8 9 10 11
Candlestick Chart, Sept. 7−11
the highest price for the day
the lowest price for the day
open or closing price
open or closing price
body is black (or red) if stock
closed lower than opening
price; body is white
(or green) if it closed higher
than opening price
EXAMPLE 5
What was the approximate difference between the highest
price and the lowest price for the week shown in the candlestick chart
for Sept. 7–11?
SOLUTION The highest price for the week, approximately $39.90,
occurred on September 7 as indicated by the highest portion of any of
the candlesticks.
The lowest price for the week, approximately $37.75, occurred on
September 11 as indicated by the lowest portion of any of the
candlesticks.
The difference between the week’s high and low prices is
approximately $39.90 − $37.75, or $2.15.
CHECK
■
YOUR UNDERSTANDING
The lengths of the candlesticks for September 8 and 11 are
approximately the same. What does this mean about the trading
prices on both of those days?
CHECK
■
YOUR UNDERSTANDING
Interpret a green candlestick that is shown as only a
rectangle with no lines at the top or bottom.
49657_01_ch01_p002-061.indd 1949657_01_ch01_p002-061.indd 19 12/23/09 11:35:06 PM12/23/09 11:35:06 PM
20 Chapter 1 The Stock Market
Applications
Although it’s easy to forget sometimes, a share is not a lottery
ticket . . . it’s part-ownership of a business.
Peter Lynch, American businessman, Investment strategist, and Philanthropist
1. How might those words apply to what you have learned? Why is the
author warning readers that a share is not a lottery ticket?
The following stock bar chart depicts the market action for The
Washington Post Company during the week of April 28. Use the chart to
answer Exercises 2–11.
2. On what date did the stock close at a price higher than it opened?
3. What was the day’s opening price on the following days?
April 28
April 29
April 30
May 1
May 2
4. What was the day’s high price on April 29?
5. What was the day’s low price on May 1?
6. What was the day’s close on May 2?
7. What was the approximate net change from April 29 to April 30?
Express that net change as a monetary amount and as a percent to
the nearest tenth.
8. What was the approximate net change from April 30 to May 1?
Express that net change as a monetary amount and as a percent to
the nearest tenth.
WPO Daily
Apr. 28 29 30 May 1 2
695
690
685
680
675
670
665
660
655
650
60
40
20
0
Volume
ousands
49657_01_ch01_p002-061.indd 2049657_01_ch01_p002-061.indd 20 12/23/09 11:35:06 PM12/23/09 11:35:06 PM
1-3 Stock Market Data Charts 21
9. Approximately how many shares were traded on April 30?
10. Approximately how many fewer shares were traded on April 28 than
on May 2?
11. Suppose that the volume numbers had been listed in hundreds on
the table. How would that have changed the labels?
12. Use the following data to construct a stock bar chart for the
5-day period.
Day Open Close High Low Volume
1 20.48 20.24 20.50 20.20 58,000,000
2 20.21 20.25 20.30 20.00 52,000,000
3 20.30 20.10 20.34 20.02 42,000,000
4 20.17 20.44 20.45 20.10 50,000,000
5 20.48 20.61 20.65 20.36 50,000,000
13. Use the following data to construct a stock bar chart for the
5-day period.
Day Open Close High Low Volume
1 59.75 59.60 60.00 59.22 7,900,000
2 59.15 60.20 60.50 59.15 8,000,000
3 60.00 59.58 60.61 59.55 8,200,000
4 59.55 60.90 60.90 59.37 7,000,000
5 60.87 60.93 61.25 60.79 7,750,000
14. Use the candlestick chart to answer the questions.
a. On which days were opening prices higher
than the closing prices?
b. On which days were the closing prices higher
than the opening prices?
c. What was the approximate closing price on
April 28?
d. What was the approximate high price on
May 1?
e. What was the difference between the lowest
price and the highest price recorded for this
time period?
f. What does the very short line at the bottom
of the May 1 candlestick indicate?
g. Had the chart used white and black candlesticks,
which days would be white and which days
would be black?
h. On which consecutive days was the closing
price of the fi rst day higher than the opening price
of the second day?
15. Construct a candlestick chart for the information presented in
Exercise 12.
16. Construct a candlestick chart for the information presented in
Exercise 13.
April May
27 28 29 30 1
33.5
33.0
32.5
32.0
31.5
49657_01_ch01_p002-061.indd 2149657_01_ch01_p002-061.indd 21 12/23/09 11:35:07 PM12/23/09 11:35:07 PM
22 Chapter 1 The Stock Market
Objectives
Understand how •
data is smoothed.
Calculate simple
•
moving averages
using the
arithmetic average
formula.
Calculate simple
•
moving averages
using the
subtraction and
addition method.
Graph simple
•
moving
averages using a
spreadsheet.
lagging indicators•
fast moving average•
slow moving average•
crossover•
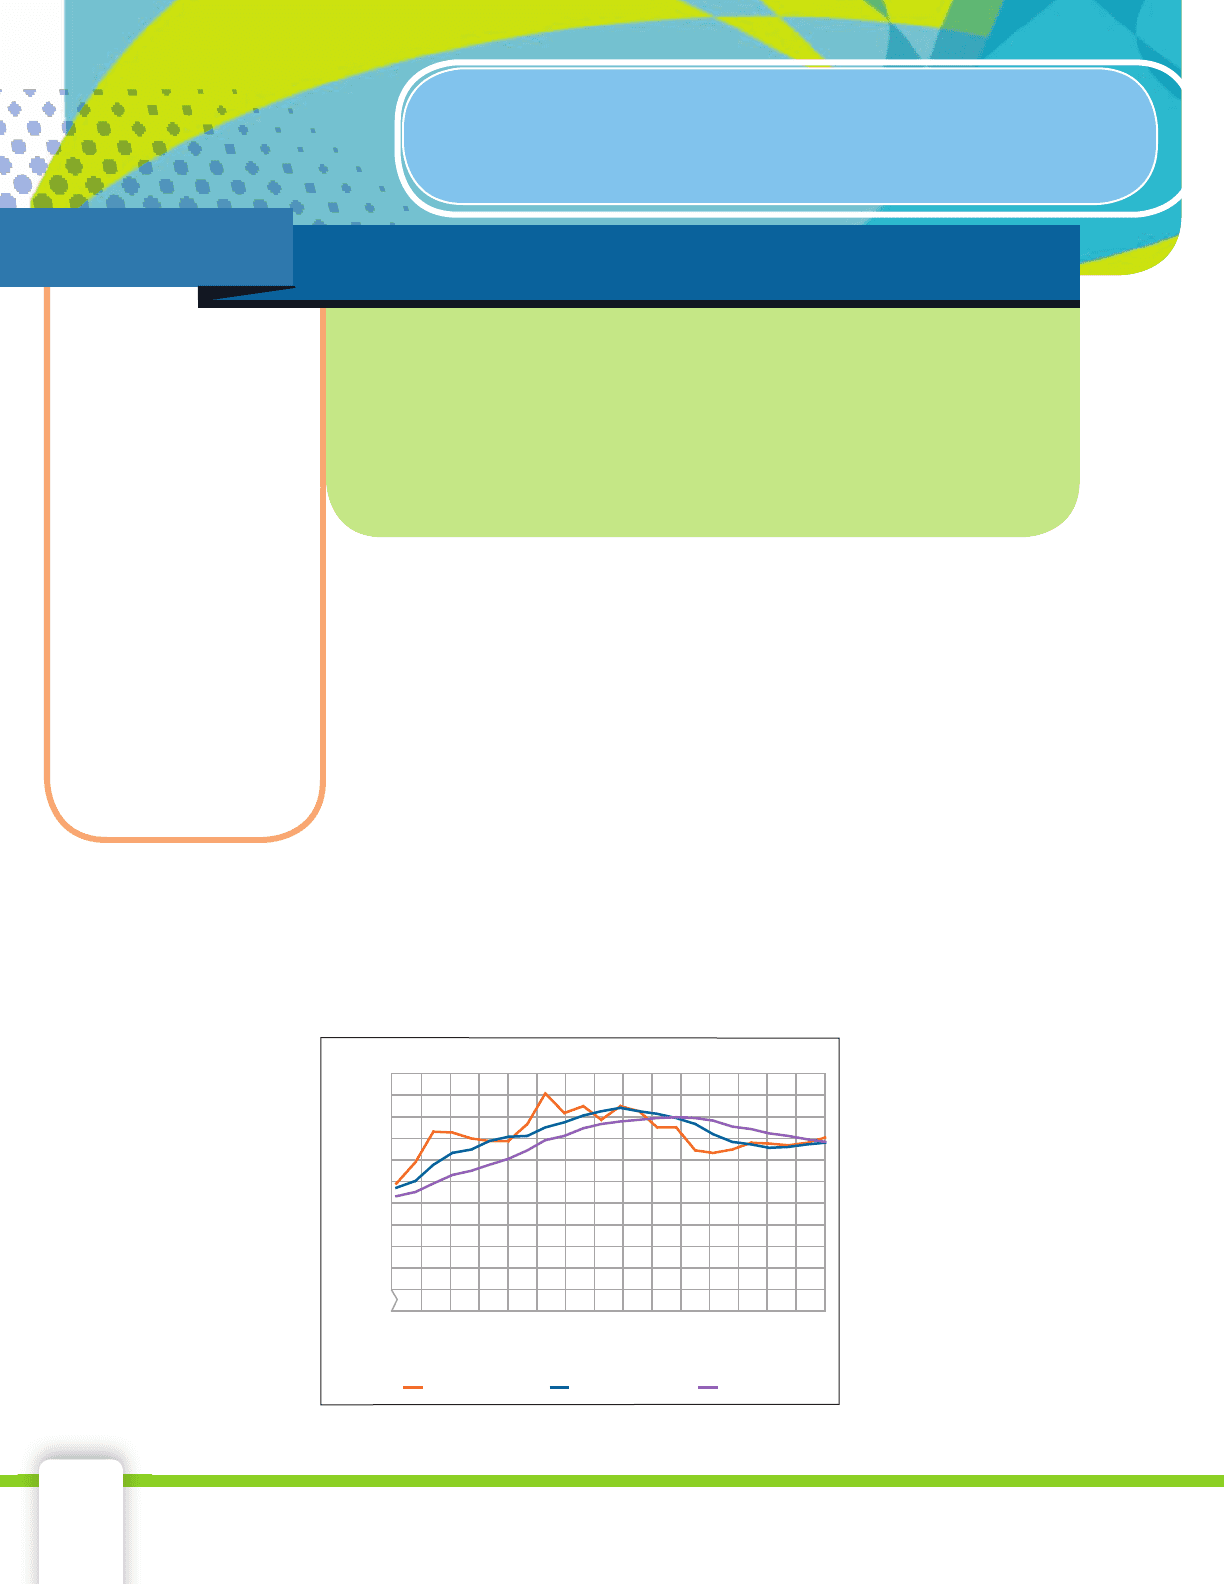
How can stock data be smoothed?
Stock market prices can fl uctuate greatly from trade to trade based upon
a variety of external factors. You have already seen that the high and
low for a day may not necessarily be near the day’s opening or clos-
ing prices. Those differences often make it diffi cult to spot trends that
are occurring over time.
Smoothing techniques are statistical tools
that allow an investor to reduce the impact of price fl uctuations and
to focus on patterns and trends. One such technique is known as a
simple moving average (SMA). Simple moving averages are calcu-
lated by determining the
arithmetic average (mean) closing price
over a given period of time.
The graph shows the daily stock closing prices, 5-day SMA and
10-day SMA over a period of 30 trading days. Notice how the clos-
ing prices fl uctuated from day to day and the moving average graphs
smoothed out that data. The longer the moving average time interval,
the smoother the graph appears to be.
Moving aver-
ages are known as
lagging indicators
because they use past
data. Investors use
simple moving aver-
ages when they want
to identify and fol-
low a trend in prices.
Key Terms
smoothing techniques•
simple moving •
average (SMA)
arithmetic average •
(mean)
Trading Day
Closing Price
Daily Close
5-Day SMA
1 3 5 7 9 11 13 15 17 19 21 23 25 27
40
39
38
37
36
35
34
33
32
0
Stock Prices
10-Day SMA
Simple Moving Averages
1-4
Never try to walk across a river just because it has an average
depth of four feet.
Milton Friedman, American economist
49657_01_ch01_p002-061.indd 2249657_01_ch01_p002-061.indd 22 12/23/09 11:35:08 PM12/23/09 11:35:08 PM
1-4 Simple Moving Averages 23
Skills and Strategies
Recall that the average of a set of numerical data is the sum of the items
in that set divided by the number of items. You can determine the aver-
age of any number of closing prices, but this gives you little information
about trends because you would have nothing to compare the averages
to. A better comparison method to use is a simple moving average.
Simple Moving Averages Using the Arithmetic
Average Formula
Although simple moving averages can span any length of time, in
Example 1 you will fi nd averages by taking closing prices 5 days at a
time. Find an average of the prices for each of the 5-day time spans: days
1–5, days 2–6, days 3–7, days 4–8, days 5–9, and days 6–10. Graph the six
averages. The graph has a smoother appearance compared to the graph
of the closing prices of days 5–10. A moving average graph appears to
smooth the fl uctuations in closing prices.
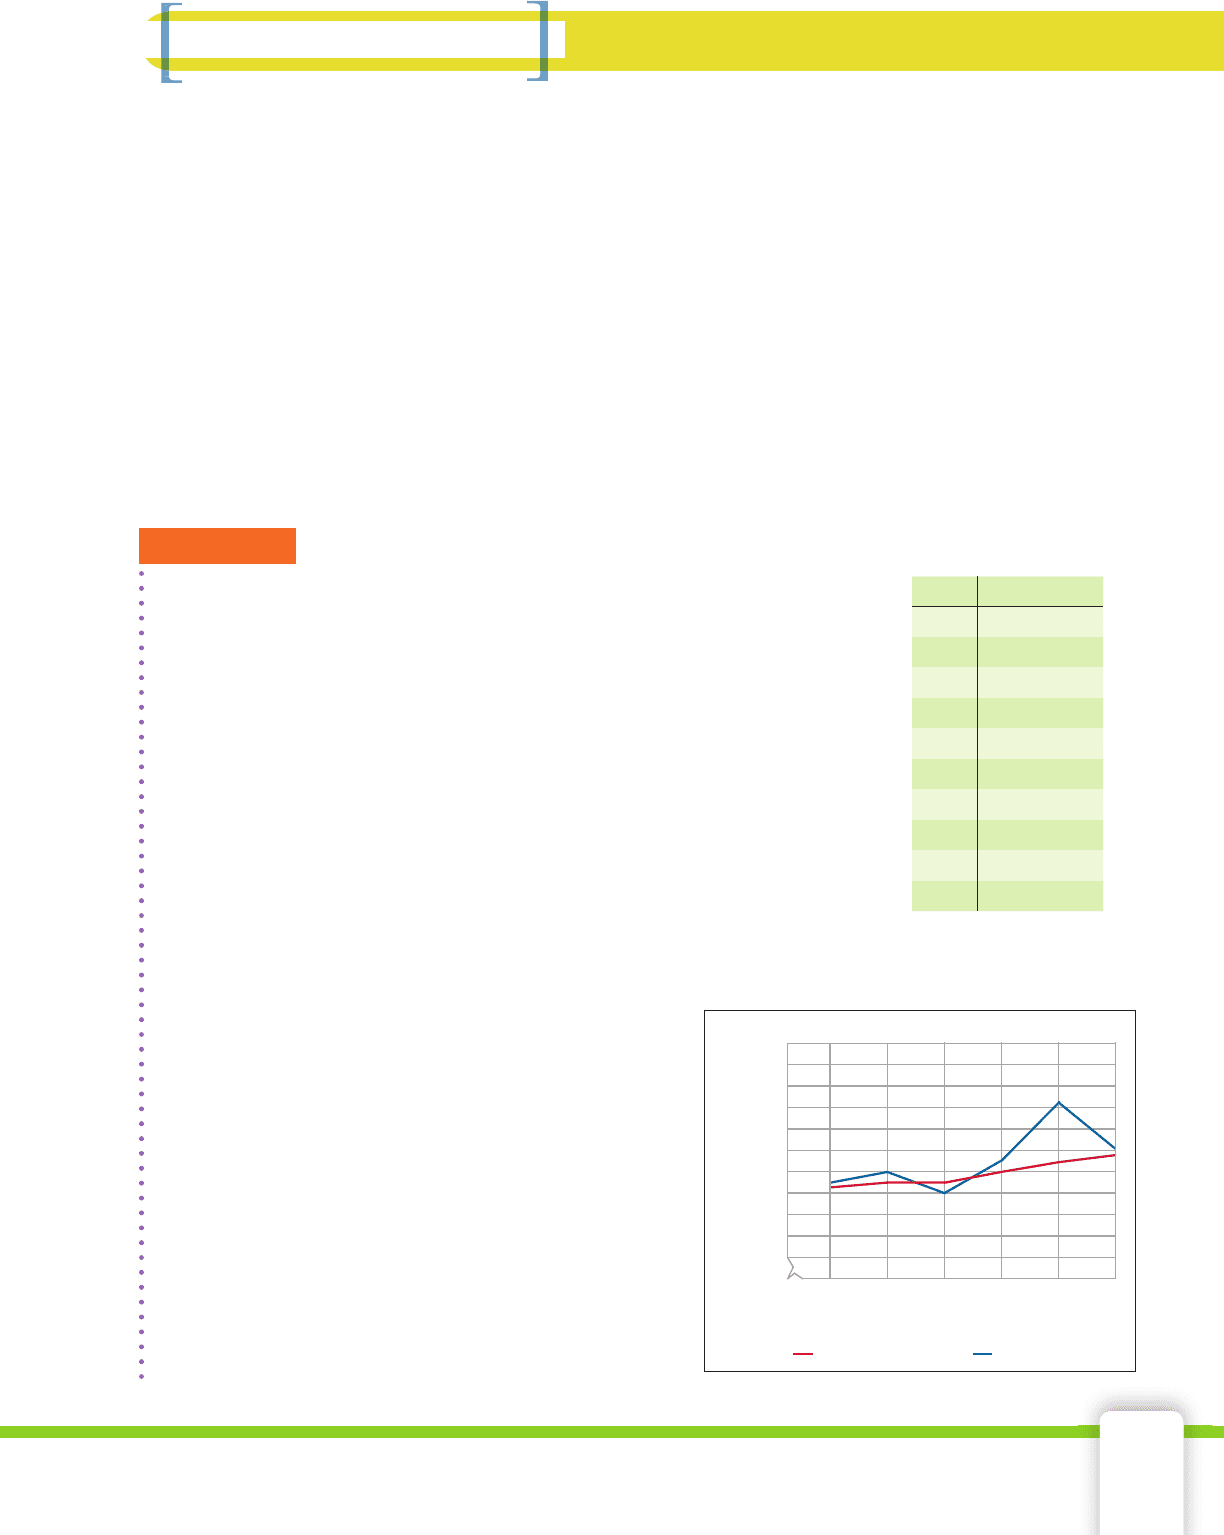
EXAMPLE 1
The closing prices for 10 consecutive trading days for a particular stock
are shown. Calculate the 5-day SMA and plot both the closing prices
and the averages on a graph.
SOLUTION Find the average of the closing prices in groups of fi ve.
Find the SMA using the closing prices from days 1–5.
35.02 + 35.01 + 34.65 + 36.09 + 35.32
______________________________________
5
= 35.218 ≈ 35.22
Days 2–6
35.01 + 34.65 + 36.09 + 35.32 + 35.50
______________________________________
5
= 35.314 ≈ 35.31
Days 3–7
34.65 + 36.09 + 35.32 + 35.50 + 35.03
______________________________________
5
= 35.318 ≈ 35.32
Days 4–8
36.09 + 35.32 + 35.50 + 35.03 + 35.79
______________________________________
5
= 35.546 ≈ 35.55
Days 5–9
35.32 + 35.50 + 35.03 + 35.79 + 37.07
______________________________________
5
= 35.742 ≈ 35.74
Days 6–10
35.50 + 35.03 + 35.79 + 37.07 + 36.05
______________________________________
5
= 35.888 ≈ 35.89
The fi ve consecutive 5-day SMA are $35.22, $35.31,
$35.32, $35.55, $35.74, and $35.89.
The graph of the closing prices and the simple
moving averages for days 5 through 10 are shown.
Notice how the moving averages smooth out the
data.
Day Closing Price
1 35.02
2 35.01
3 34.65
4 36.09
5 35.32
6 35.50
7 35.03
8 35.79
9 37.07
10 36.05
Trading Days
Closing Price
Daily Prices
567 8910
38.0
37.5
37.0
36.5
36.0
35.5
35.0
34.5
34.0
0
Moving Average
5-Day Moving Averages
49657_01_ch01_p002-061.indd 2349657_01_ch01_p002-061.indd 23 12/23/09 11:35:09 PM12/23/09 11:35:09 PM