Gerver R.K., Sgroi R.J. Financial Algebra
Подождите немного. Документ загружается.

94 Chapter 2 Modeling a Business
EXAMPLE 3
Use a spreadsheet to determine the breakeven price for the Picasso
Paints product.
SOLUTION Develop general expense and revenue equations so the
spreadsheet can calculate the breakeven prices regardless of the situations.
The expense function is E = Vp + F, where p equals price, V equals vari-
able costs, and F equals fi xed costs. The revenue function is R = Ap
2
+ Bp
where p equals price and A and B are values specifi c to the particular situ-
ation. Set the expense equation equal to the revenue equation.
E = R
Subtract Vp + F from both sides. Vp + F = Ap
2
+ Bp
–Vp – F = –Vp – F
0 = Ap
2
+ Bp – Vp – F
Combine like terms. 0 = Ap
2
+
(
B – V
)
p – F
This is a quadratic equation where a = A, b = (B – V), and c = –F. Depend-
ing on the spreadsheet software, cell formulas may vary. The Picasso Paints
functions are E = –3,500p + 238,000 and R = –500p
2
+ 30,000.
The values of V and F from the expense function are entered into
cells B3 and B4. The values of A and B from the revenue function are
entered into cells B7 and B8. Cells B15 and B16 are the breakeven
prices calculated using the quadratic formula.
For B15 the formula is =(–B12+SQRT(B12ˆ2–4*B11*B13))/(2*B11).
For B16 the formula is =(–B12–SQRT(B12ˆ2–4*B11*B13))/(2*B11).
AB
1 Breakeven Calculator
2
The expense equation has the form Vp + F.
–3,500p + 238,000
3
Enter the value of V in cell B3.
–3,500
4
Enter the value of F in cell B4. 238,000
5
6
The revenue equation has the form Ap
2
+ Bp.
–500p
2
+ 30,000p
7
Enter the value of A in cell B7.
–500
8 Enter the value of B in cell B8. 30,000
9
10 Solve the quadratic equation.
–500p
2
+ 33,500p +
–238,000
11
where a =
–500
12
b =
33,500
13
c =–238,000
14
15
The price at the fi rst breakeven point is
$8.08
16
The price at the second breakeven point is $58.92
CHECK
■
YOUR UNDERSTANDING
What cell formulas were used to identify the a, b, and c values shown
in B11, B12, and B13?
49657_02_ch02_p062-113.indd Sec13:9449657_02_ch02_p062-113.indd Sec13:94 12/24/09 12:13:41 AM12/24/09 12:13:41 AM

2-6 Breakeven Analysis 95
1. How might the quote apply to what you have learned?
2. A manufacturer has determined that the combined fi xed and variable
expenses for the production and sale of 500,000 items are $10,000,000.
What is the price at the breakeven point for this item?
3. A supplier of school kits has determined that the combined fi xed and
variable expenses to market and sell G kits is W.
a. What expression models the price of a school kit at the
breakeven point?
b. Suppose a new marketing manager joined the company and
determined that the combined fi xed and variable expenses would
only be 80% of the cost if the supplier sold twice as many kits.
Write an expression for the price of a kit at the breakeven point
using the new marketing manager’s business model.
4. A jewelry manufacturer has determined the expense equation for
necklaces to be E = 1,250q + 800,000, where q is the quantity
demanded. At a particular price, the breakeven revenue is $2,600,000.
a. What is the quantity demanded at the breakeven point?
b. If the breakeven revenue changes to 3.5 million, will the quan-
tity demanded have increased or decreased? Explain.
5. A manufacturer determines that a product will reach the breakeven
point if sold at either $80 or $150. At $80, the expense and revenue
values are both $300,000. At $150, the expense and revenue values
are both $100,000.
On graph paper, graph possible revenue and expense functions that
depict this situation. Circle the breakeven points.
6. iSports is considering producing a line of baseball caps with wire-
less cellphone earpieces attached. The breakeven point occurs when
the price of a cap is $170 or $350. At $170, the expense and revenue
values are both $2,600,000. At $350, the expense and revenue values
are both $900,000.
On graph paper, graph possible revenue and expense functions that
depict this situation. Circle the breakeven points.
7. SeaShade produces beach umbrellas. The expense function is
E = –19,000p + 6,300,000 and the revenue function is
R = –1,000p
2
+ 155,000p.
a. Graph the expense and revenue functions. Label the maximum
and minimum values for each axis. Circle the breakeven points.
b. Determine the prices at the breakeven points.
c. Determine the revenue and expense amounts for each of the
breakeven points.
Risk comes from not knowing what you’re doing.
Warren Buffet, Businessman
Applications
49657_02_ch02_p062-113.indd Sec13:9549657_02_ch02_p062-113.indd Sec13:95 12/24/09 12:13:41 AM12/24/09 12:13:41 AM
96 Chapter 2 Modeling a Business
8. Where-R-U produces global positioning systems (GPS) that can be
used in a car. The expense equation is E = –5,000p + $8,300,000,
and the revenue equation is R = –100p
2
+ 55,500p.
a. Graph the expense and revenue functions. Circle the breakeven
points.
b. Determine the prices at the breakeven points. Round to the near-
est cent.
c. Determine the revenue and expense amounts for each of the
breakeven points. Round to the nearest cent.
9. The student government at State College is selling inexpensive
bookcases for dorm rooms to raise money for school activities. The
expense function is E = –200p + 10,000 and the revenue function is
R = –18p
2
+ 800p.
a. At what price would the maximum revenue be reached? What would
that maximum revenue be? Round to the nearest cent.
b. Graph the expense and revenue functions. Circle the breakeven
points.
c. Determine the prices at the breakeven points. Round to the near-
est cent.
d. Determine the revenue and expense amounts for each of the
breakeven points. Round to the nearest cent.
10. An electronics store is selling car chargers for cell phones. The
expense function is E = –300p + 13,000 and the revenue function is
R = –32p
2
+ 1,200p.
a. At what price would the maximum revenue be reached?
b. What would that maximum revenue be? Round to the nearest
cent.
c. Graph the expense and revenue functions. Circle the breakeven
points.
d. Determine the prices at the breakeven points. Round to the near-
est cent.
e. Determine the revenue and expense amounts for each of the
breakeven points. Round to the nearest cent.
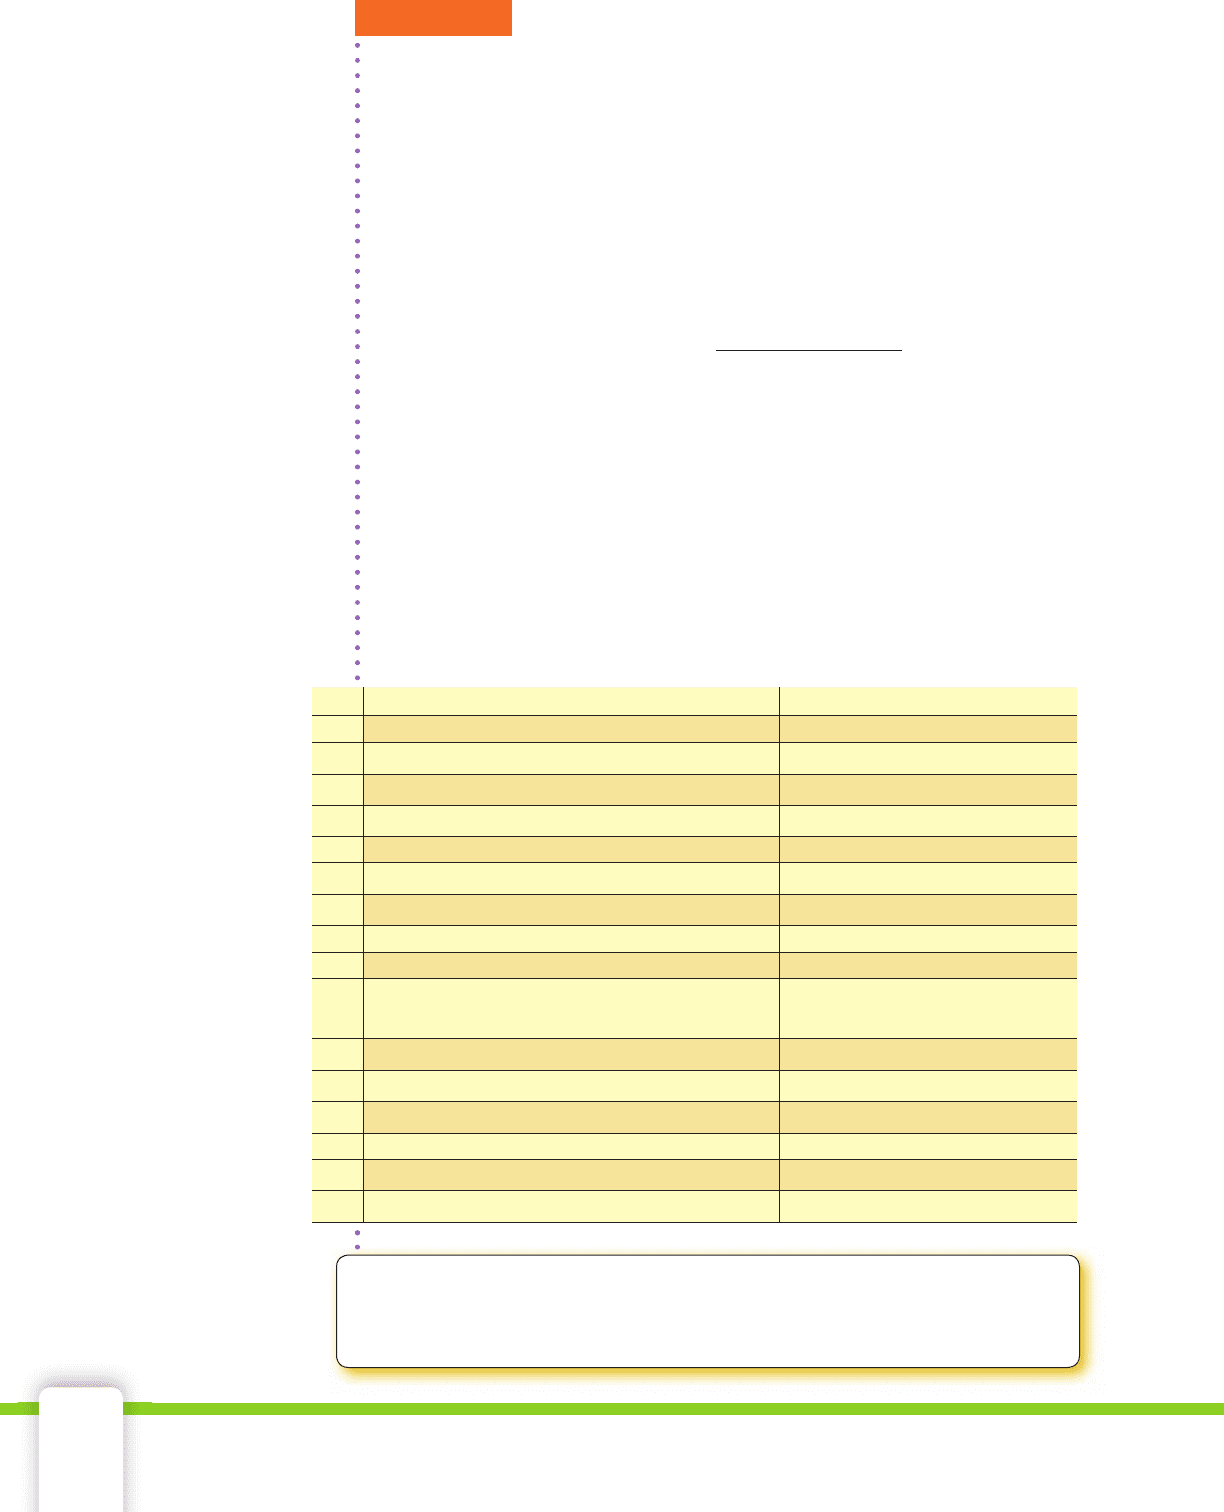
Use the graph to answer Exercises 11–14.
11. At what price is the
maximum profi t reached?
12. What are the breakeven
prices?
13. Name two prices where
the revenue is greater
than the expenses.
14. Name two prices where
the revenue is less than
the expenses.
100,000
200
price
dollars
0
49657_02_ch02_p062-113.indd Sec13:9649657_02_ch02_p062-113.indd Sec13:96 12/24/09 12:13:42 AM12/24/09 12:13:42 AM
2-7 The Profit Equation 97
How do revenue and expenses
contribute to profit calculation?
In the business world, two companies may produce and sell the same
product. It is possible that both companies will have the same maximum
revenue based on their individual revenue functions. However, other
aspects of production may not be identical.
Revenue is the amount of money a company makes from the sale of
goods or services. While the maximum revenue may be the same for each
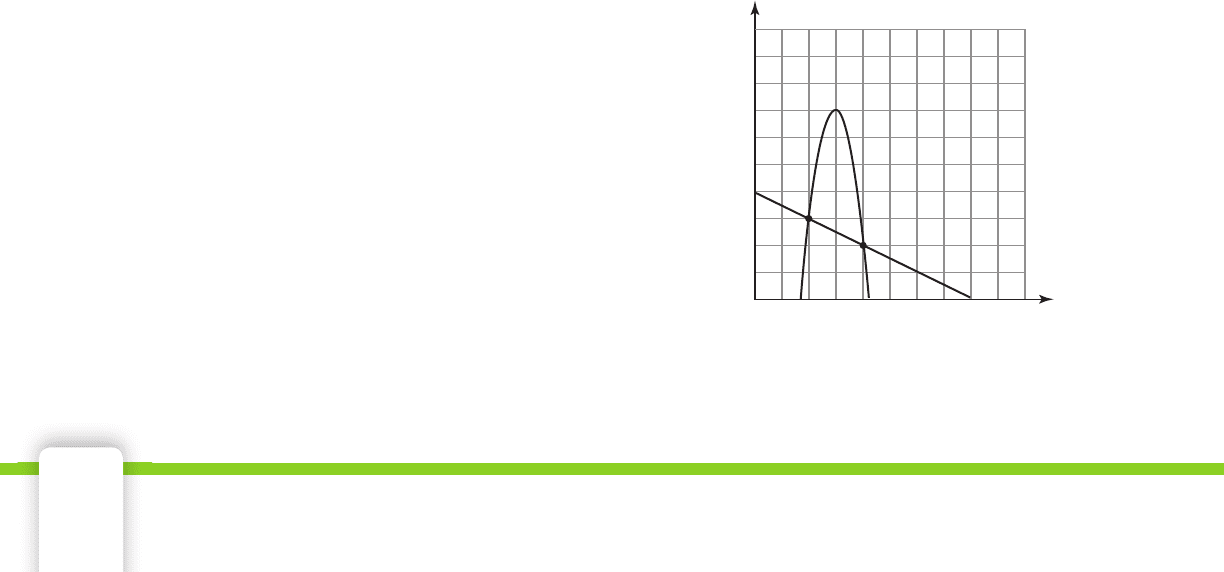
product, the revenue and expense equations may be different. Figure A
displays the graph of the revenue function for the product. Figure B dis-
plays the graph of the revenue function of a similar product produced by
a different company. The graphs of the revenue functions yield the same
maximum values but model different situations.
Figures C and D depict the same revenue functions but different
expense functions. Figure C shows an expense function that is always
greater than the revenue graph. Therefore, the company makes no
money on the manufacture and sale of the product. The company can-
not even reach a breakeven point because there are no breakeven points.
In Figure D, the expense function is greater than the revenue function at
certain prices, but there are also prices at which the opposite is true.
A company would prefer Figure D to model the sale of its product
because there are prices at which money coming in is greater than
money spent. The money a company makes after expenses have been
deducted from revenue is
profi t. In Figure D, there are prices at which
the company will make a profi t. In Figure C, no matter the price, the rev-
enue is never enough to offset the expenses.
Key Terms
profi t •
maximum profi t•
Objectives
Determine a profi t •
equation given
the expense
and revenue
equations.
Determine the
•
maximum profi t
and the price
at which that
maximum is
attained.
The Profi t Equation
2-7
Figure A Figure B Figure C Figure D
500,000
70
price
dollars
0
500,000
70
price
dollars
0
70
0
500,000
price
dollars
500,000
70
price
dollars
0
Nobody ever lost money taking a profi t.
Bernard Baruch, Businessman
49657_02_ch02_p062-113.indd Sec13:9749657_02_ch02_p062-113.indd Sec13:97 12/24/09 12:13:42 AM12/24/09 12:13:42 AM
98 Chapter 2 Modeling a Business
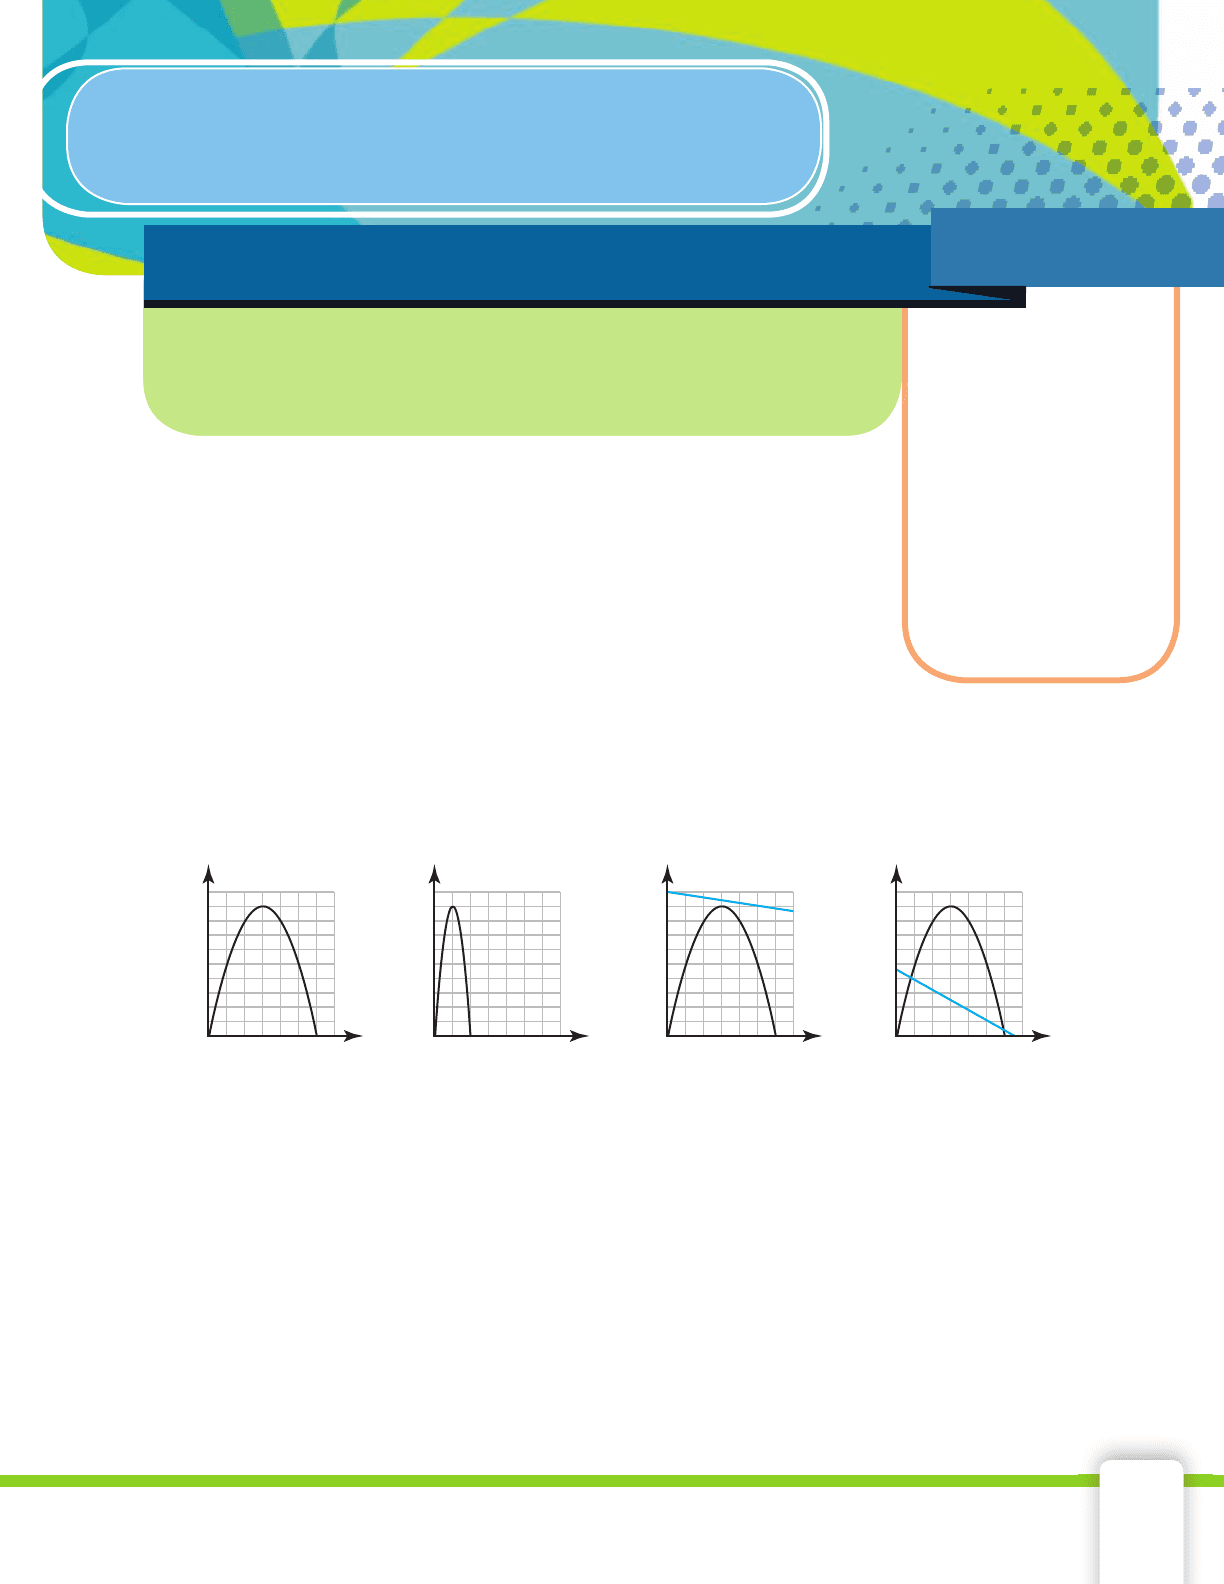
Graphically, profi t is the vertical
distance between the revenue and
expense functions. In Figure E, the
top of the vertical line segment (in
purple) hits the revenue graph at
$437,500 when the price is about $25.
The bottom of the vertical line
segment hits the expense graph at
$150,500 at the same price. The verti-
cal length of this segment is
437,500 – 150,500 = 287,000 and is
the profi t the company makes when
price is about $25.
P = R – E where P is profi t,
R is revenue, and E is
expenses
In Figure F, several profi t line
segments have been drawn for
different prices. The longest seg-
ment would represent the great-
est difference between revenue
and expense at a given price.
The greatest difference between
revenue and expense denotes
maximum profi t.
It is diffi cult to make a visual
determination as to where the
maximum profi t line might be
drawn. Algebra and graphing
must be used to make a more pre-
cise determination.
500,000
70
price
dollars
0
Figure E
500,000
70
price
dollars
0
Figure F
© MARCIN BALCERZAK 2009/USED UNDER LICENSE FROM SHUTTERSTOCK.COM
49657_02_ch02_p062-113.indd Sec13:9849657_02_ch02_p062-113.indd Sec13:98 12/24/09 12:13:43 AM12/24/09 12:13:43 AM
2-7 The Profit Equation 99
The revenue and expense functions are both functions of price, p, so, you
can create a profi t function in terms of p.
EXAMPLE 1
Determine the profi t equation for the Picasso Paints product in
Lesson 2-5. The revenue and expense functions were
R = –500p
2
+ 30,000p
E = –3,500p + 238,000
SOLUTION Profi t is the difference between revenue and expense.
P = R – E
Substitute for R and E. P = –500p
2
+ 30,000p – (–3,500p + 238,000)
Distribute. P = –500p
2
+ 30,000p + 3,500p – 238,000
Combine like terms. P = –500p
2
+ 33,500p – 238,000
The profi t equation is P = –500p
2
+ 33,500p – 238,000. It is a down-
ward parabola because the leading coeffi cient is negative.
CHECK
■
YOUR UNDERSTANDING
Suppose that the revenue and expense functions are
R = –350p
2
+ 18,000p and E = –1,500p + 199,000. Write the profi t
equation.
EXAMPLE 2
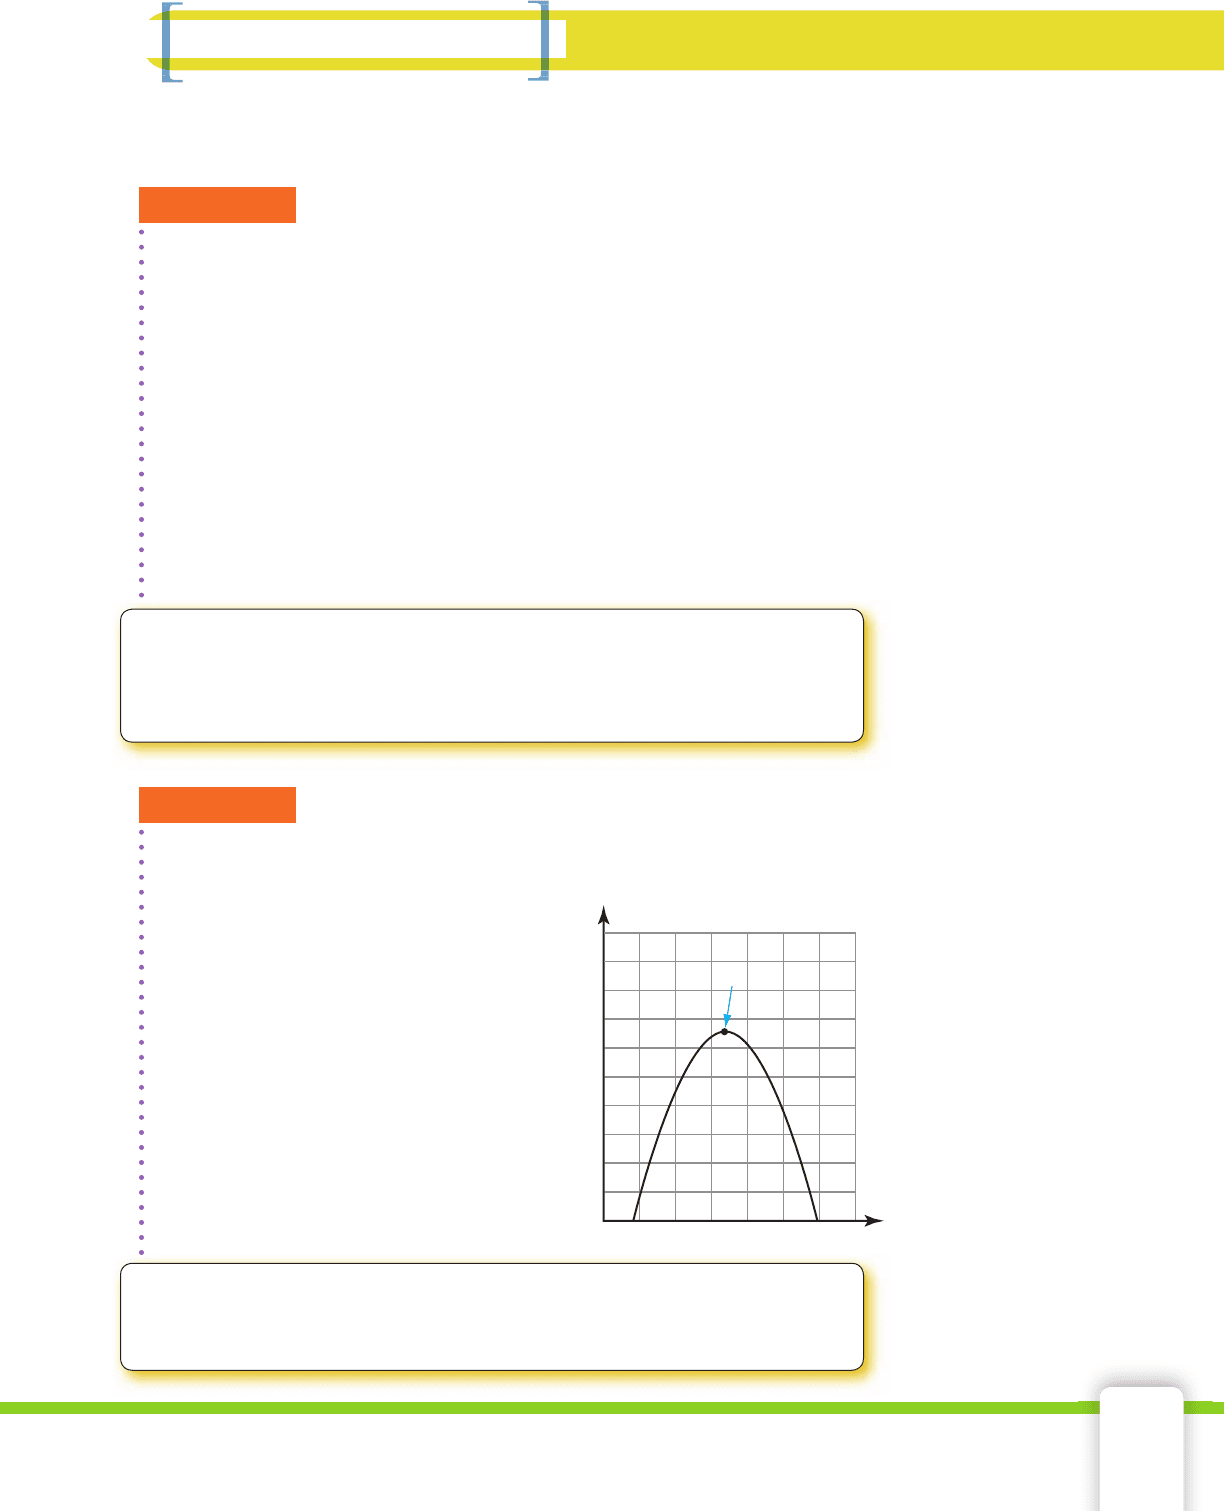
Use a graphing calculator to draw the graph of the profi t equation
from Example 1. What is the maximum profi t?
SOLUTION Enter the profi t equation
P = –500p
2
+33,500p – 238,000
into a graphing calculator. Use the
same viewing window you used
for the graphs of the revenue and
expense functions in Lesson 2-5.
The maximum profi t is at the
vertex of the parabola. Graphing
calculators have a maximum
feature that determines the value
of the maximum point of a
function. Let x represent the price,
p. The maximum is 323,125 when
x = 33.50.
CHECK
■
YOUR UNDERSTANDING
Sketch the graph. Identify the points where zero profi t is made.
Explain your reasoning.
Skills and Strategies
500,000
70
price
dollars
0
Maximum prot
49657_02_ch02_p062-113.indd Sec13:9949657_02_ch02_p062-113.indd Sec13:99 12/24/09 12:13:44 AM12/24/09 12:13:44 AM
100 Chapter 2 Modeling a Business
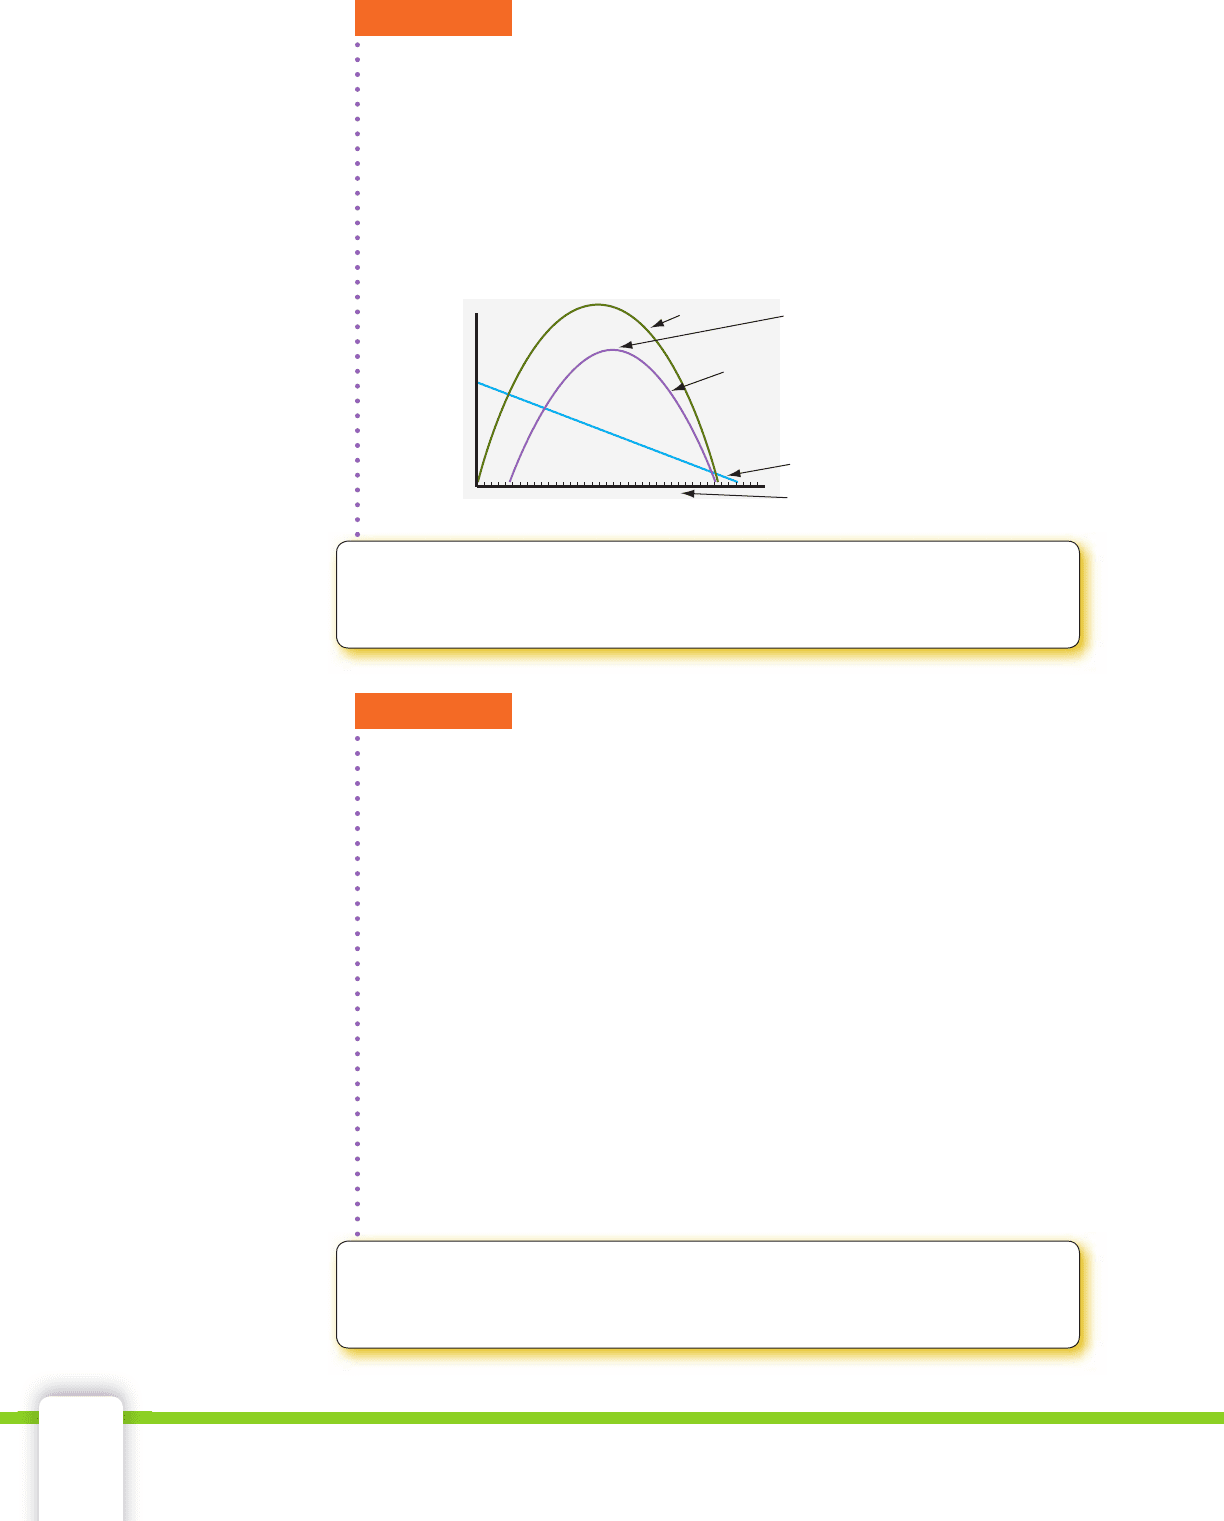
EXAMPLE 3
Graph the revenue, expense, and profi t functions on the same coordi-
nate plane. Interpret the zero-profi t points, the maximum profi t, and
how the functions relate to each other.
SOLUTION The maximum profi t is at the vertex of the profi t graph.
The price at this point yields the greatest difference between the rev-
enue and expense functions. There are two zero-profi t points on the
graph of the profi t function. No profi t is made at the selling price
where expense is equal to revenue. Visually, this is the price at which
the revenue and expense functions intersect.
Expenses
Revenue
Prot
Zero
prot
Maximum
prot
CHECK
■
YOUR UNDERSTANDING
Must maximum profi t occur at the same price as the maximum
revenue?
EXAMPLE 4
Algebraically, determine the price of the Picasso Paints product that
yields the maximum profi t.
SOLUTION To determine the maximum profi t algebraically, recall
that the maximum value occurs on the axis of symmetry. For the profi t
function P = –500x
2
+ 33,500x – 238,000, a = –500, b = 33,500, and
c =–238,000. The x- intercept of the axis of symmetry is determined
by calculating
– b
___
2a
.
–b
___
2a
=
–33,500
________
2 (–500)
=
–33,500
________
–1,000
= 33.5
The axis of symmetry intercepts the horizontal axis at 33.5. To determine
the height of the parabola at 33.5, evaluate the function when p = 33.5.
Quadratic equation P = –500p
2
+ 33,500p – 238,000
Substitute 33.5 for p. P = –500(33.5)
2
+ 33,500(33.5) – 238,000
Simplify. P = 323,125
At $33.50, a maximum profi t of $323,125 is attained.
CHECK
■
YOUR UNDERSTANDING
Use the profi t function from Example 1 Check Your Understanding.
Determine the price to the nearest cent that yields the maximum profi t.
49657_02_ch02_p062-113.indd Sec13:10049657_02_ch02_p062-113.indd Sec13:100 12/24/09 12:13:45 AM12/24/09 12:13:45 AM
2-7 The Profit Equation 101
1. How might the quote apply to what has been outlined in this lesson?
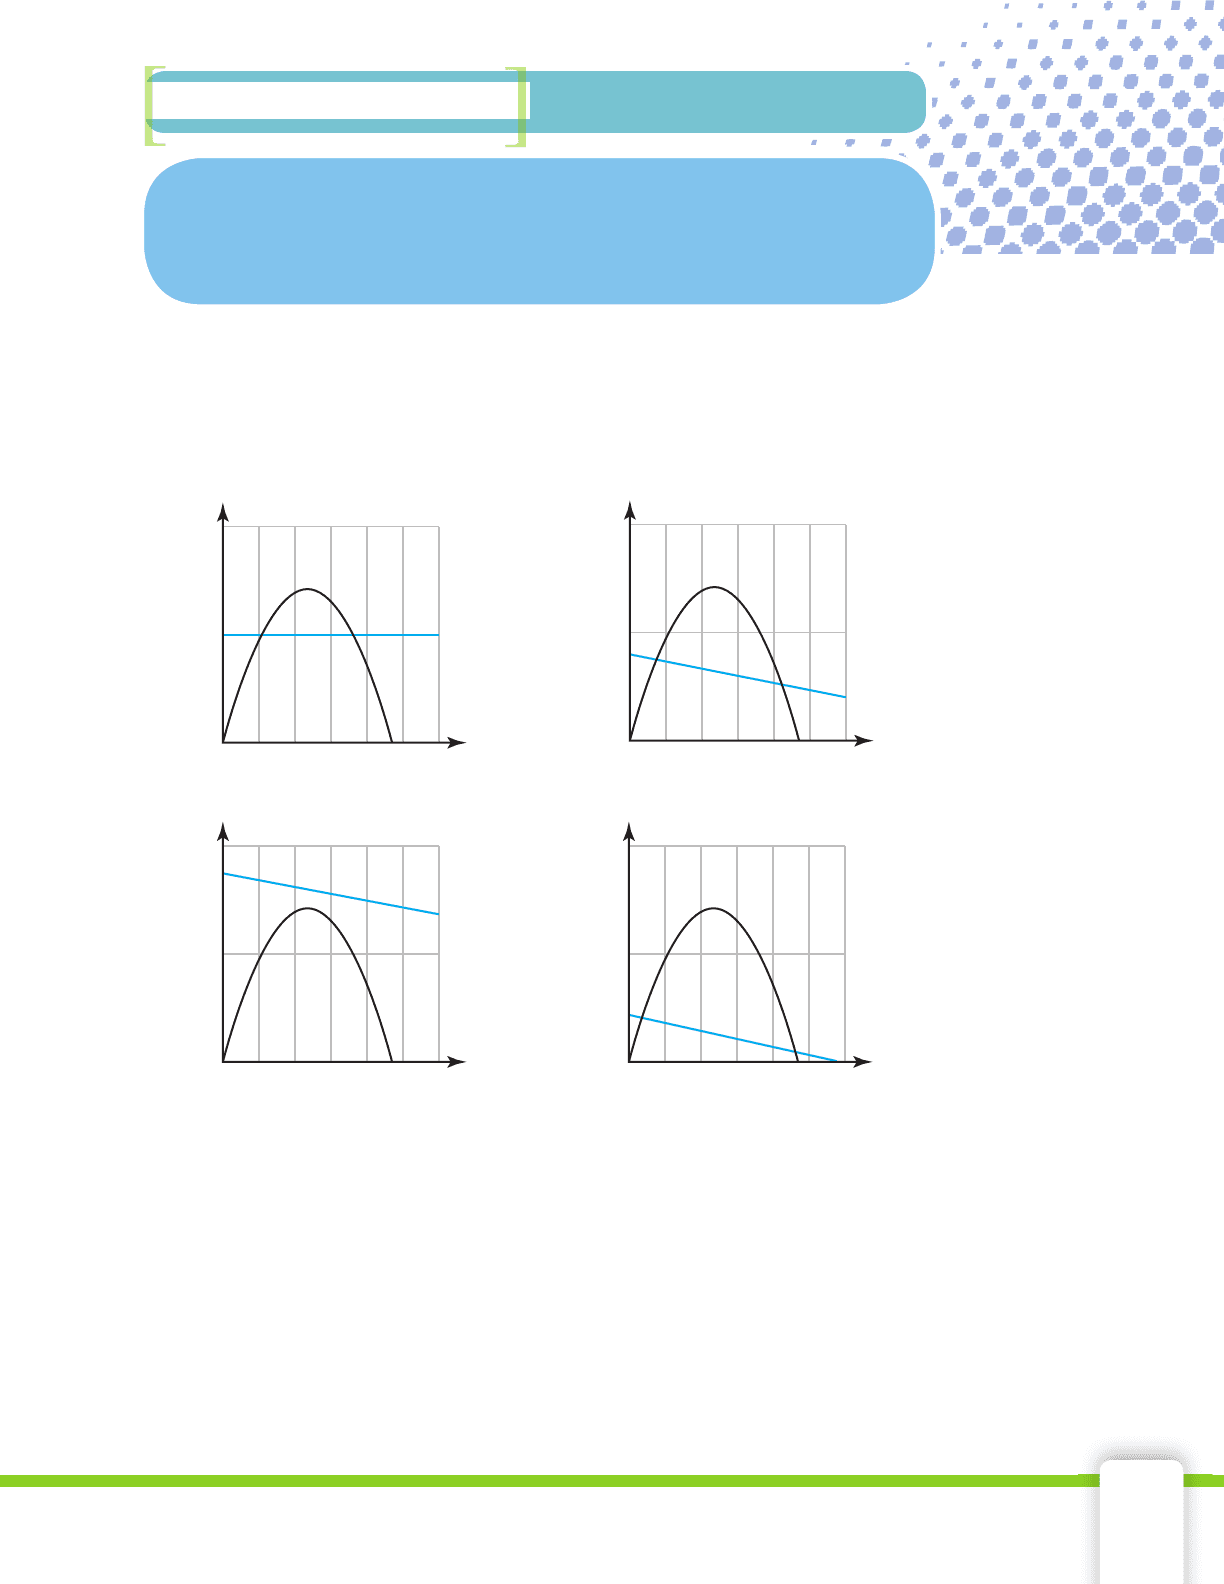
Examine each of the graphs in Exercises 2–5. In each case, the
blue graph represents the expense function and the black graph
represents the revenue function. Describe the profi t situation in
terms of the expense and revenue functions.
2. 3.
In Exercises 6–9, write the profi t function for the given expense
and revenue functions.
6. E = –20,000p + 90,000
R = –2,170p
2
+ 87,000p
7. E = –6,500p + 300,000
R = –720p
2
+ 19,000p
8. E = –2,500p + 80,000
R = –330p
2
+ 9,000p
9. E = –12,500p + 78,000
R = –1,450p
2
+ 55,000p
Nobody ever lost money taking a profi t.
Bernard Baruch, Businessman
Applications
$100,000
100
price
dollars
0
$100,000
100
price
dollars
0
$100,000
100
price
dollars
0
$100,000
100
price
dollars
0
4.
5.
49657_02_ch02_p062-113.indd Sec13:10149657_02_ch02_p062-113.indd Sec13:101 12/24/09 12:13:45 AM12/24/09 12:13:45 AM
102 Chapter 2 Modeling a Business
800,000
50
price
dollars
0
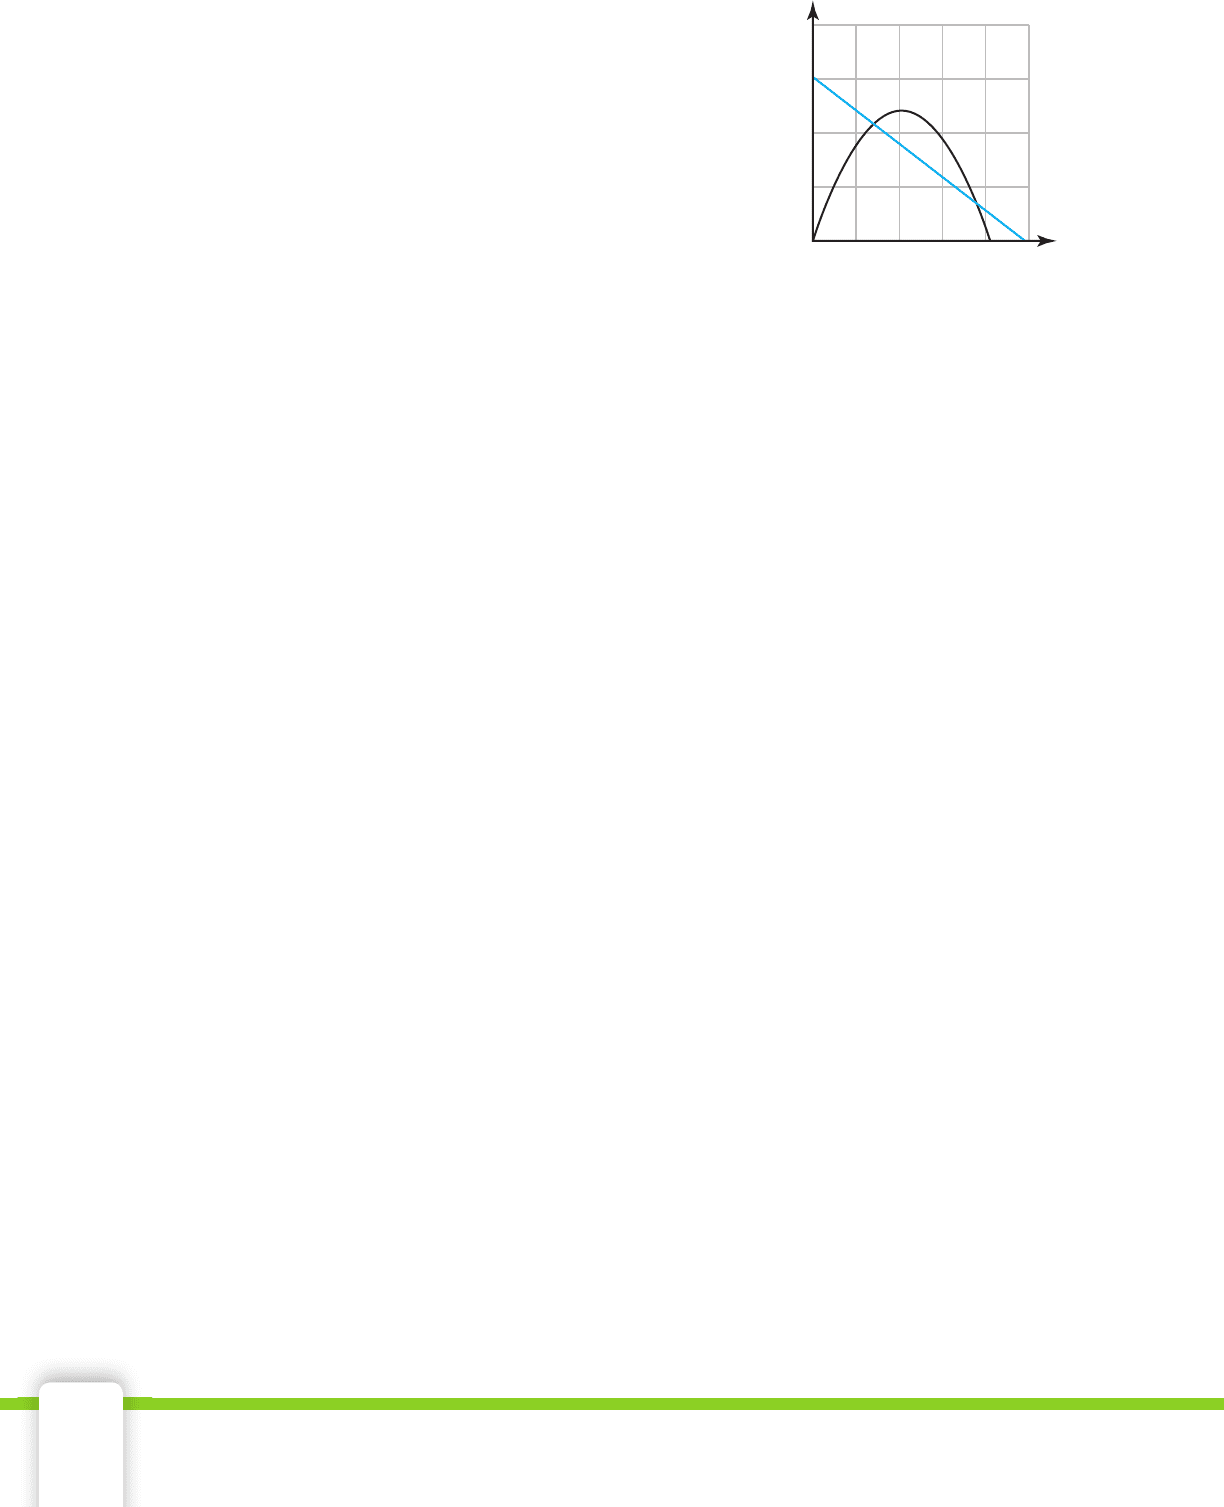
10. Examine the revenue (black)
and expense (blue) func-
tions. Estimate the price at the
maximum profi t. Explain your
reasoning.
11. The expense and revenue func-
tions yield a profi t function,
but the equation can represent
no profi t made for any price.
One of the profi t functions in
Exercises 6–9 models such a
situation.
a. Determine which profi t function models a no profi t situation.
b. What does a profi t function look like when no profi t can
be made?
12. Determine the maximum profi t and the price that would yield the
maximum profi t for each.
a. P = –400p
2
+ 12,400p – 50,000
b. P = –370p
2
+ 8,800p – 25,000
c. P = –170p
2
+ 88,800p – 55,000
13. Greenyard’s manufactures and sells yard furniture made out of recy-
cled materials. It is considering making a lawn chair from recycled
aluminum and fabric products. The expense and revenue functions
are E = –1,850p + 800,000 and R = –100p
2
+ 20,000p.
a. Determine the profi t function.
b. Determine the price, to the nearest cent, that yields the maxi-
mum profi t.
c. Determine the maximum profi t, to the nearest cent.
14. Mountaineer Products Incorporated manufactures mountain-bike
accessories. It is considering making a new type of refl ector for night
biking. The expense and revenue functions are E = –450p + 90,000
and R = –185p
2
+ 9,000p.
a. Determine the profi t function.
b. Determine the price, to the nearest cent, that yields the maxi-
mum profi t.
c. Determine the maximum profi t, to the nearest cent.
15. Business Bargains manufactures offi ce supplies. It is considering sell-
ing sticky-notes in the shape of the state in which they will be sold.
The expense and revenue functions are E = –250p + 50,000 and
R = –225p
2
+ 7,200p.
a. Determine the profi t function.
b. Determine the price, to the nearest cent, that yields the maxi-
mum profi t.
c. Determine the maximum profi t, to the nearest cent.
16. FlipFlops manufactures beach sandals. Their expense and revenue
functions are E = –300p + 32,000 and R = –275p
2
+ 6,500p.
a. Determine the profi t function.
b. Determine the price, to the nearest cent, that yields the maxi-
mum profi t.
c. Determine the maximum profi t, to the nearest cent.
49657_02_ch02_p062-113.indd Sec13:10249657_02_ch02_p062-113.indd Sec13:102 12/24/09 12:13:46 AM12/24/09 12:13:46 AM

2-8 Mathematically Modeling a Business 103
How can you mathematically
model a start-up business?
Statistics are necessary in making business decisions. The relation-
ship between supply and demand; expense, revenue, and profi t; and
breakeven points must be analyzed. All of the factors may be modeled
together to assess business situations.
Dependence is used in many contexts.
In sports, baseball fans
• depend on the manager of the team to lead
the team to victory. In turn, the manager of the team depends on the
players to work hard to succeed.
In politics, voters
• depend on their local elected offi cials to represent
them. Local elected offi cials depend on state government offi cials to
give them the support they need to represent the voters.
When starting a business venture, expenses
• depend on the
demanded quantity of the product. Demand depends on the price of
the product.
These are a few examples of dependence in daily life. In the fi rst
example, if the fans depend on the manager and the manager depends
on the players, the fans depend on the players as well. In the second
example, if the voters depend on the local elected offi cials and the local
offi cials depend on the state offi cials, the voters depend upon the state
offi cials, too. Finally, in the last example, if expenses depend on quantity
and quantity depends on price, expenses also depend on price. These are
examples of the
transitive property of dependence.
If x depends on y and y depends on z, it follows that x depends on z.
The determination of the price that yields the maximum profi t
depends on a number of factors that precede it. Mathematical model-
ing using algebra is an illustration of the use of the transitive property in
business.
Key Terms
dependence•
transitive property of dependence•
Objectives
Recognize •
the transitive
property of
dependence as
it is used in a
business model.
Use multiple
•
pieces of
information,
equations, and
methodologies
to model a new
business.
Mathematically Modeling
a Business
2-8
All models are wrong. Some models are useful.
George Box, Statistician and Quality Control Pioneer
49657_02_ch02_p062-113.indd Sec13:10349657_02_ch02_p062-113.indd Sec13:103 12/24/09 12:13:47 AM12/24/09 12:13:47 AM