Everitt B.S. The Cambridge Dictionary of Statistics
Подождите немного. Документ загружается.

concept of independence and arrived at a reasonable definition. His principal work,
The
Doctrine of Chance
, which was on probability theory, was published in 1718. Just before his
death in 1754 the French Academy elected him a foreign associate of the Academy of
Science.
De Moivre^Laplace theorem: This theorem states that if x is a random variable having the
binomial distribution
with parameters n and p, then the
asymptotic distribution
of x is a
normal distribution with mean np and variance npð1 pÞ. See also normal approximation.
[KA1 Chapter 5.]
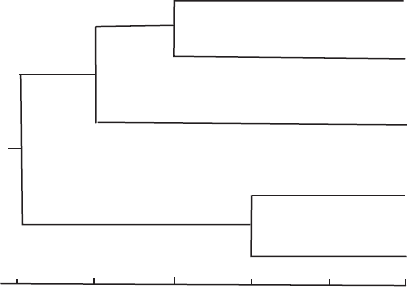
Dend rogra m: A term usually encountered in the application of
agglomerative hierarchical clustering
methods
, where it refers to the ‘tree-like’ diagram illustrating the series of steps taken by the
method in proceeding from n single member ‘clusters’ to a single group containing all n
individuals. The example shown (Fig. 51) arises from applying
single linkage clustering
to
the following matrix of
Euclidean distances
between five points:
D ¼
0:0
2:00:0
6:05:00:0
10:09:04:00:0
9:08:05:03:00:0
0
B
B
B
B
@
1
C
C
C
C
A
[MV1 Chapter 1.]
Density esti mati o n: Procedures for estimating probability distributions without assuming any
particular functional form. Constructing a histogram is perhaps the simplest example of
such estimation, and
kernel density estimators
provide a more sophisticated approach.
Density estimates can give valuable indication of such features as
skewness
and
multi-
modality
in the data. [Density Estimation in Statistics and Data Analysis, 1986, B.W.
Silverman, Chapman and Hall/CRC Press, London.]
Density funct i on: See probability density.
Density rati o model: A semiparametric model for testing the relative treatment effect between two
populations based on a random sample from each. The model specifies that the
log-likelihood of the ratio of two unknown densities is linear in some parameters.
[Statistical Modelling, 2007, 7, 155 –173.]
5.0 4.0 3.0
Distance (d )
2.0 1.0 0
1
2
3
4
5
Fig. 51 A dendrogram for the
example matrix.
129
Density sampling: A method of sampling controls in a
case-control study
which can reduce
bias
from changes in the prevalence of exposure during the course of a study. Controls are
samples from the population at risk at the times of incidence of each case. [American Journal
of Epidemiology, 1976, 103, 226–35.]
Dentonmethod: Awidely used method for
benchmarking
a
time series
to annual benchmarks while
preserving as far as possible the month-to-month movement of the original series.
[International Statistical Review, 1994, 62 365–77.]
Dependent va r iab l e: See response variable.
Depr ivat i o n i nd ices: Socioeconomic indices constructed from variables such as social class or
housing tenure and used in an examination of the relationship between deprivation and ill-
health. [Journal of Epidemiology and Community Health, 1995, 49,S3–S8.]
Descriptive statistics: A general term for methods of summarizing and tabulating data that make
their main features more transparent. For example, calculating means and variances and
plotting histograms. See also exploratory data analysis and initial data analysis.
Desig n-based i nf erence: Statistical inference for parameters of a finite population where varia-
bility is due to hypothetical replications of the sampling design, which is sometimes
complex (see complex survey data). Often contrasted to
model-based inference
.
[Canadian Journal of Forest Research, 1998, 88, 1429–1447.]
Desig n effect: The ratio of the variance of an estimator under the particular sampling design used in
a study to its variance at equivalent sample size under simple random sampling without
replacement. [Survey Sampling, 1995, L. Kish, Wiley, New York.]
Desig n mat rix: Used generally for a matrix that specifies a statistical model for a set of observations.
For example, in a
one-way design
with three observations in one group, two observations in
a second group and a single observation in the third group, and where the model is
y
ij
¼ þ α
i
þ
ij
the design matrix, X is
X ¼
1100
1100
1100
1010
1010
1001
0
B
B
B
B
B
B
@
1
C
C
C
C
C
C
A
Using this matrix the model for all the observations can be conveniently expressed in matrix
form as
y ¼ Xβ þ
’
where y
0
¼½y
11
; y
12
; y
13
; y
21
; y
22
; y
31
, β
0
¼½; α
1
; α
2
; α
3
and
’
0
¼½
11
;
12
;
13
;
21
;
22
;
31
.
Also used specifically for the matrix X in designed industrial experiments which specify the
chosen values of the explanatory variables; these are often selected using one or other
criteria
of optimatily
.Seealsomultiple regression.
Design regi ons: Regions relevant to an experiment which are defined by specification of intervals
of interest on the explanatory variables. For quantitative variables the most common region
is that corresponding to lower and upper limits for the explanatory variables, which depend
upon the physical limitations of the system and upon the range of values thought by the
130
experimenter to be of interest. [Journal of the Royal Statistical Society, Series B, 1996, 58,
59–76.]
Desi g n r ota ta b ility: A term used in applications of
response surface methodology
for the require-
ment that the quality of the derived predictor of future response values is roughly the same
throughout the region of interest. More formally a
rotatable design
is one for which
N varð^yðxÞÞ=
2
has the same value at any two locations that are the same distance from
the design centre. [Journal of the Royal Statistical Society, Series B, 1996, 58,59–76.]
Desig n set: Synonym for training set.
Detecti o n b ias: See ascertainment bias.
Detection limits: A term used to denote low-level data that cannot be distinguished from a zero
concentration. Higher limits are also used to denote data with low, nonzero concentrations
that are too imprecise to report as distinct numbers. See also low-dose extrapolation.
[Environmental Science and Technology, 1988, 22, 856–861.]
Determ i n ant: A value associated with a
square matrix
that represents sums and products of its
elements. For example, if the matrix is
A ¼
ab
cd
then the determinant of A (conventionally written as det (A)orjAj) is given by
ad bc
Dete rmin istic model: One that contains no random or probabilistic elements. See also random
model.
DETMAX: An algorithm for constructing exact
D-optimal designs
.[Technometrics, 1980, 22, 301–13.]
Det rending: A term used in the analysis of
time series
data for the process of calculating a
trend
in
some way and then subtracting the trend values from those of the original series. Often
needed to achieve
stationarity
before fitting models to times series. See also differencing.
[Journal of Applied Economics, 2003, 18, 271–89.]
Devia nce: A measure of the extent to which a particular model differs from the
saturated model
for a
data set. Defined explicitly in terms of the
likelihoods
of the two models as
D ¼2½ln L
c
ln L
s
where L
c
and L
s
are the likelihoods of the current model and the saturated model, respec-
tively. Large values of d are encountered when L
c
is small relative to L
s
, indicating that the
current model is a poor one. Small values of d are obtained in the reverse case. The deviance
has asymptotically a
chi-squared distribution
with degrees of freedom equal to the difference
in the number of parameters in the two models when the current model is correct. See also
G
2
and likelihood ratio. [GLM Chapter 2.]
Dev ia nce info rmat ioncr ite r ion ( D IC ) : A goodness of fit measure similar to
Akaike’s informa-
tion criterion
which arises from consideration of the posterior expectation of the
deviance
as
a measure of fit and the effective number of parameters as a measure of complexity. Widely
used for comparing models in a Bayesian framework. [Journal of Business and Economic
Statistics, 2004, 22, 107–20.]
131

Deviance resid ua ls: The signed square root of an observation’s contribution to total model
devi-
ance
.[Ordinal Data Modelling, 1999, V.E. Johnson and J.H. Albert, Springer, New York.]
Deviate: The value of a variable measured from some standard point of location, usually the mean.
DeWitt, Johan (1625^1672): Born in Dordrecht, Holland, DeWitt entered Leiden University at
the age of 16 to study law. Contributed to actuarial science and economic statistics before
becoming the most prominent Dutch statesman of the third quarter of the seventeenth
century. DeWitt died in The Hague on 20 August 1672.
DF(df): Abbreviation for degrees of freedom.
DFBE TA: An
influence statistic
which measures the impact of a particular observation, i, on a specific
estimated regression coefficient,
^
β
j
,ina
multiple regression
. The statistic is the standardized
change in
^
β
j
when the ith observation is deleted from the analysis; it is defined explicitly as
DFBETA
jðiÞ
¼
^
β
j
^
β
jðiÞ
s
ðiÞ
ffiffiffi
c
p
j
where s
ðiÞ
is the residual mean square obtained from the regression analysis with observa-
tion i omitted, and c
j
is the ðj þ1Þth diagonal element of ðX
0
XÞ
1
with X being the matrix
appearing in the usual formulation of this type of analysis. See also Cook’s distance,
DFFITS and COVRATIO. [ARA Chapter 10.]
DFFITS: An
influence statistic
that is closely related to
Cook’s distance
, which measures the impact of
an observation on the predicted response value of the observation obtained from a
multiple
regression
.Defined explicitly as;
DFFITS
i
¼
^
y
i
^
y
iðiÞ
s
ðiÞ
ffiffiffi
h
p
i
where ^y
i
is the predicted response value for the ith observation obtained in the usual way and
^
y
ðiÞ
is the corresponding value obtained when observation i is not used in estimating the
regression coefficients; s
2
ðiÞ
is the residual mean square obtained from the regression
analysis performed with the ith observation omitted. The relationship of this statistic to
Cook’s distance, D
i
,is
D
i
¼ðDFFITS
i
Þ
2
s
2
ðiÞ
trðHÞs
2
where H is the
hat matrix
with diagonal elements h
i
and s
2
is the residual sum of squares
obtained from the regression analysis including all observations. Absolute values of the
statistic larger than 2
ffiffiffiffiffiffiffiffiffiffiffiffiffiffiffiffi
trðH=nÞ
p
indicate those observations that give most cause for concern.
[SMR Chapter 9.]
DG M: Abbreviation for data generating mechanism.
Diagnostic key: A sequence of binary or polytomous tests applied sequentially in order to indentify
the population of origin of a specimen. [Biometrika, 1975, 62, 665–72.]
Diagnostics: Procedures for indentifying departures from assumptions when fitting statistical mod-
els. See, for example, DFBETA and DFFITS.[Residuals and Influence in Regression,
1994, R.D. Cook and S. Weisberg, Chapman and Hall/CRC Press, London.]
Diagnostic tests: Procedures used in clinical medicine and also in
epidemiology
, to screen for the
presence or absence of a disease. In the simplest case the test will result in a positive (disease
132
likely) or negative (disease unlikely) finding. Ideally, all those with the disease should be
classified by the test as positive and all those without the disease as negative. Two indices of
the performance of a test which measure how often such correct classifications occur are its
sensitivity
and
specificity
. See also believe the positive rule, positive predictive value and
negative predictive value. [SMR Chapter 14.]
Diagonal matrix: A
square matrix
whose off-diagonal elements are all zero. For example,
D ¼
10 0 0
050
003
0
@
1
A
Diary survey: A form of data collection in which respondents are asked to write information at regular
intervals or soon after a particular event has occurred. [Lancet,2008,37, 1519–1525.]
DIC: Abbreviation for deviance information criterion.
Dichotomous variable: Synonym for binary variable.
D ick ey -F u l l er test: Synonym for unit-root test.
Dieulefait, Carlos Eugenio (19 01^1982): Born in Buenos Aires, Dieulefait graduated from
the Universidad del Litoral in 1922. In 1930 he became first director of the Institute of
Statistics established by the University of Buenos Aires. For the next 30 years, Dieulefait
successfully developed statistics in Argentina while also making his own contributions to
areas such as correlation theory and
multivariate analysis
. He died on 3 November 1982 in
Rosario, Argentina.
Differences-in-differences estimator: An estimator of group by period interaction in a
study in which subjects in two different groups are observed in two different periods.
Typically one of the groups is a control group and the other group is given the treatment
in the second period but not in the first. The differences-in-differences estimator of the
causal effect of treatment is simply the difference in period means for the second group
minus the difference in the period means for the first group. The differences-in-differences
estimator is attractive because it can be viewed as resulting from sweeping out both
subject-specific intercepts and period-specific intercepts from a model including such
terms. It is a standard approach to program evaluation in economics. [Review of
Economic Studies, 2005, 72,1–19.]
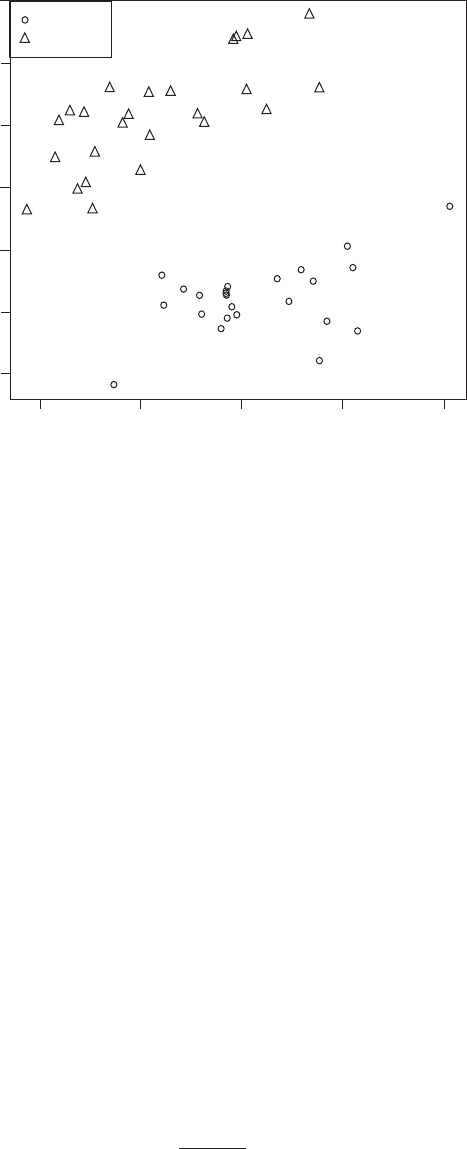
Differencesvs totals plot: A graphical procedure most often used in the analysis of data from
a
two-by-two crossover design
. For each subject the difference between the response
variable values on each treatment are plotted against the total of the two treatment
values. The two groups corresponding to the order in which the treatments were given
are differentiated on the plot by different plotting symbols. A large shift between the
groups in the horizontal direction implies a differential
carryover effect
. If this shift is
small, then the shift between the groups in a vertical direction is a measure of the
treatment effect. An example of this type of plot appears in Fig. 52.[The Statistical
Consultant in Action, 1987, edited by D.J. Hand and B.S. Everitt, Cambridge University
Press, Cambridge.]
Differencing: A simple approach to removing trends in
time series
. The first difference of a time
series, fy
t
g,isdefined as the transformation
133
Dy
t
¼ y
t
y
t1
Higher-order differences are defined by repeated application. So, for example, the second
difference, D
2
y
t
, is given by
D
2
y
t
¼ DðDy
t
Þ¼Dy
t
Dy
t1
¼ y
t
2y
t1
þ y
t2
Frequently used in applications to achieve a
stationarity
before fitting models. See also
backward shift operator and autoregressive integrated moving average models.
D iggl e ^ K enw ar d model fo r dro pouts: A model applicable to
longitudinal data
in which the
dropout process may give rise to
informative missing values
. Specifically if the study
protocol specifies a common set of n measurement times for all subjects, and d is used to
represent the subject’s dropout time, with D ¼ d if the values corresponding to times
d; d þ 1; ...; n are missing and D ¼ n þ 1 indicating that the subject did not drop out,
then a statistical model involves the joint distribution of the observations y and d. This joint
distribution can be written in two equivalent ways,
f ðy; dÞ¼f ðyÞgðdjyÞ
¼ gðdÞf ðyjdÞ
Models derived from the first factorization are known as
selection models
and those derived
from the second factorisation are called
pattern mixture models
. The Diggle–Kenward
model is an example of the former which specifies a
multivariate normal distribution
for f
(y) and a
logistic regression
for gðdjyÞ. Explicitly if p
t
ðyÞdenotes the
conditional probability
of dropout at time t, given Y ¼ y then,
ln
p
t
ðyÞ
1 p
t
ðyÞ
¼ α
0
y
t
þ
X
r
k¼1
α
k
y
tk
10987
Difference
654
Sum
AB group
BA group
1210 14 16 18
Fig. 52 An example of a difference versus total plot.
134
When the dropout mechanism is informative the probability of dropout at time t can depend
on the unobserved y
t
. See also missing values and selection models.[Analysis of
Longitudinal Data, 2nd edition, 2002, P. J. Diggle, P. J. Heagerty, K.-Y. Liang and
S. L. Zeger, Oxford Science Publications, Oxford.]
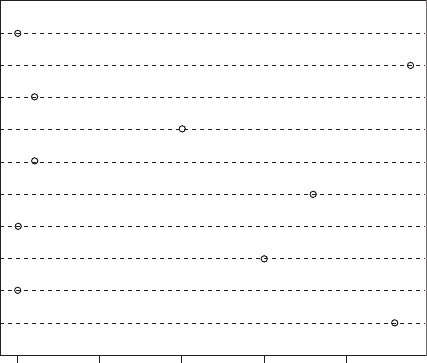
Digit preference: The personal and often subconscious bias that frequently occurs in the recording
of observations. Usually most obvious in the final recorded digit of a measurement.
Figure 53 illustrates the phenomenon. [SMR Chapter 7.]
Digraph: Synonym for directed graph.
DIP test: A test for multimodality in a sample, based on the maximum difference, over all sample
points, between the empirical distribution function and the unimodal distribution function
that minimizes that maximum difference. [MV2 Chapter 10.]
D irected acyc l i c gra p h: Formal graphical representation of “causal diagrams” or “path diagrams”
where relationships are directed (causal order specified for all relations) but acyclic (no
feedback relations allowed). Plays an important role in effectively conveying an assumed
causal model and determining which variables that should be controlled for in estimation of
causal effects. See also graph theory.[Journal of Epidemiology and Community Health,
2008, 62, 842–846.]
Directed deviance: Synonymous with signed root transformation.
Directed graph: See graph theory.
Directional data: Data where the observations are directions, points on the circumference of a circle
in two dimensions (
circular data
) or on the surface of a sphere in three dimensions (
spherical
variable
). In general directions may be visualized as points on the surface of a hypersphere.
[Multivariate Analysis, 1979, K.V. Mardia, J. T. Kent and J. M. Bibby, Academic, New
York.]
Directio n al ne ig h bo urhoods a p proa c h ( DNA ): A method for classifying pixels and recon-
structing images from remotely sensed noisy data. The approach is partly Bayesian and
9
8
7
6
5
4
3
2
1
0
0
510
Frequency
15
20
Fig. 53 Digit preference
among different groups of
observers. For zero, even,
odd and five numerals.
135

partly data analytic and uses observational data to select an optimal, generally asymmetric,
but relatively homogeneous neighbourhood for classifying pixels. The procedure involves
two stages: a zero-neighbourhood pre-classification stage, followed by selection of the most
homogeneous neighbourhood and then a final classification.
D i rect matri x pr oduct: Synonym for Kronecker product.
Direct standardization: The process of adjusting a crude mortality or morbidity rate estimate for
one or more variables, by using a known
reference population
. It might, for example, be
required to compare cancer mortality rates of single and married women with adjustment
being made for the age distribution of the two groups, which is very likely to differ with the
married women being older.
Age-specific mortality rates
derived from each of the two
groups would be applied to the population age distribution to yield mortality rates that could
be directly compared. See also indirect standardization.[Statistics in Medicine, 1993, 12,
3–12.]
Dirichlet distribution: The multivariate version of the
beta distribution
. Given by
f ðx
1
; x
2
; ...; x
q
Þ¼
Gð
1
þþ
q
Þ
Gð
1
ÞGð
q
Þ
x
1
1
1
x
q
1
q
where
0 x
i
5
1;
X
q
i¼1
x
i
¼ 1;
i
4
0;
X
q
i¼1
i
¼
0
The expected value of x
i
is
i
=
0
and its variance is
i
ð
0
i
Þ
2
0
ð
0
þ 1Þ
The covariance of x
i
and x
j
is
i
j
2
0
ð
0
þ 1Þ
[STD Chapter 10.]
Dirichlet process: A distribution over distributions in the sense that each draw from the process is
itself a distribution. The name Dirichlet process is due to the fact that the finite dimensional
marginal distributions of the process follows the
Dirichlet distribution
. Commonly used as a
prior distribution
in
nonparametric Bayesian models
, particularly in
Dirichlet process
mixture models
. Called nonparametric because, although the distributions drawn from a
Dirichlet process are discrete, they cannot be described using a finite number of parameters.
The prior distribution induced by a Dirichlet process can be generated incrementally using
the
Chinese restaurant process
. See also Pitman-Yor process.[Annals of Statistics, 1973, 1,
209–230.]
Dirichlet process mixture models: A nonparametric
Bayesian inference
approach to using
finite mixture distributions
for modelling data suspected of containing distinct groups of
observations; this approach does not require the number of mixture components to be known
in advance. The basic idea is that the
Dirichlet process
induces a
prior distribution
over
partitions of the data which can then be combined with a prior distribution over parameters
and likelihood. The distribution over partitions can be generated incrementally using the
Chinese restaurant process
.[Annals of Statistics, 1974, 2, 1152–1174.]
136
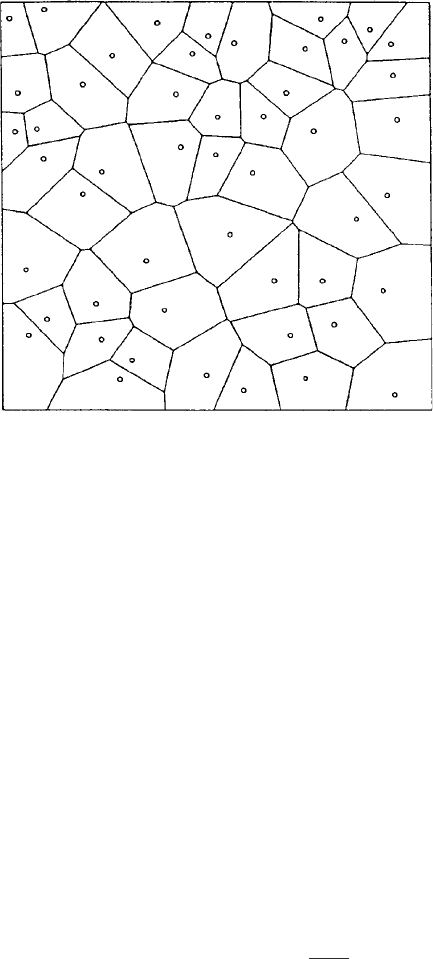
Dirichlet tessellation: A construction for events that occur in some planar region a, consisting of a
series of ‘territories’ each of which consists of that part of a closer to a particular event x
i
than
to any other event x
j
. An example is shown in Fig. 54.[Pattern Recognition and Neural
Networks, 1996, B.D. Ripley, Cambridge University Press, Cambridge.]
Disability adjusted life years (DALYs): An attempt to measure the suffering caused by an
illness, that takes into account both the years of potential life lost due to premature mortality
as well as the years lost due to a disease or health condition. One DALY represents the
equivalent of the loss of one year of full health. Useful in comparisons across diseases and in
setting national and international health priorities. See also healthy life expectancy.
[Journal of Health Economics, 1997, 16, 685–702.]
Disclosure risk: The risk of being able to identify a respondent’s confidential information in a data
set. Several approaches have been proposed to measure the disclosure risk some of which
concentrate on the risk per individual record and others of which involve a global measure
for the entire data file. See also data intrusion simulation.[Statistics and Computing, 2003,
13, 343–354.]
Discreterectangulardistribution: A probability distribution for which any one of a finite set of
equally spaced values is equally likely. The distribution is given by
PrðX ¼ a þ jhÞ¼
1
n þ 1
j ¼ 0; 1; ...; n
so that the random variable x can take any one of the equally spaced values
a; a þ h; ...; a þ nh.Asn !1and h ! 0, with nh ¼ b a the distribution tends to a
uniform distribution
over ða; bÞ. The
standard discrete rectangular distribution
has a ¼ 0 and
h ¼ 1=n so that x takes values 0; 1=n; 2=n; ...; 1. [Univariate Discrete Distributions, 3rd
edn, 2005, N. L. Johnson, A. W. Kemp and S. Kotz, Wiley, New York.]
Discrete time Markov chain: See Markov chain.
Discrete time stochastic process : See stochastic process.
Fig. 54 An example of
Dirichlet tessellation.
137
Discrete uniform distribution: A probability distribution for a discrete random variable that
takes on k distinct values x
1
; x
2
; ...; x
k
with equal probabilities where k is a positive integer.
See also lattice distributions.[A Primer on Statistical Distributions, 2003, N. Balakrishnan
and V.B. Neizorow, Wiley, New York.]
Discrete variabl es: Variables having only integer values, for example, number of births, number of
pregnancies, number of teeth extracted, etc. [SMR Chapter 2.]
Discrete wavelet transfo rm (DWT ): The calculation of the coefficients of the
wavelet series
approximation
for a discrete signal f
1
; f
2
; ...; f
n
of finite extent. Essentially maps the vector
f
0
¼½f
1
; f
2
; ...; f
n
to a vector of n
wavelet transform coefficients
.[IEEE Transactions on
Pattern Analysis and Machine Intelligence, 1989, 11, 674–93.]
Discriminant analysis: A term that covers a large number of techniques for the analysis of multi-
variate data that have in common the aim to assess whether or not a set of variables
distinguish or discriminate between two (or more) groups of individuals. In medicine, for
example, such methods are generally applied to the problem of using optimally the results
from a number of tests or the observations of a number of symptoms to make a diagnosis that
can only be confirmed perhaps by post-mortem examination. In the two group case the most
commonly used method is
Fisher’s linear discriminant function
, in which a linear function of
the variables giving maximal separation between the groups is determined. This results in a
classification rule
(often also known as an
allocation rule
) that may be used to assign a new
patient to one of the two groups. The derivation of this linear function assumes that the
variance–covariance matrices
of the two groups are the same. If they are not then a
quadratic
discriminant function
may be necessary to distinguish between the groups. Such a function
contains powers and cross-products of variables. The sample of observations from which the
discriminant function is derived is often known as the
training set
. When more than two
groups are involved (all with the same variance–covariance matrix) then it is possible to
determine several linear functions of the variables for separating them. In general the number
of such functions that can be derived is the smaller of q and g 1 where q is the number of
variables and g the number of groups. The collection of linear functions for discrimination
are known as
canonical discriminant functions
or often simply as
canonical variates
. See also
error rate estimation and regularised discriminant analysis. [MV2 Chapter 9.]
Discrimination information: Synonymous with Kullback-Leibler information.
Disease clusters: An unusual aggregation of health events, real or perceived. The events may be
grouped in a particular area or in some short period of time, or they may occur among a
certain group of people, for example, those having a particular occupation. The significance
of studying such clusters as a means of determining the origins of public health problems has
long been recognized. In 1850, for example, the Broad Street pump in London was identified
as a major source of cholera by plotting cases on a map and noting the cluster around the
well. More recently, recognition of clusters of relatively rare kinds of pneumonia and
tumours among young homosexual men led to the identification of acquired immunodefi-
ciency syndrome (AIDS) and eventually to the discovery of the human immunodeficiency
virus (HIV). See also scan statistic.[Statistics in Medicine, 1995, 14, 799–810.]
Diseasemapping: The process of displaying the geographical variability of disease on maps using
different colours, shading, etc. The idea is not new, but the advent of computers and
computer graphics has made it simpler to apply and it is now widely used in descriptive
epidemiology
, for example, to display morbidity or mortality information for an area.
Figure 55 shows an example. Such mapping may involve absolute rates, relative rates,
etc., and often the viewers impression of geographical variation in the data may vary quite
138