Citibank: basic of corporate finance
Подождите немного. Документ загружается.


2-8 FINANCIAL MARKETS AND INTEREST RATES
v-1.1 v.05/13/94
p.01/14/00
Risk
There are several types of risk that can be included in the risk
premium. Usually, it is difficult to quantify what percentage of the
risk premium is associated with each type of risk. Let's look at three
risks that affect the amount of the risk premium: counterparty risk,
liquidity risk, and interest rate risk.
Counterparty
(default) risk
Counterparty (default) risk is the chance that the borrower will not be
able to pay the interest or pay off the principal of a loan. This risk can
influence the level of interest rates. It is generally considered that
U.S. Treasury securities have no default risk –
the U.S. government will always pay interest and will repay the
principal of its borrowings. Therefore, the difference in price
between a U.S. Treasury security and another corporate bond with
similar maturity, liquidity, etc. may be the risk premium for assuming
counterparty risk.
Several ratings companies identify and classify the creditworthiness of
corporations and governments to determine how large the risk
premium should be. They apply specific ratings such as AAA or BBB
to indicate the likelihood of default by the borrowing entity.
A corporation with a AAA rating will have a smaller default risk than a
firm with a BBB rating and, therefore, will be able to borrow capital at
a lower interest rate (other factors being equal).
www.LisAri.com

FINANCIAL MARKETS AND INTEREST RATES 2-9
v.05/13/94 v-1.1
p.01/14/00
Liquidity risk
Liquidity refers to the marketability of assets – the ease with which
assets can be sold for cash on short notice at a fair price. Investors
may require a premium return on an asset to compensate for a lack of
liquidity. For example, there are active world markets in which
investors holding bonds issued by Ford Motor Company can easily
sell the bonds and receive cash within a matter of seconds. On the
other hand, an investor who has loaned money to a small Honduran
trading company will have a much more difficult time finding another
investor in the secondary market to purchase the loan.
The Honduran trading company pays a higher interest rate for its
borrowings than does Ford (all other factors being equal) because
its securities are harder to sell in the secondary market.
Interest rate
risk
As interest rates fluctuate, so do the prices of bonds in the secondary
markets. We will discuss this relationship between interest rates and
bonds in more detail later in the course. For now, you need to know
how a change in rates affects bond prices.
• As interest rates increase, bond prices
decrease.
• As interest rates decrease, bond prices
increase.
After an interest rate increase, newly issued bonds yield larger
interest payments than older bonds. The price of old bonds falls to
attractive levels so that investors will continue to buy them. Older
bonds are priced in the market so that the rate of return paid on the
investment is approximately the same as other investment
opportunities with similar risk and maturity.
All long-term bonds carry interest rate risk because there is more
opportunity for interest rates to rise. For this reason, investors often
require a risk premium in the stated interest rate. The net effect of
this premium is to raise rates on long-term bonds relative to the
rates on short-term bonds.
www.LisAri.com

2-10 FINANCIAL MARKETS AND INTEREST RATES
v-1.1 v.05/13/94
p.01/14/00
Measuring
risk premium
The risk premium is difficult to measure, but researchers have
identified two characteristics that serve as a reference:
1. Rate volatility – Premiums are higher when interest rates
are volatile and uncertain.
2. Historical data – The premium on 30-year U.S. Treasury
bonds generally has fluctuated between 1% and 2%, with an
average of about 1.7% for the last 60 years.
Short-term bonds are also subject to risk as a result of changing
interest rates. Most investors reinvest their funds as short-term
bonds mature and are paid off. If interest rates are falling, the new
bonds will pay less interest than the previously held bonds. This
reinvestment risk is of particular concern to investors living off the
proceeds of their investment.
Term Structure of Interest Rates
Relationship
between long-
and short-term
rates
The term structure of interest rates refers to the relationship between
long-term and short-term interest rates. Investors are concerned with
the term structure because it affects their investment preferences for
long- or short-term bonds. Corporate treasurers also must decide
whether to borrow by issuing long- or short-term bonds. We will
discuss how long- and short-term rates are related and what causes
changes in their relative values.
Yield Curve
Rates of return
plotted on a
graph
Interest rates on bonds of differing maturities are plotted on a graph to
illustrate their relationship. A graphic representation of the term
structure of interest rates is called a yield curve. "Yield" refers to the
rate of return on an investment. For our term structure study, the yield
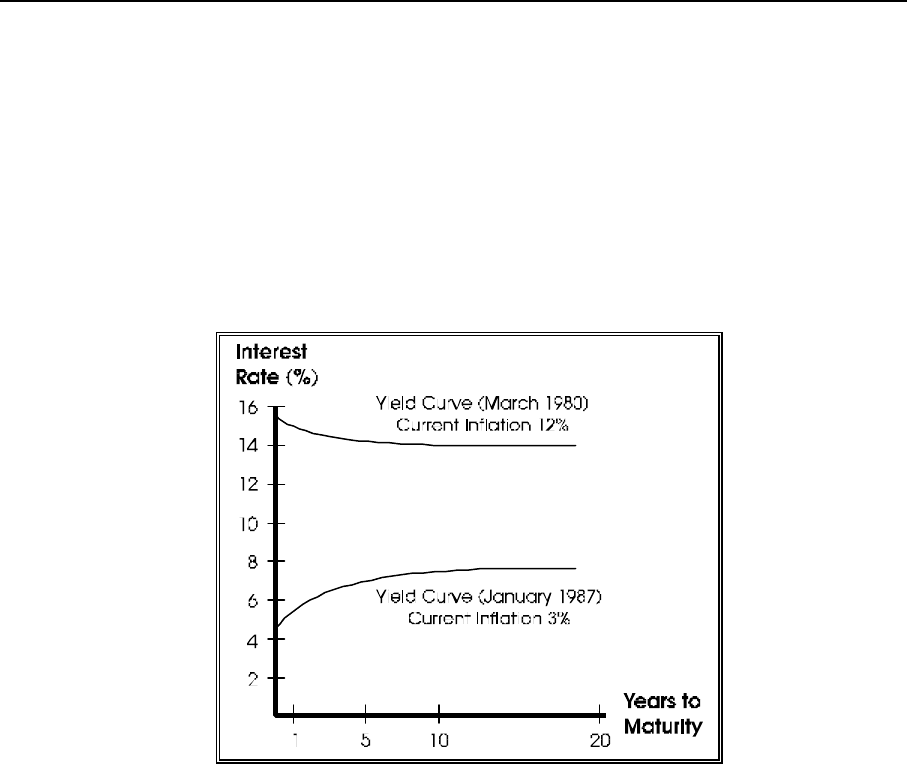
of a security is the rate of interest paid on the security. The graph in
Figure 2.1 shows yield curves for two different U.S. Treasury
securities for two different dates. Remember, interest
rates are always changing.
www.LisAri.com
FINANCIAL MARKETS AND INTEREST RATES 2-11
v.05/13/94 v-1.1
p.01/14/00
The vertical axis represents the interest rate; the horizontal axis
represents the number of years to maturity for the security. For
instance, the interest rate paid to an investor on a one-year security
in March of 1980 is 14% and the rate for a 20-year bond in January
of 1987 is 7.6%. We have not plotted every point exactly, but we
have plotted several common maturities and smoothed the curves to
illustrate the trends.
Fig. 2.1: Yield Curves for Two Different Maturities
Normal /
abnormal yield
curves
Let's examine the characteristics of the two curves. In March of 1980,
all interest rates were at relatively high levels — with long-
term rates lower than short-term rates. The January 1987 curve has
overall lower rates, with long-term rates slightly higher than short-
term rates. An upward sloping yield curve is often called a normal
yield curve, whereas a downward sloping yield curve is called an
abnormal (inverted) yield curve.
www.LisAri.com

2-12 FINANCIAL MARKETS AND INTEREST RATES
v-1.1 v.05/13/94
p.01/14/00
Normal Yield Curve Theories
Upward curve
considered
normal
There are three prevailing theories that explain why the upward sloping
yield curve is considered normal. These three theories are: the
expectations theory, the market segmentation theory, and the liquidity
preference theory.
1. Expectations Theory
The basis of the expectations theory is that the yield curve
reflects lenders' and borrowers' expectations of inflation.
Changes in these expectations cause changes in the shape of
the yield curve. Remember, the inflation premium is a major
component of interest rates.
To illustrate the expectations theory, suppose that inflation is
expected to be 4% this coming year, 6% in the year
following, and 8% in the third year. The inflation premium
(average expected yearly inflation) will be 4% for the first
year, 5% for the second year, and 6% for the third year. If the
real, risk-free rate is 3%, then the resulting Treasury Bill
interest rates (risk-free rate plus inflation premium) will be
7% for a one-year T-bill, 8% for a two-year T-Bill, and 9%
for a three-year T-bill. A change in these expectations will
cause a shift in the yield curve for the T-Bills.
1st yr 2nd yr 3rd yr
Expected inflation 4% 6% 8%
Average inflation premium 4% 5% 6%
+ Real risk-free interest rate 3% 3% 3%
= T-bill interest rate 7% 8% 9%
2. Market Segmentation Theory
Each lender and each borrower has a preferred maturity. Some
lend / borrow for long-term needs and others lend / borrow for
short-term needs. The market segmentation theory states that
the slope of the yield curve depends on supply / demand
conditions in the short-term and long-term markets.
www.LisAri.com

FINANCIAL MARKETS AND INTEREST RATES 2-13
v.05/13/94 v-1.1
p.01/14/00
An upward sloping curve results from a large supply of funds
in the short-term market relative to demand and a shortage of
long-term funds. A downward sloping curve indicates strong
demand in the short-term market relative to the long-term
market. A fairly horizontal yield curve indicates that supply
and demand for funds is roughly balanced both in the short-
term and long-term markets.
3. Liquidity Preference Theory
The liquidity preference theory is based on the observation
that long-term securities often yield more than short-term
securities. Two reasons are given to explain this:
• Investors generally prefer short-term securities, which
are more liquid and less expensive to buy and sell.
Investors require higher yield on long-term instruments
to compensate for the higher cost.
• Borrowers dislike short-term debt because it exposes
them to the risk of having to roll over the debt or raise
new principal under adverse conditions (such as a rise in
rates). Borrowers will pay a higher rate for long-term
debt than for short-term debt, all other factors being
held constant.
Under these "normal" conditions, there is a positive correlation
between risk premium increases and maturity. Therefore, the "normal"
yield curve slopes upward.
There is no evidence that any of these theories clearly explains the
shape of the yield curve and its changes. However, each theory has
some merit, and all three theories are discussed by participants in
the markets as if they were valid.
www.LisAri.com

2-14 FINANCIAL MARKETS AND INTEREST RATES
v-1.1 v.05/13/94
p.01/14/00
Effect on Stock Prices
Impact on
corporate
profits
Interest rates indirectly impact stock prices through their effect on
corporate profits. The payment of interest is a cost to companies – the
higher the level of interest rates, the lower the level of corporate
profits (other factors held constant). Interest rates affect the level of
economic activity which, in turn, affects corporate profits.
Even more directly, interest rates affect the competition for funds
(capital) between stocks and bonds. Higher interest rates mean that
investors receive a higher return on their bond investments. High
bond yields induce investors to sell their stock holdings and invest in
more bonds. The reverse occurs when interest rates fall.
The effect of interest rates on corporate profits is more important
for individual companies, especially those with high debt levels. The
direct competition for capital has a more widespread effect on the
general stock price level for the entire economy.
UNIT SUMMARY
In this unit, we discussed the types of financial markets — money
markets and capital markets. There are two subsets of capital
markets — bond (debt) and equity markets. Players in the markets
include investors / lenders, issuers / borrowers, brokers, and dealers.
We said that investors' expectations of return on investment and
consumers' preferences for saving versus spending are two market
characteristics that affect the level of interest rates.
Interest rates required by investors are the sum of three factors:
Risk-free real rate (r
*
)
+ Premium for inflation (IP)
+ Premium for risk (RP)
= Interest rate (r)
r = r
*
+ IP + RP
www.LisAri.com

FINANCIAL MARKETS AND INTEREST RATES 2-15
v.05/13/94 v-1.1
p.01/14/00
Each of these factors fluctuates, given current and expected conditions
of the economy, the company, and the market in which the company
conducts business. Interest rates compensate investors for loaning
money, for anticipated inflation, and for assuming counterparty,
liquidity, and interest rate risk.
The term structure of interest rates is represented by a yield curve
and refers to the relationship between long-term and short-term
interest rates.
You have completed Unit Two: Financial Markets and Interest Rates. Please complete
Progress Check 2 and then continue to Unit Three: Time Value of Money. If you answer
any questions incorrectly, we suggest that you review the appropriate text.
www.LisAri.com

2-16 FINANCIAL MARKETS AND INTEREST RATES
v-1.1 v.05/13/94
p.01/14/00
(This page is intentionally blank)
www.LisAri.com

FINANCIAL MARKETS AND INTEREST RATES 2-17
v.05/13/94 v-1.1
p.01/14/00
4 PROGRESS CHECK 2
Directions: Select the one best answer for each question, unless otherwise indicated.
Check your responses with the Answer Key on the next page.
1. Match each market player with a description of his/her role. Write the letter of the
role next to the title of the market player.
Market Players Roles
____ Investor
____ Issuer
a) Financial intermediary that buys and sells
securities
____ Broker
b) Entity with more money than it needs
____ Dealer c) Entity in need of money
d) Financial intermediary that facilitates the
buying and selling of securities
2. The most liquid, lower-risk securities are traded in the:
_____a) bond market.
_____b) equity market.
_____c) money market.
_____d) derivative market.
3. QRS Manufacturing Company decides to "take the company public." This means
it will:
_____a) sell bonds to the public through the debt market.
_____b) issue stock in the primary equity market.
_____c) offer certificates of deposit in the money markets.
_____d) derive its funding from the derivatives market.
www.LisAri.com